
As water flows across our planet's surface, hydrologists and ecologists use hydrological maps to learn more about the mysteries of this miracle substance. Decades of advanced mapping software development have led to these maps becoming less niche – making it easier for artists and enthusiasts to design sleek, aesthetic maps.
Let's take a look at the world of hydrological mapping, and talk about the various features you may come across when learning how to read them.
What are hydrological maps?
Like their name implies, hydrological maps are designed to show the movement of water across land – which sounds a bit vague when you consider just how much water there is. You can find hydrology maps for virtually every region on Earth, especially in countries like the United States where the science of hydrology is fundamental to the success of many important industries.
Water is the main feature of all hydrological maps; however, the particular scale of water involved can change depending on why the map was designed or what the map shows. For those of us who aren’t cartographers or hydrology experts, this can be a bit confusing – so here are some of the main features you’ll likely come across within these complex maps:
-
Streams, creeks, rivers, and other smaller offshoots
-
Lakes or basins, and other larger bodies of water
-
Coastal water features, which may or may not be included depending on the map
Many maps are designed only taking into account surface water – water which flows downhill. Groundwater, on the other hand, is much more difficult to display on a map depicting the surface of our planet.
Who would want to use a hydrological map?
Originally, these maps were used as visual aids by organizations like the United States Geological Survey (USGS) to convey important scientific information. Similar to topographic maps, hydrological maps are a fusion of art and science, which makes them highly accessible for those of us who aren’t data analysts or hydrologists.
No longer a secret art form kept hidden within the hard sciences, you can now find a wide selection of beautiful and affordable maps available for sale covering practically any region on the planet.
With that being said, knowing how to read a hydrological map isn’t a worthless skill. Familiarizing yourself with some of the terminology may even make owning one of these maps more enjoyable for you, even if you aren't into advanced cartography.
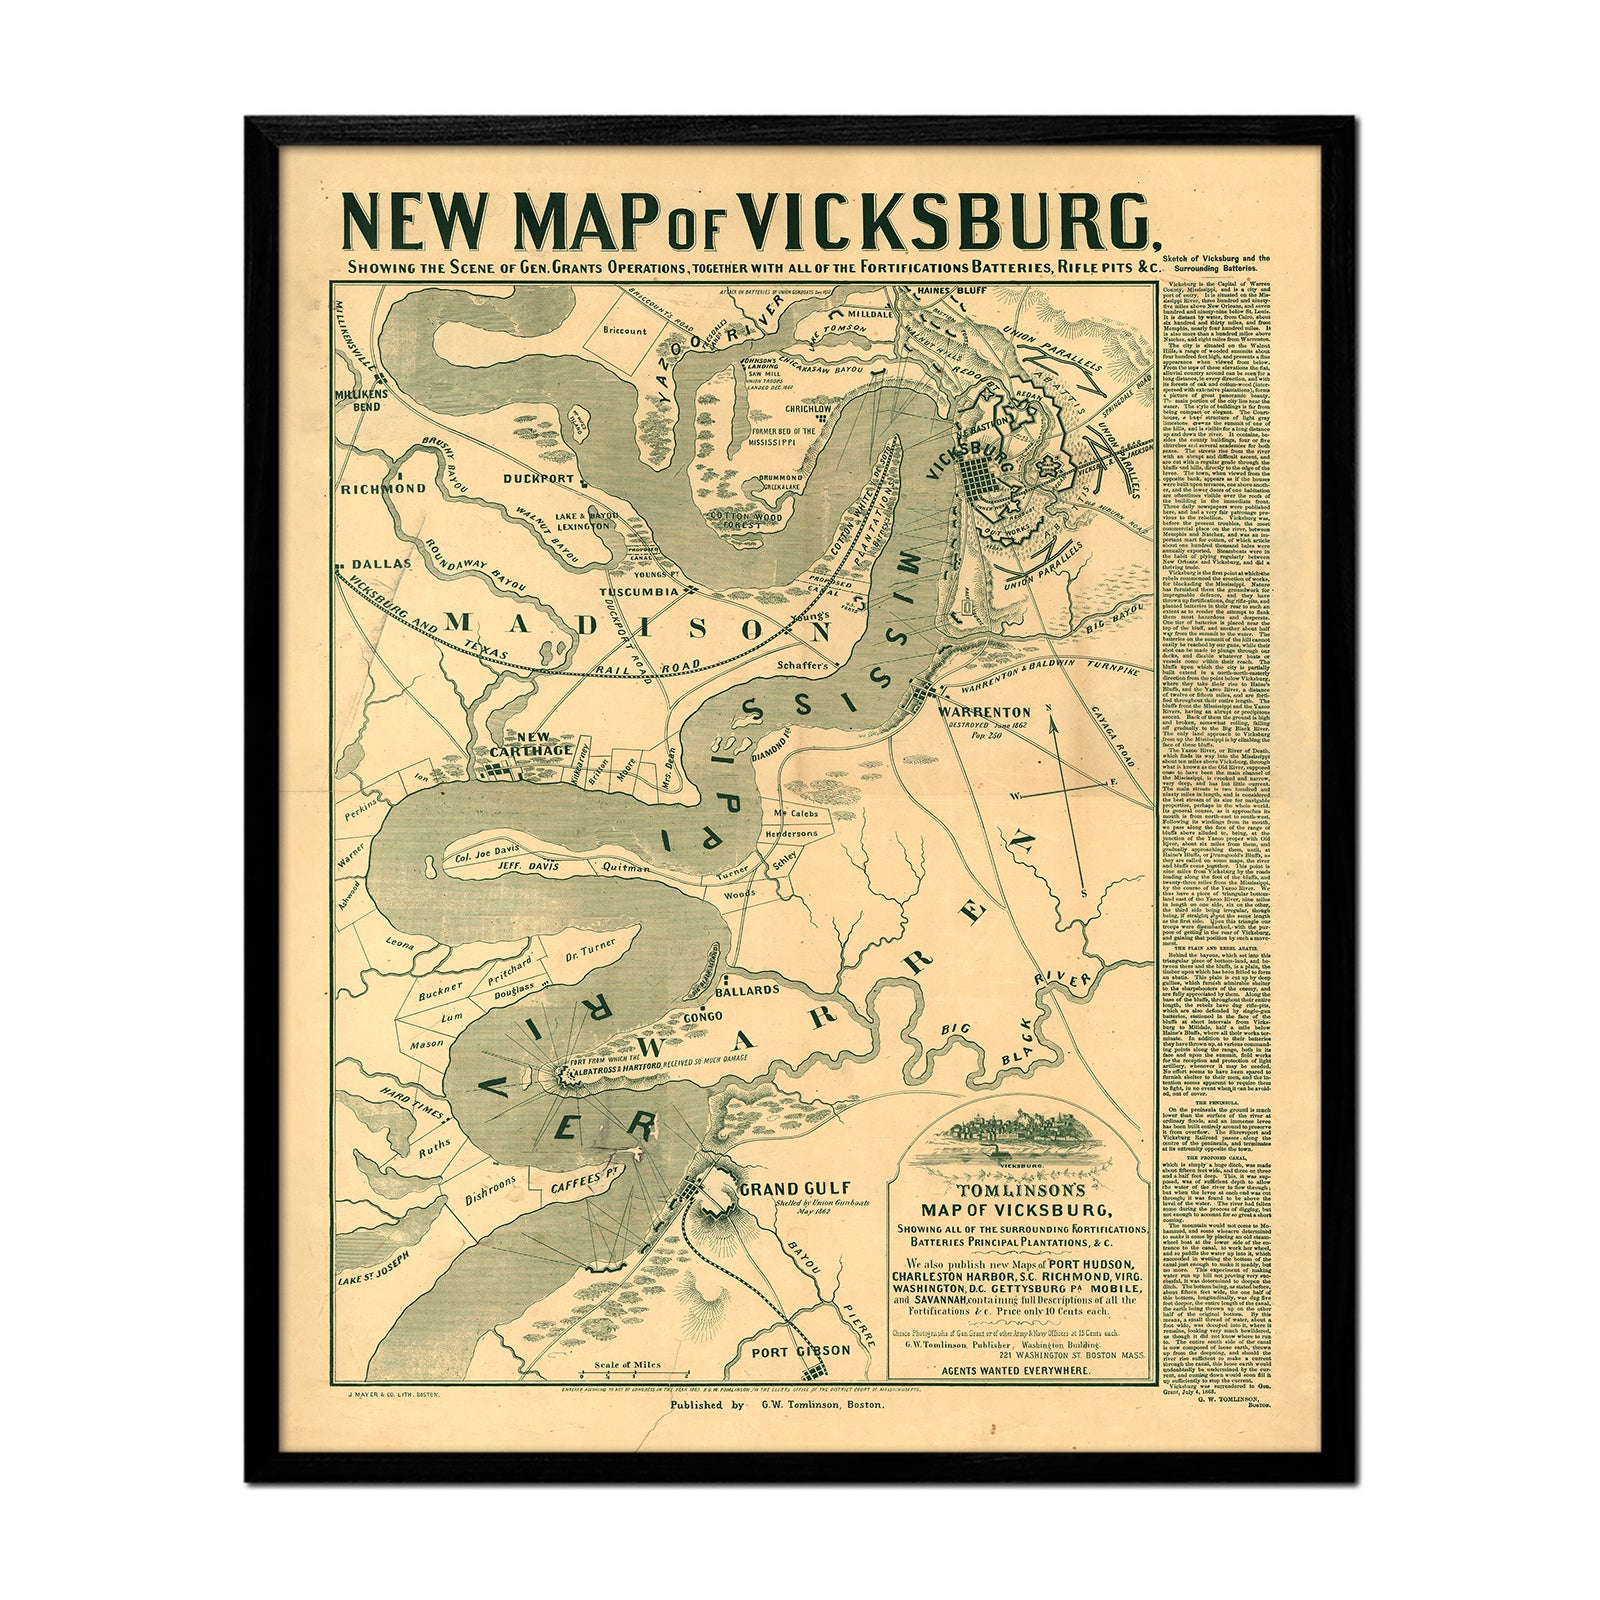
The Hydrology Maps Series by Muir Way
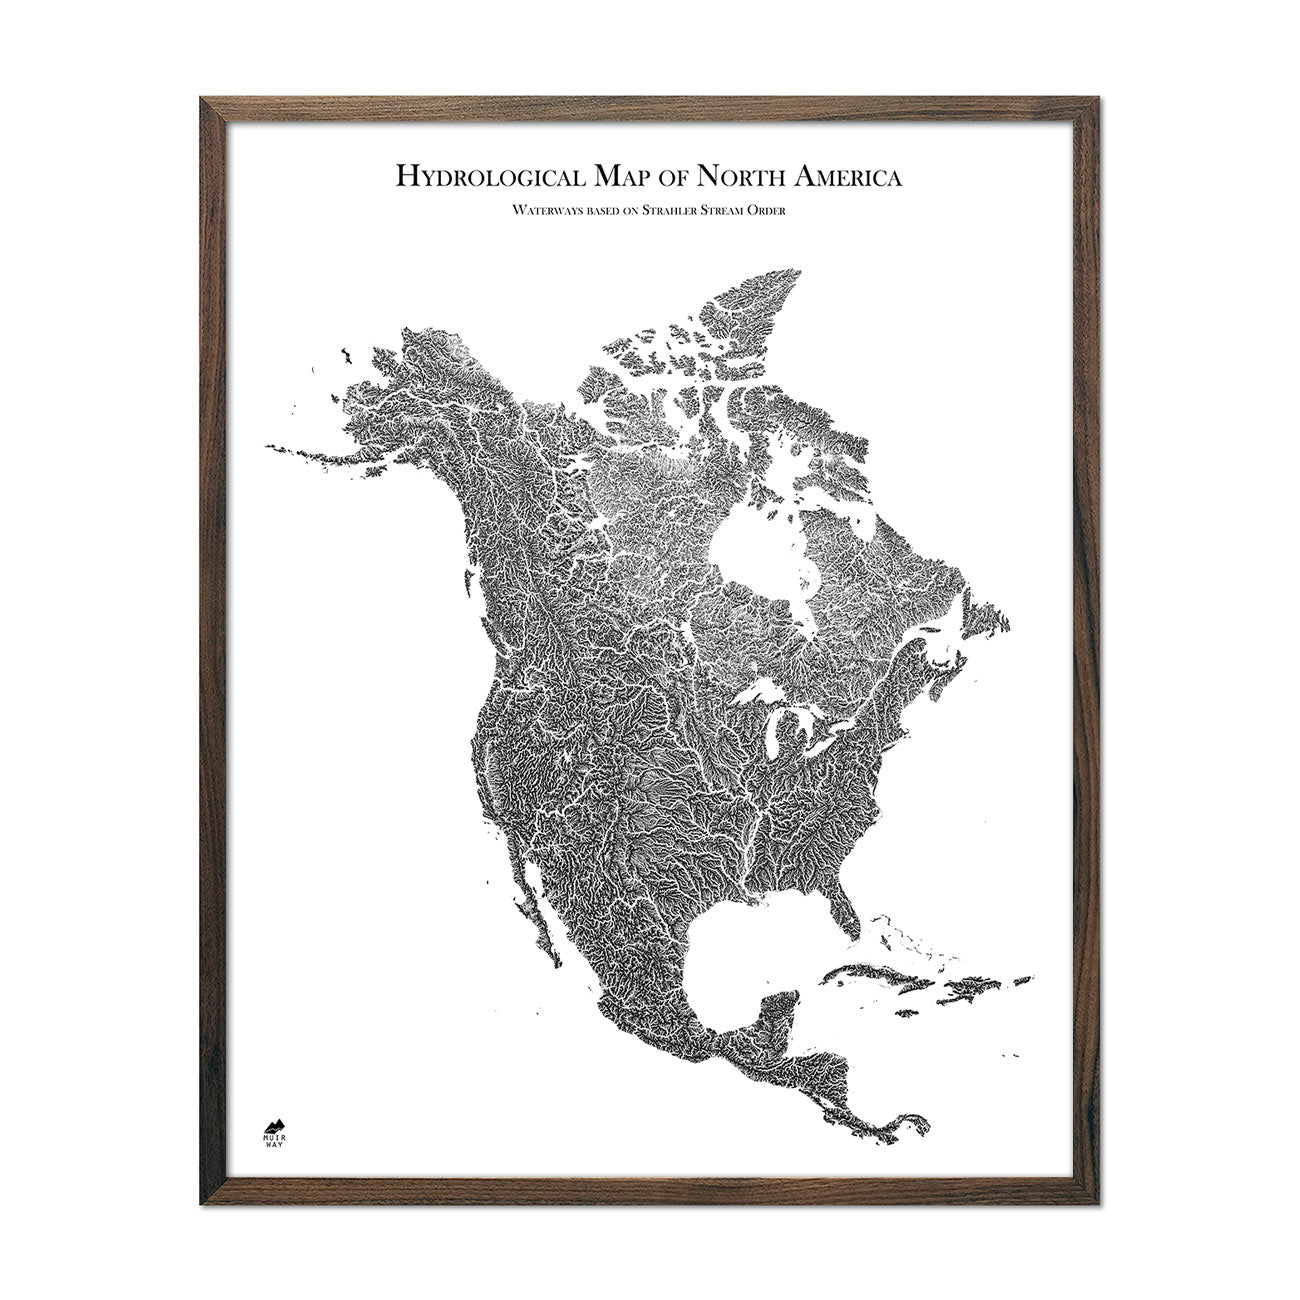
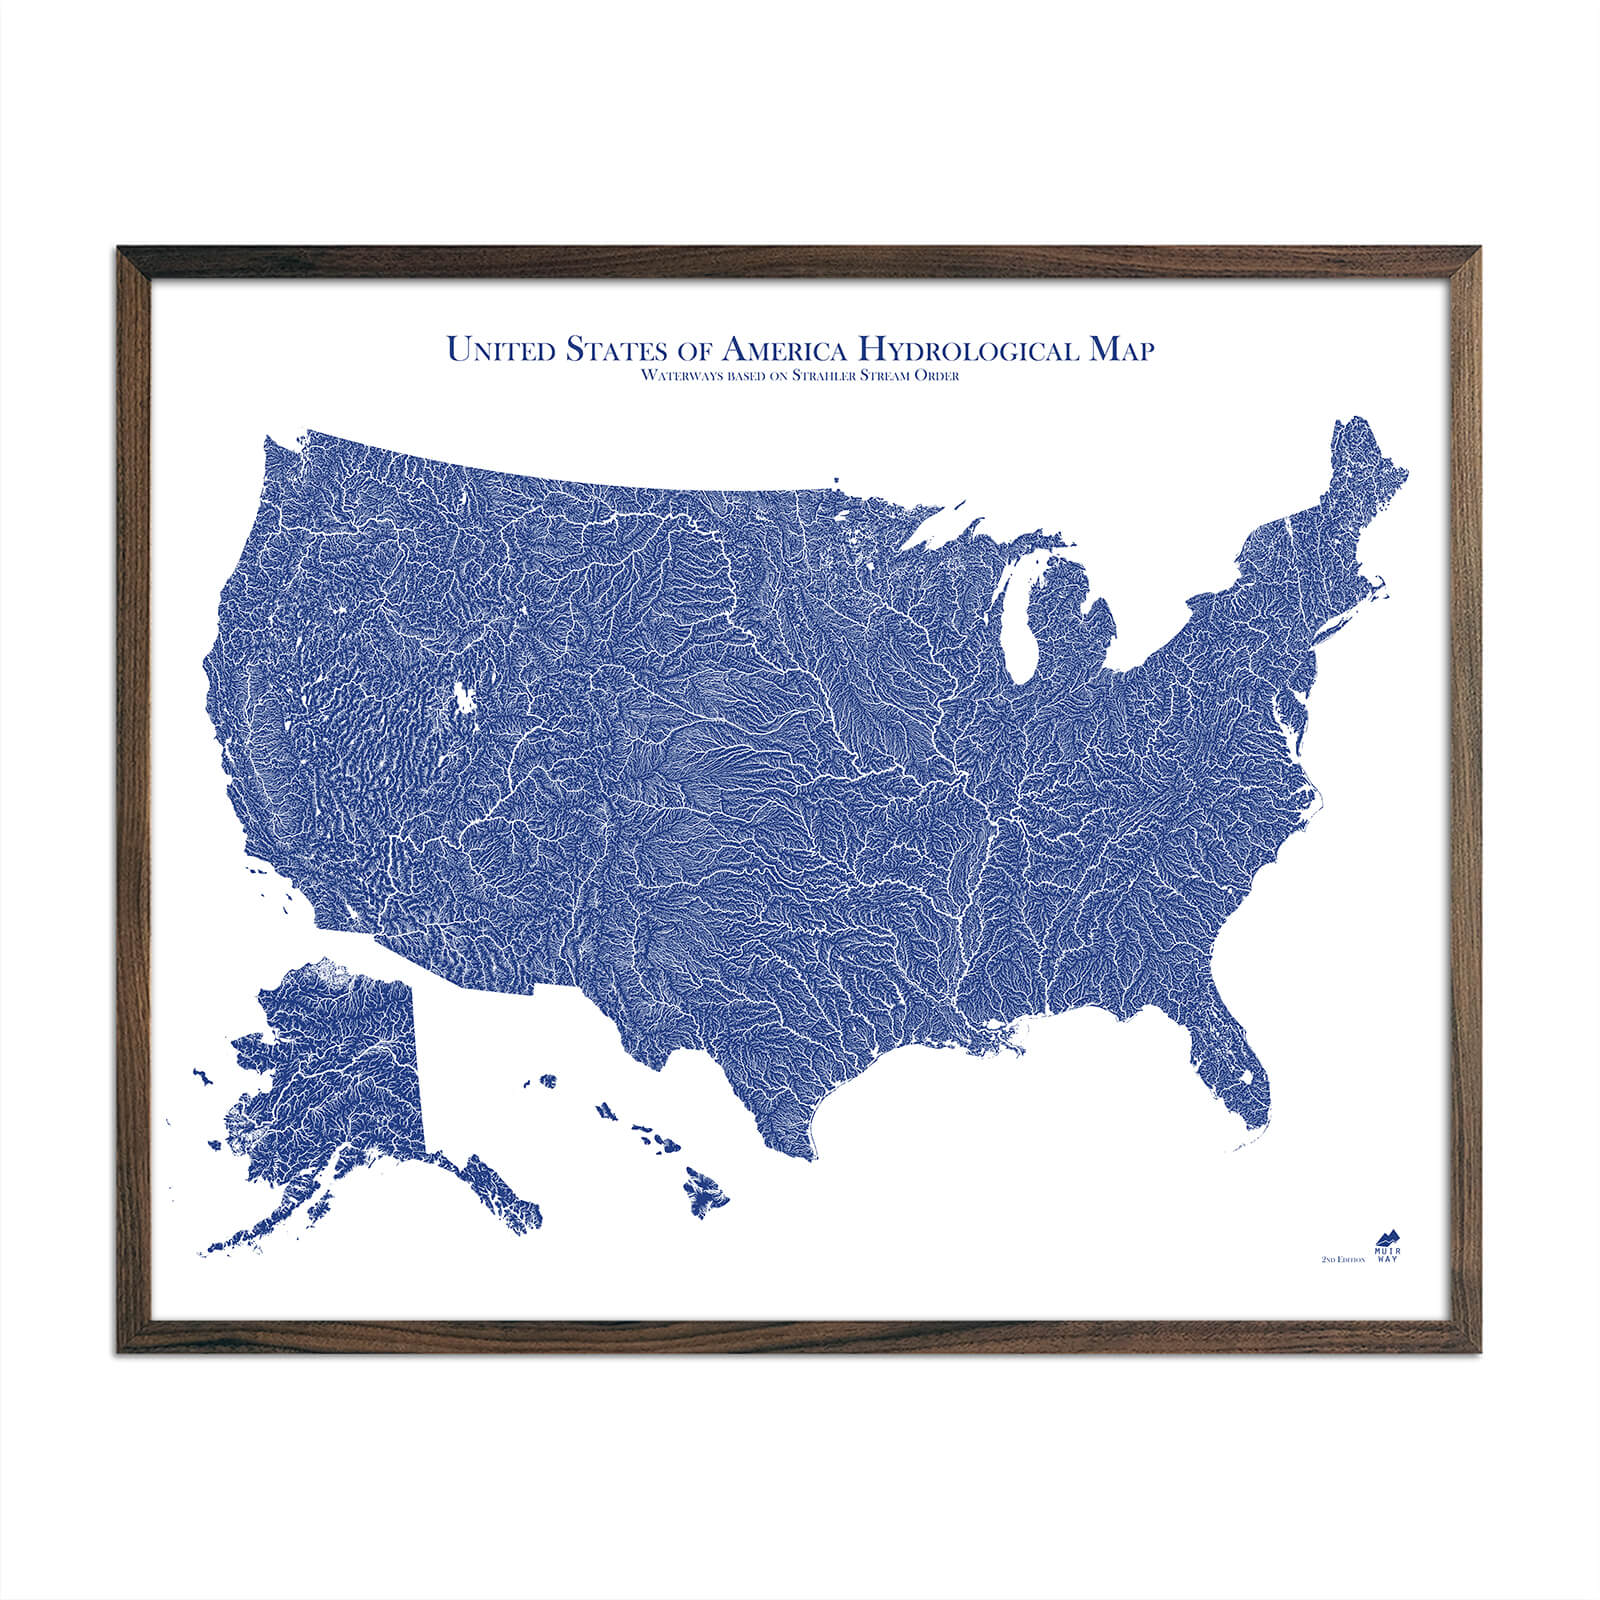
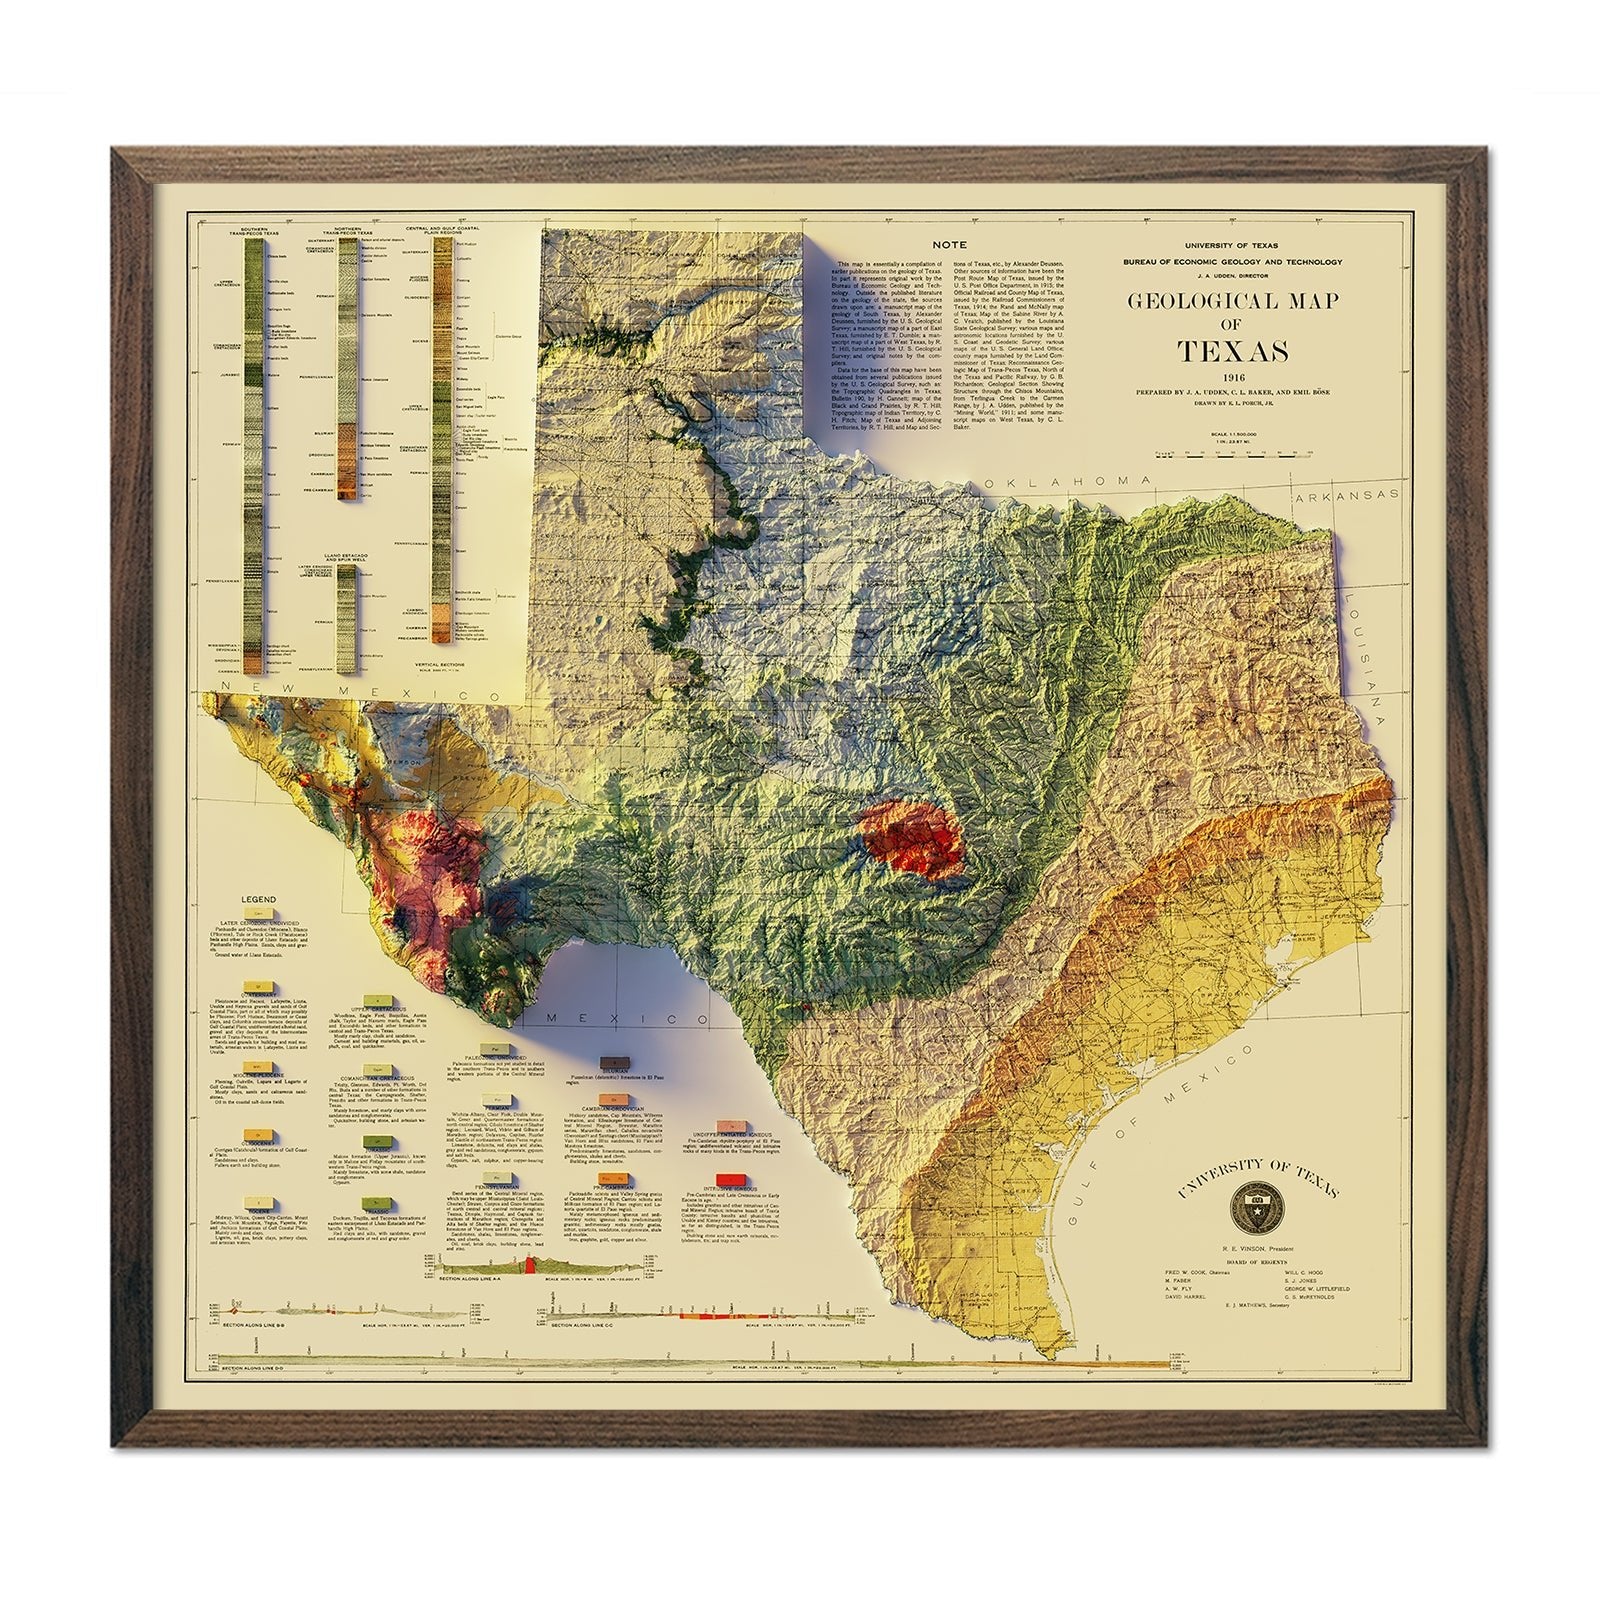
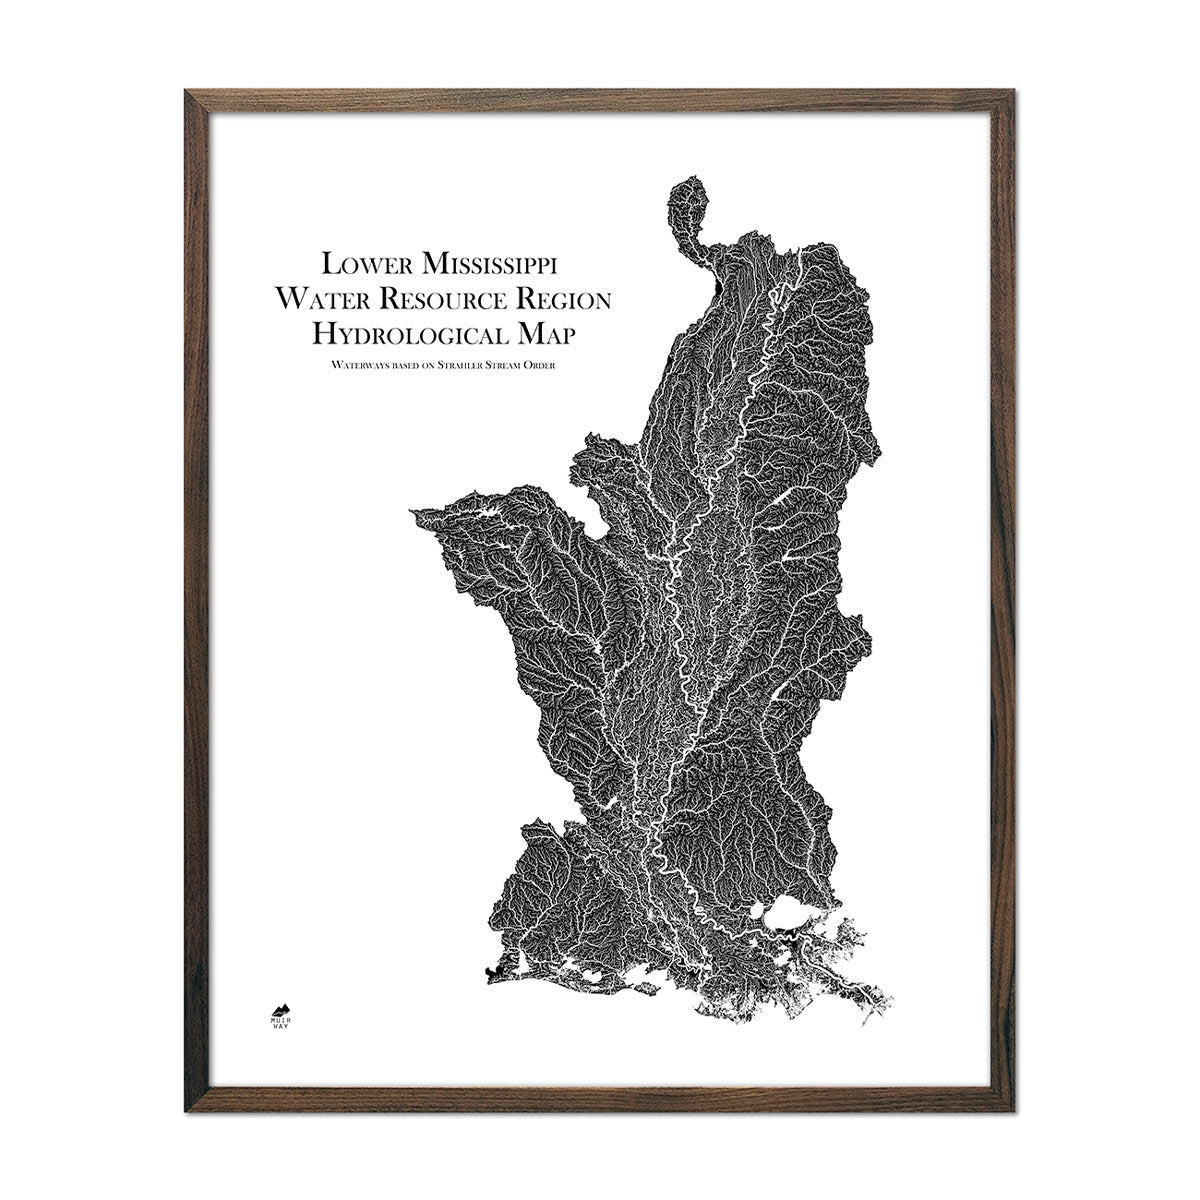
If you’re on the hunt for hydrological map art, you’re going to want to browse our updated hydrology series, which features waterway maps of almost every region within the US. These maps are sleek, stylized, and come in a variety of different colors set against a white background free from text or map legend clutter.
Using the Strahler stream order – which you can learn about below – our cartographers have designed accurate, aesthetically pleasing maps depicting streams, rivers, lakes, and other bodies of water across the 50 states.
Some of the best-sellers include hydrological maps of:
-
The United States: a super detailed US hydrological map featuring all 50 states
-
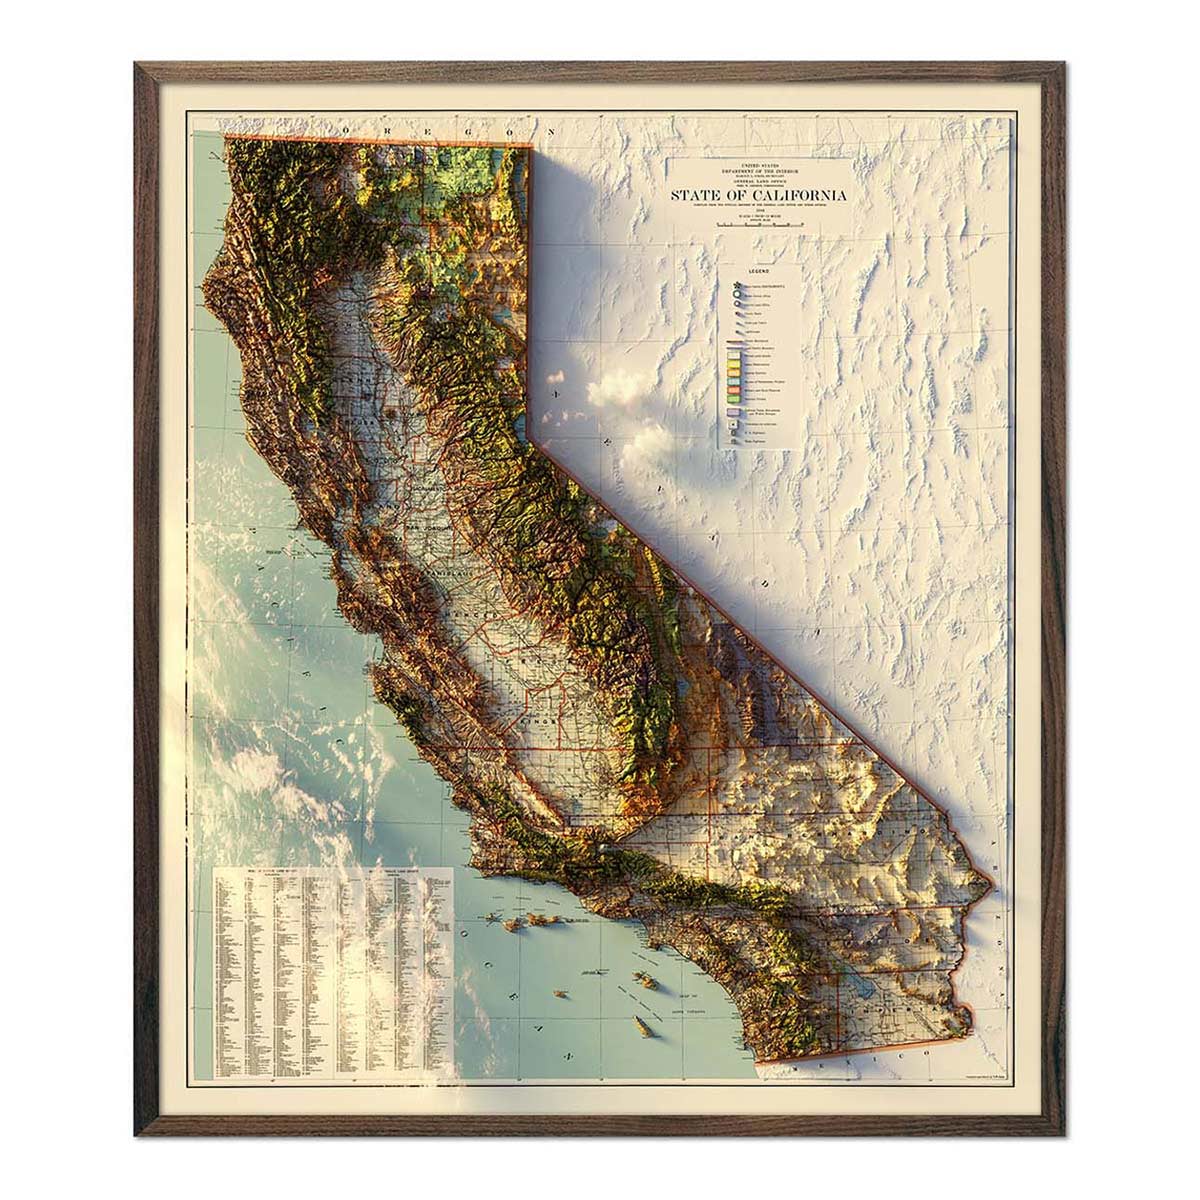
The State of California: which depicts how the state’s rivers and streams flow and interconnect
-
The State of Hawaii: a unique map showing just how precious freshwater is to this island state
If any of our hydrologic maps catch your eye, you may also appreciate our series of topographic maps. These maps, which are similar to elevation maps, are used by scientists and outdoor enthusiasts to navigate changes in elevation across landscapes – but also make a great gift for any outdoor enthusiast.
How can you read a hydrological map?
Compared to reading a topographic map, reading a hydrological map is a bit easier. Water systems are complex, and due to their complexity, hydrologic maps are often designed with a focus on one specific subsystem or sub-region. First, let’s go over some basic hydrologic units:
Hydrologic unit system
To make things easier for scientists, hydrologists came up with a hierarchical system of hydrologic units. Each of these units are assigned a Hydrologic Unit Code (HUC) for easy identification, and cover a range of average sizes in square miles.
-
Regions are around 175,000 square miles, and can account for entire regions which contain the drainage areas of major rivers or series of rivers, such as the Midwest region of the overall US hydrological map.
-
Subregions are around 15,000 square miles, and are smaller areas within larger regions. These sub-regions contain things like river system drainage areas, reaches of rivers, and groups of smaller streams.
-
Basins are about 10,000 square miles, and are massive depressions in the Earth’s surface in which large water basins are located.
-
Sub-basins, watersheds, and sub-watersheds are the final hydrologic units, and make up increasingly smaller square mile areas; with a watershed being where water basins divide into different areas of drainage.
Here’s what water resource basins in the US look like:

These different units make it easy for hydrologists and ecologists to separate areas, sort them depending on water scarcity or abundance, and perform necessary research and field testing to solve any issues they’re working on.
Strahler stream order
On a hydrological map, you may notice that many streams are numbered. The Strahler stream order is a way for scientists to assign numeric codes to branches of a stream network – making it easier to sort and order streams based on how many tributary branches they have.

As you can see, links in the chain that end without flowing into further streams have a Strahler number of one – the further back you trace the origin of the stream, the larger the Strahler number. If two number one streams – also known as first-order streams – meet and join flows, the Strahler stream order would become a second-order stream.
In some cases, like if a first-order (end of the chain) stream flows into a different second-order (previous link in the chain) stream, the stream order won’t increase.
Map legends and other details
Maps that are used by organizations like the USGS will generally feature a map legend and other details along the map margins. These symbols and numbers will keep you informed about things such as:
-
When the map was created or updated
-
What region the map covers
-
Nearby mountain ranges, valleys, and other geologic landmarks
-
What certain symbols or lines mean
-
The scale of the map
Using ArcGIS Pro and other programs
Water is a complicated beast, and studying its flow and how it affects ecosystems, plants, animals, and humans is most often done using software like ArcGIS Pro, instead of a printed map.
While we won’t be going into too much detail about these kinds of programs, here’s a rundown of what hydrologists use them for:
-
Identifying watersheds
-
Calculating flow direction and accumulation
-
Defining the Topographic Wetness Index (TWI)
-
Exploring digital elevation models of specific regions
If this sort of stuff interests you, I’d take a look at Jenness Enterprise’s video on basic hydrologic analysis in ArcGIS Pro.
Final thoughts
Reading a hydrological map is easy when you get a handle on the basics. Additionally, modern map designs have been simplified in an artistic way that allows us to appreciate them for their other qualities – it's not all about science.
Now that you've familiarized yourself with reading them, finding a unique hydrological map for your own home should be a breeze.