

Shaded Relief Series
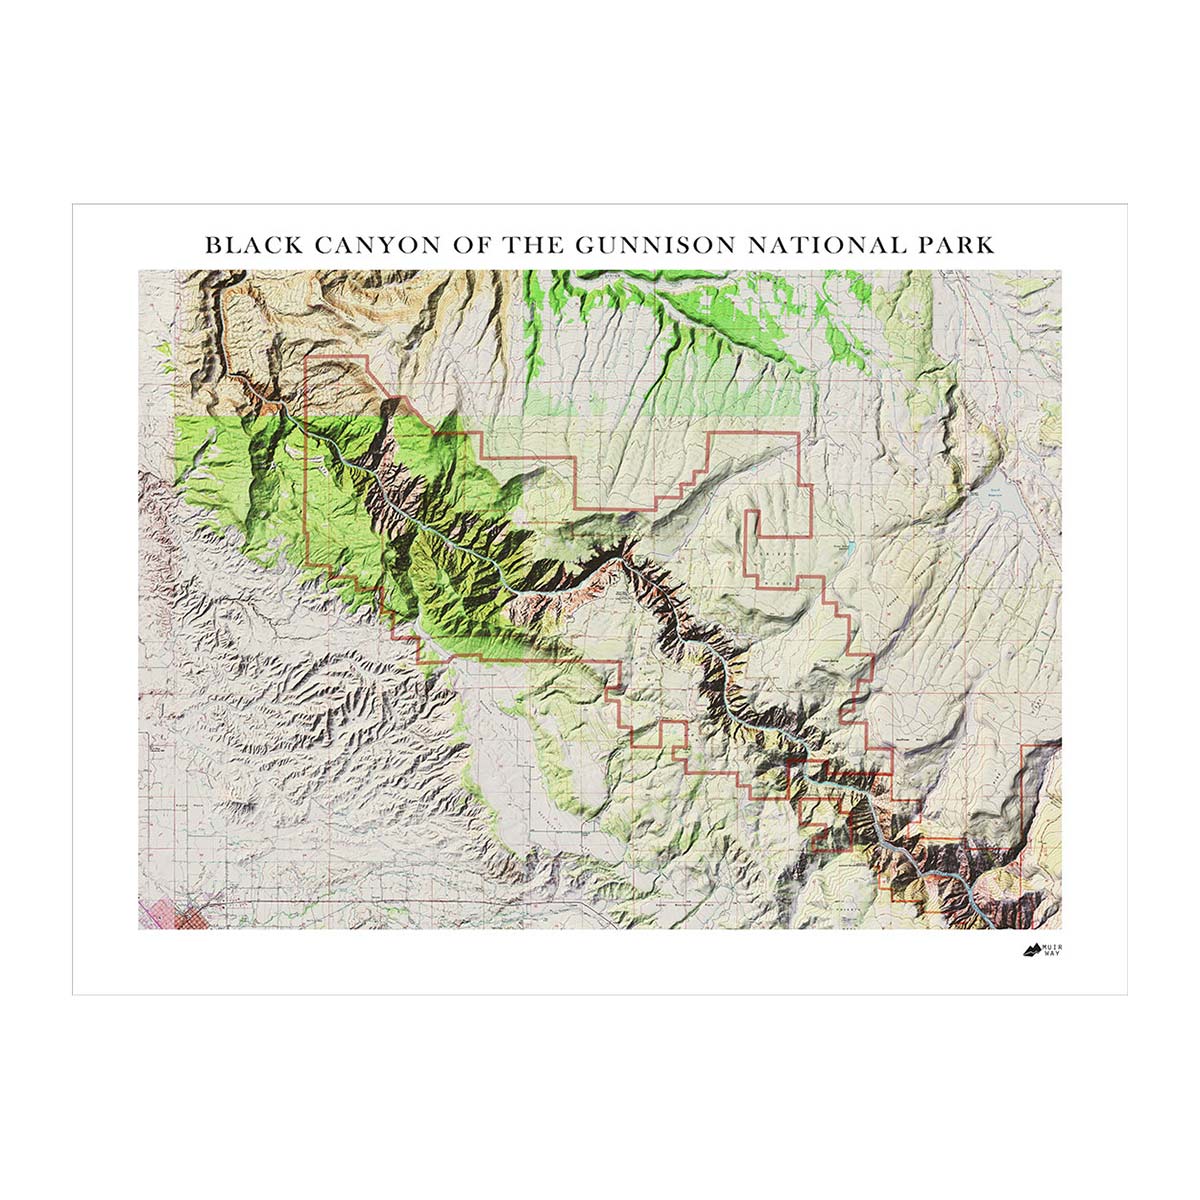
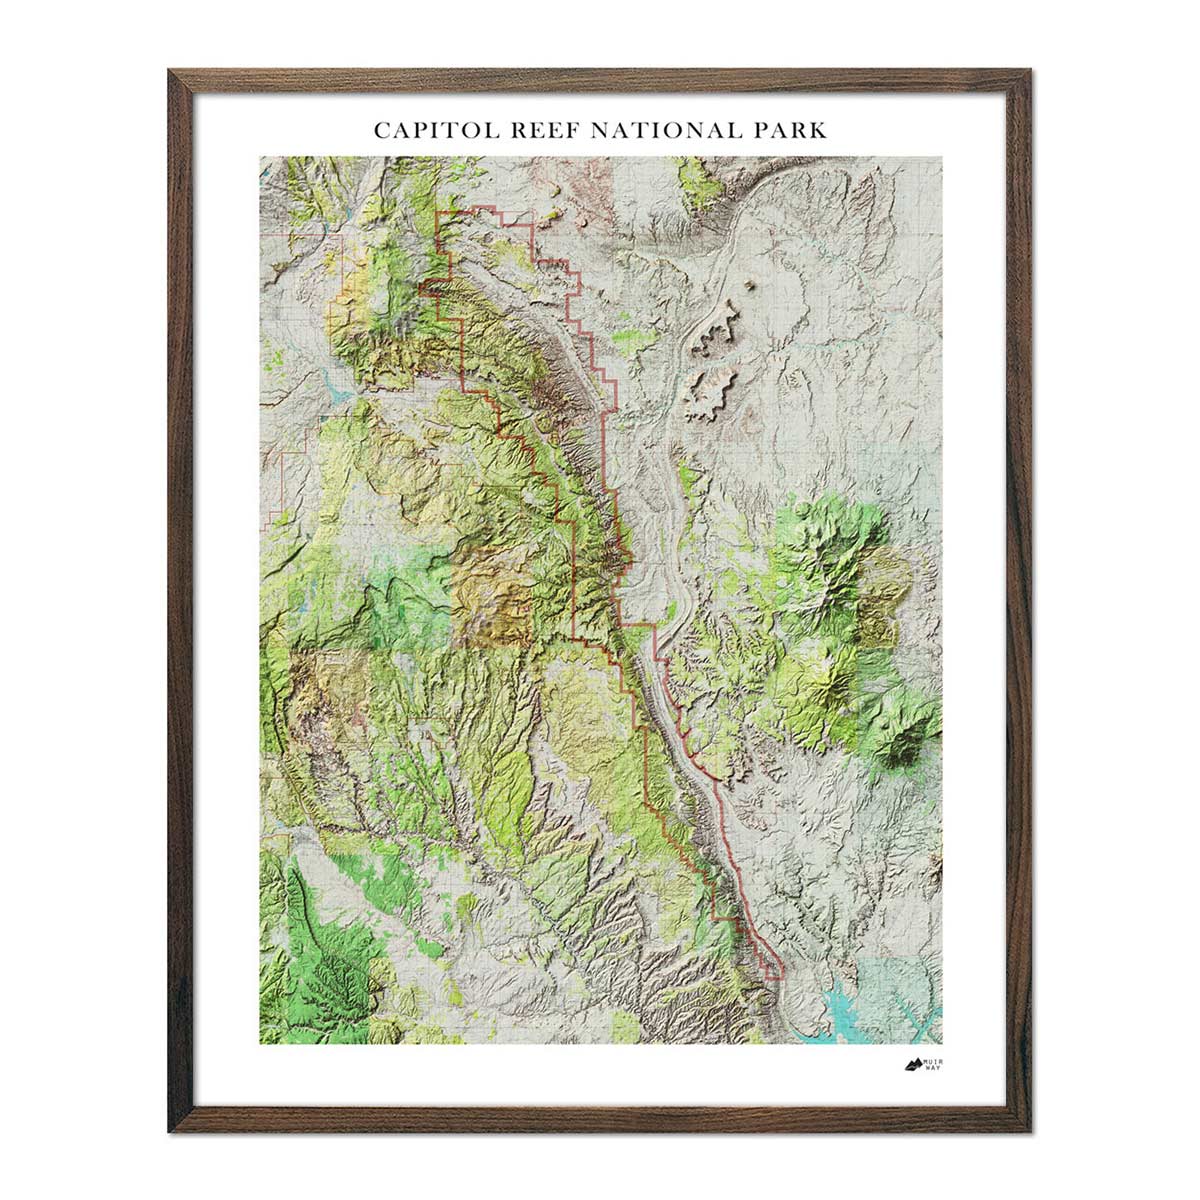


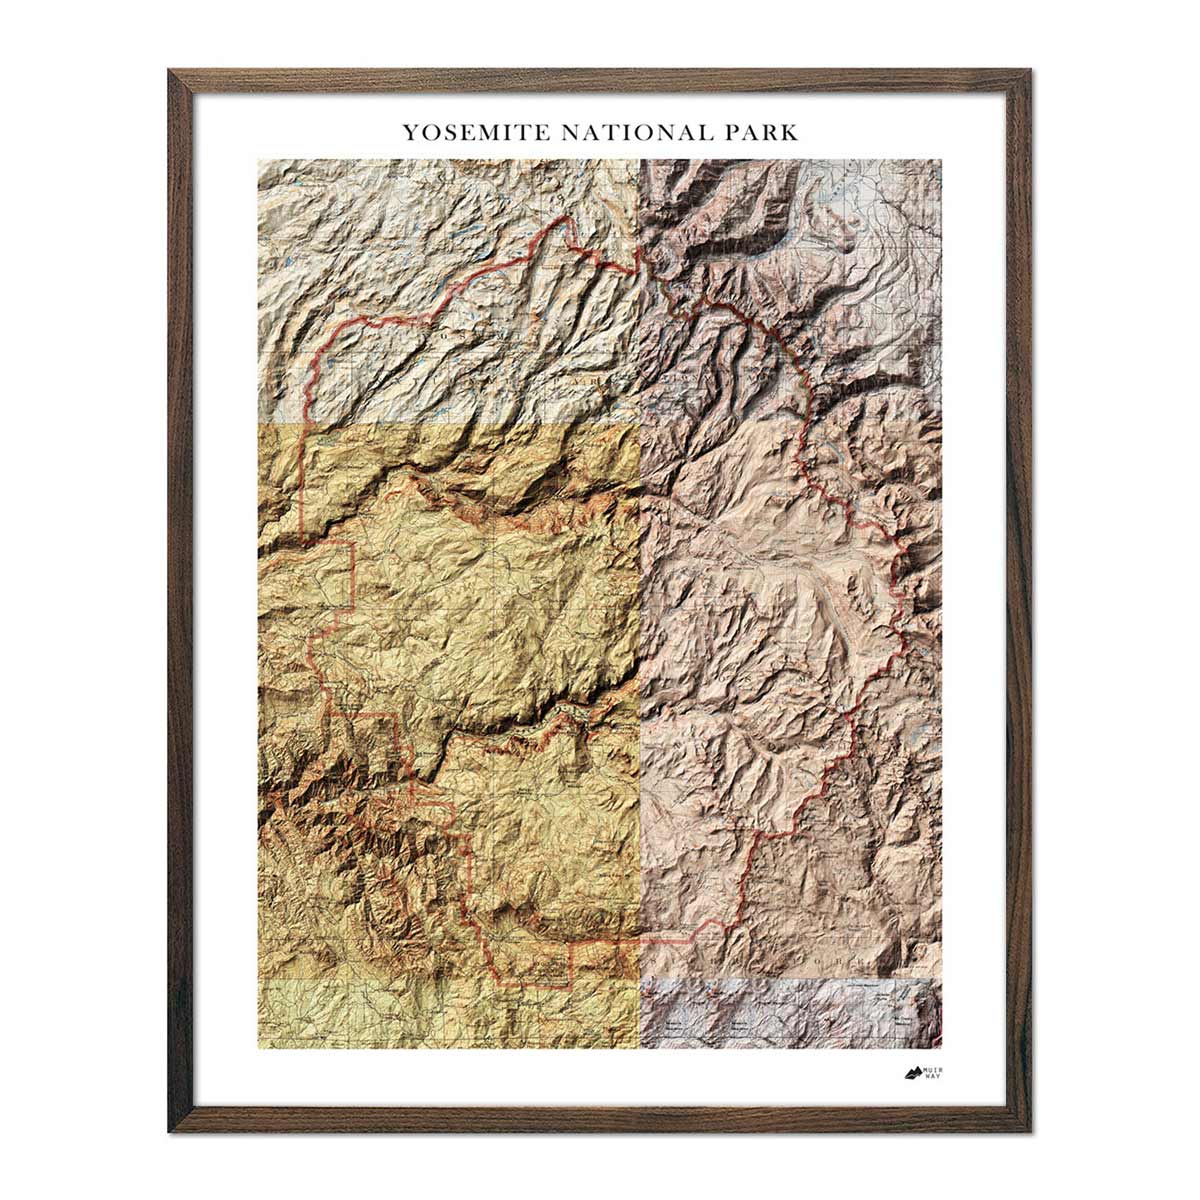
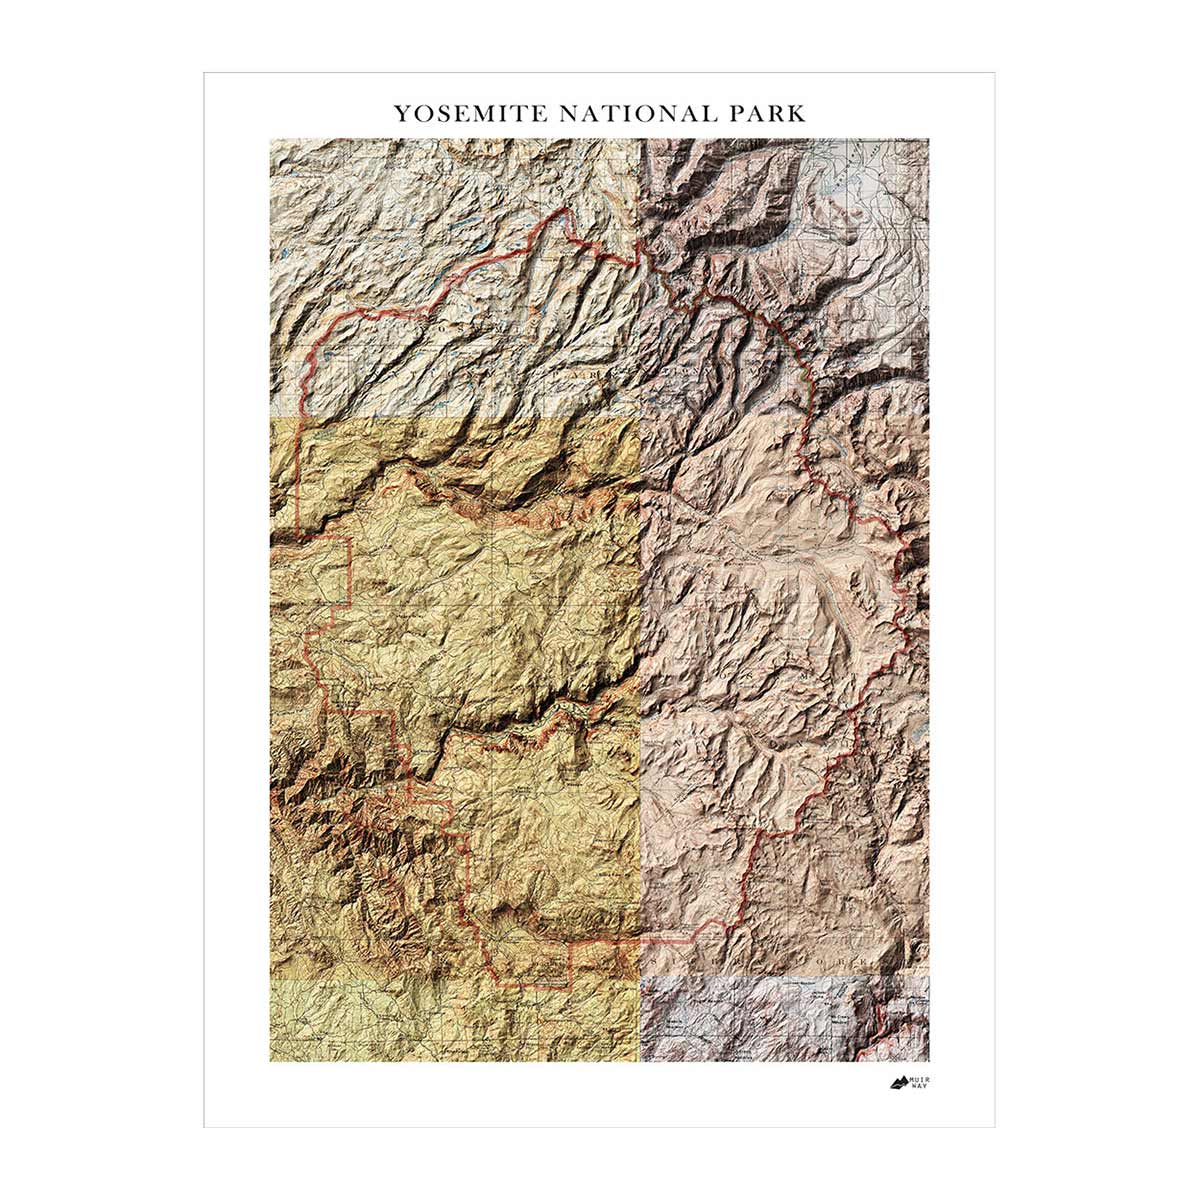
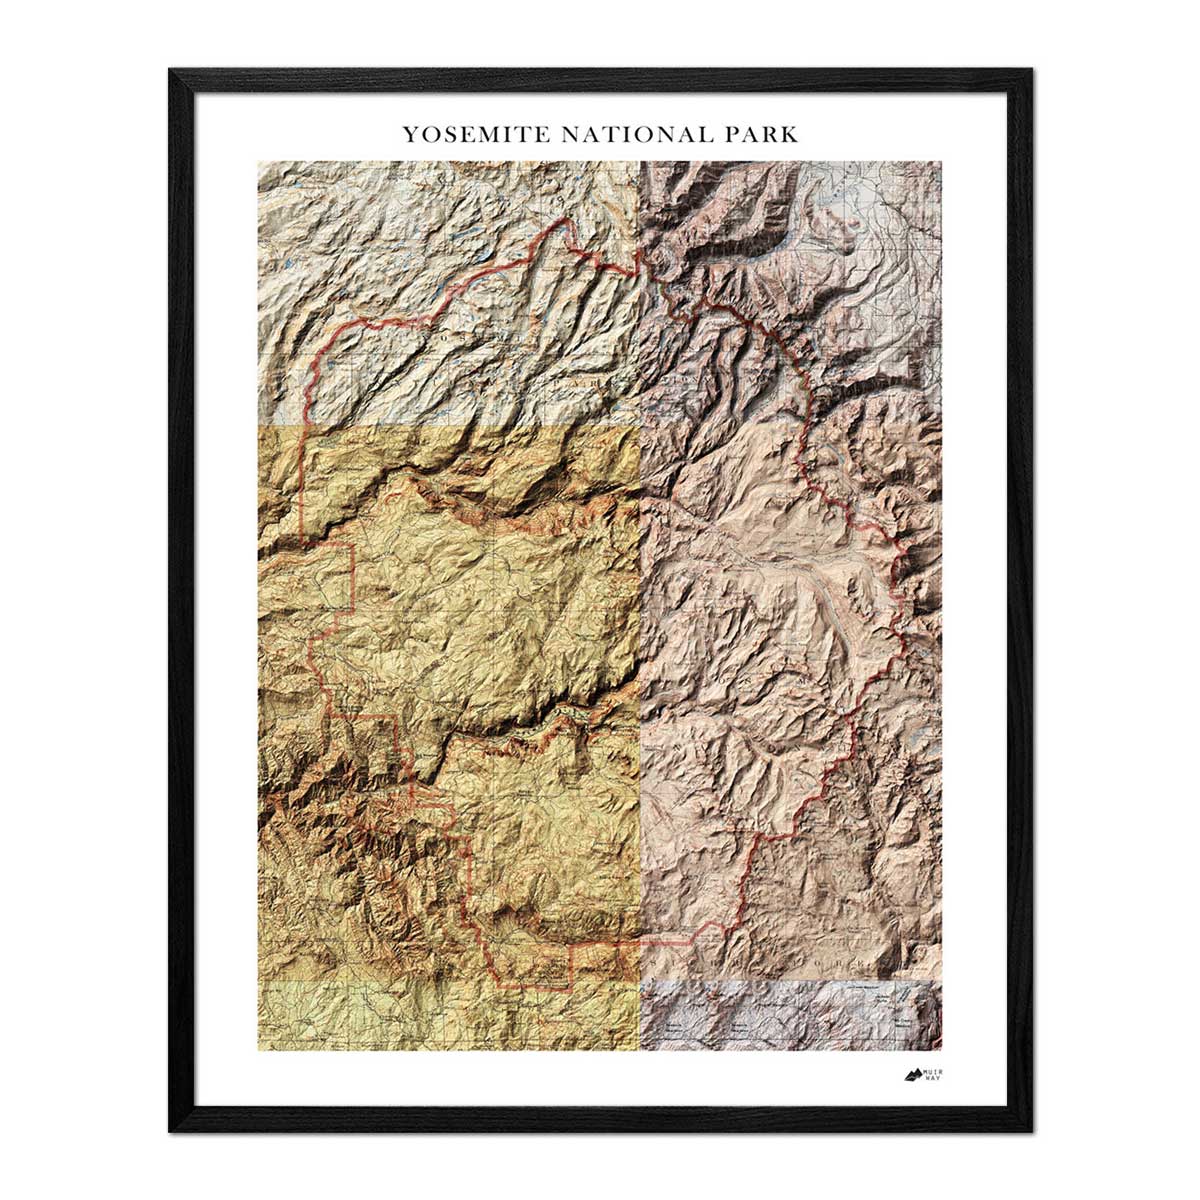
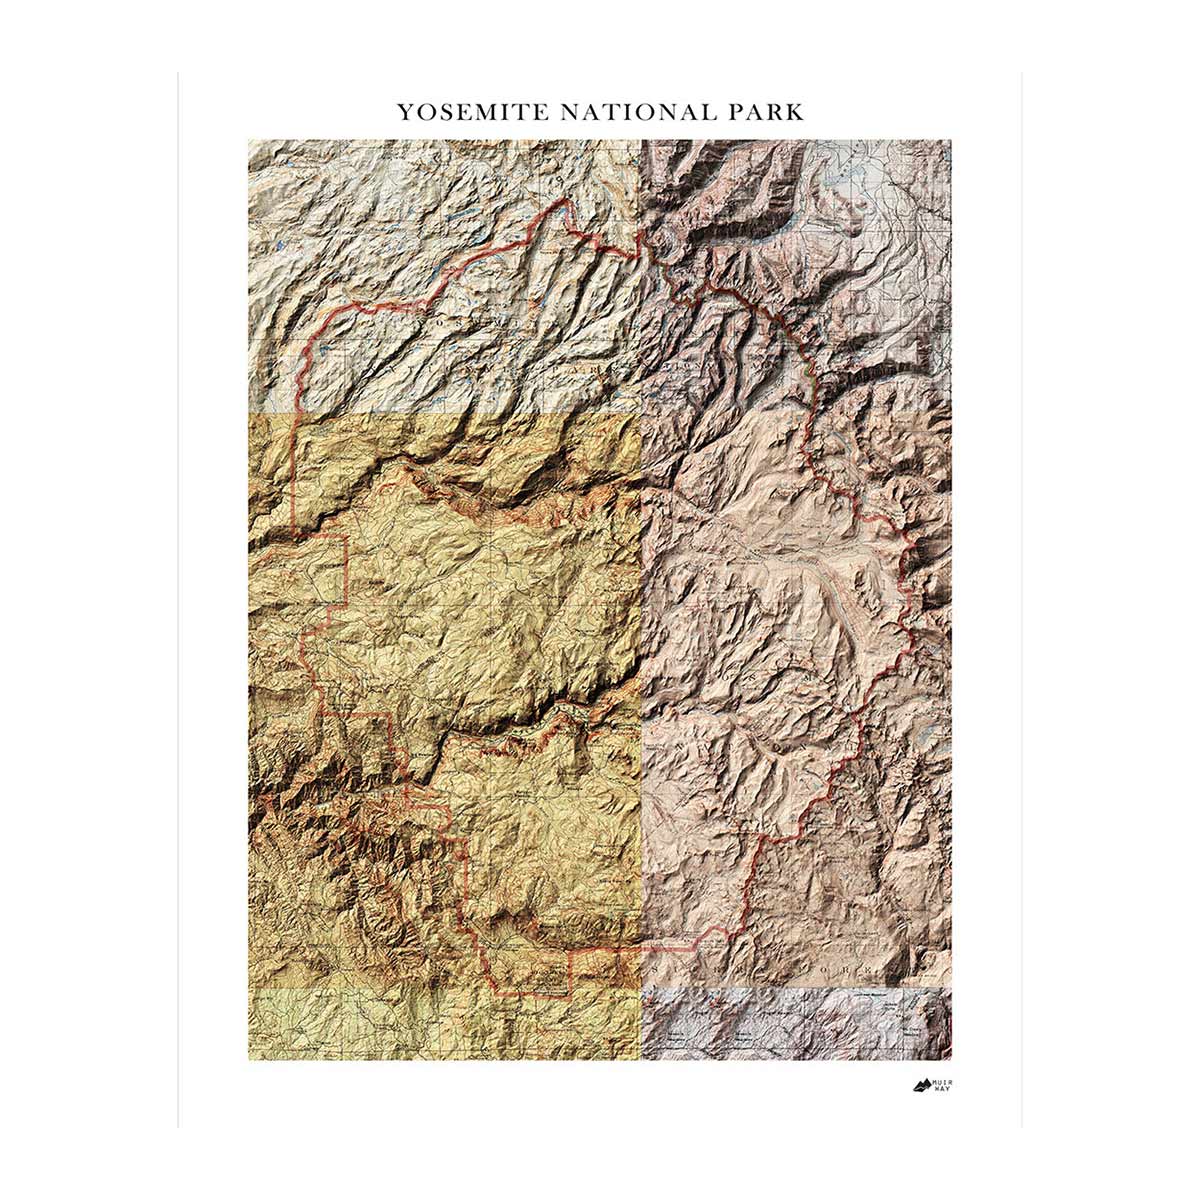
Relief Maps
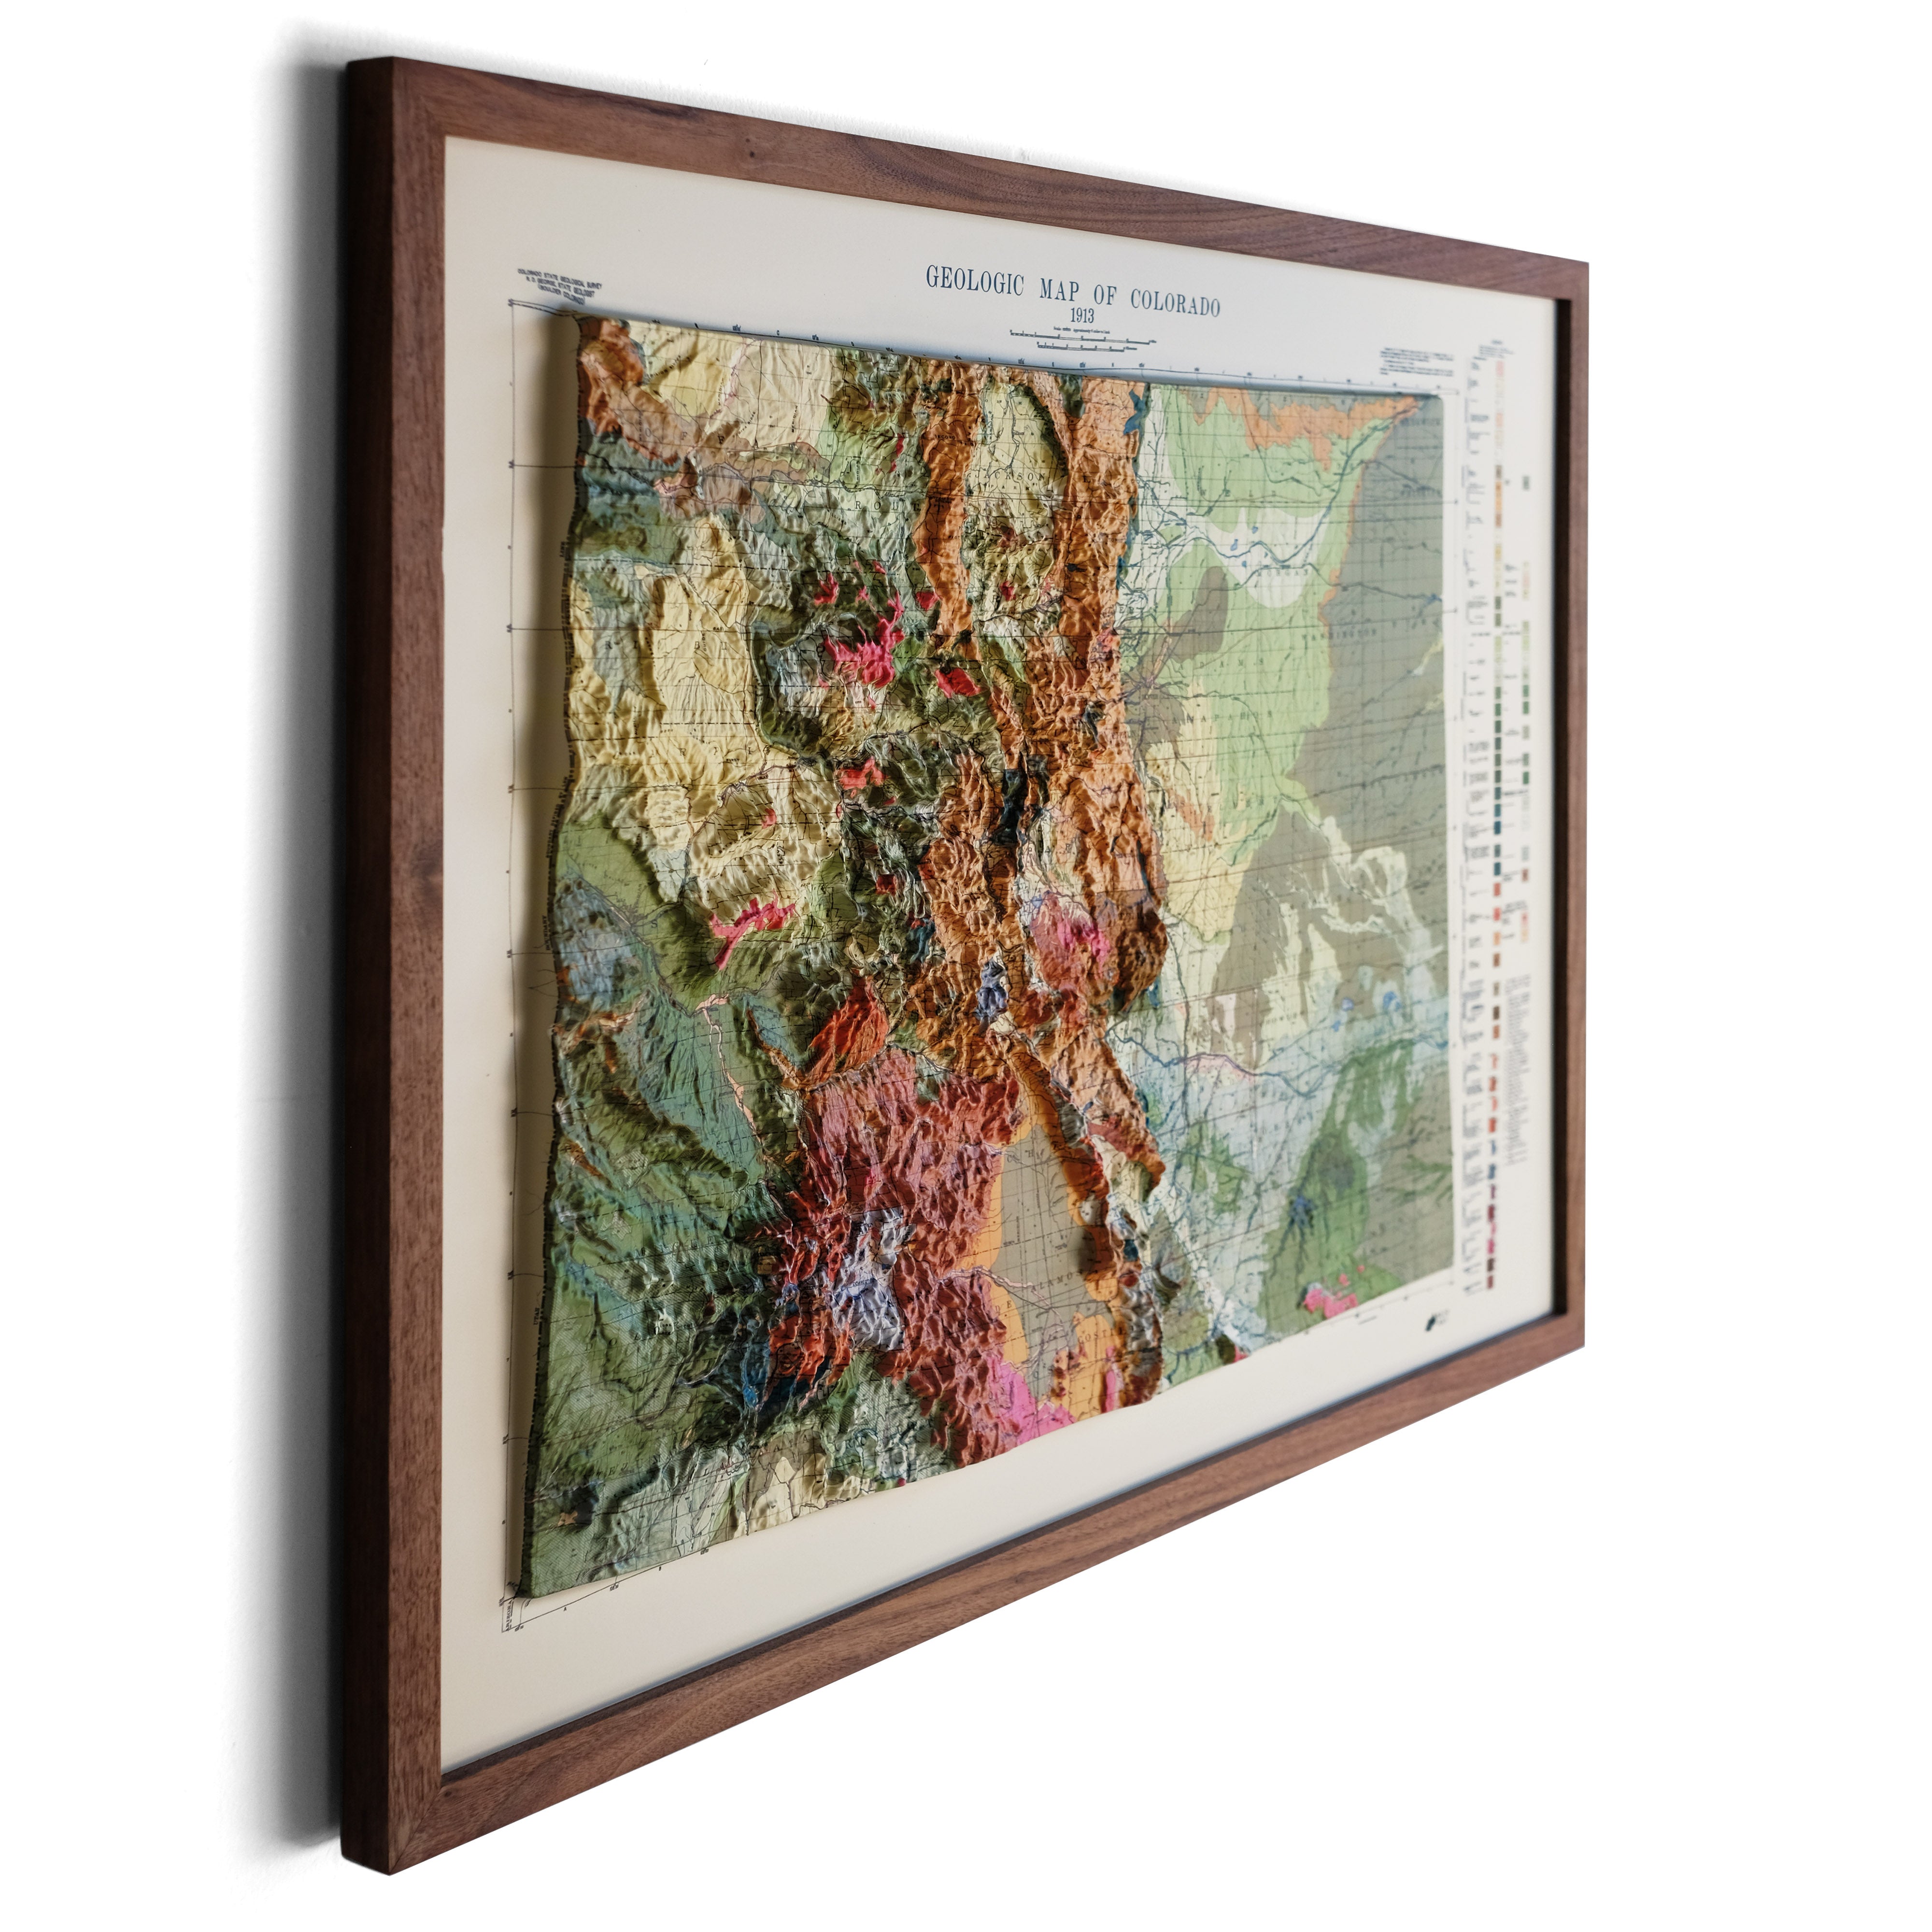
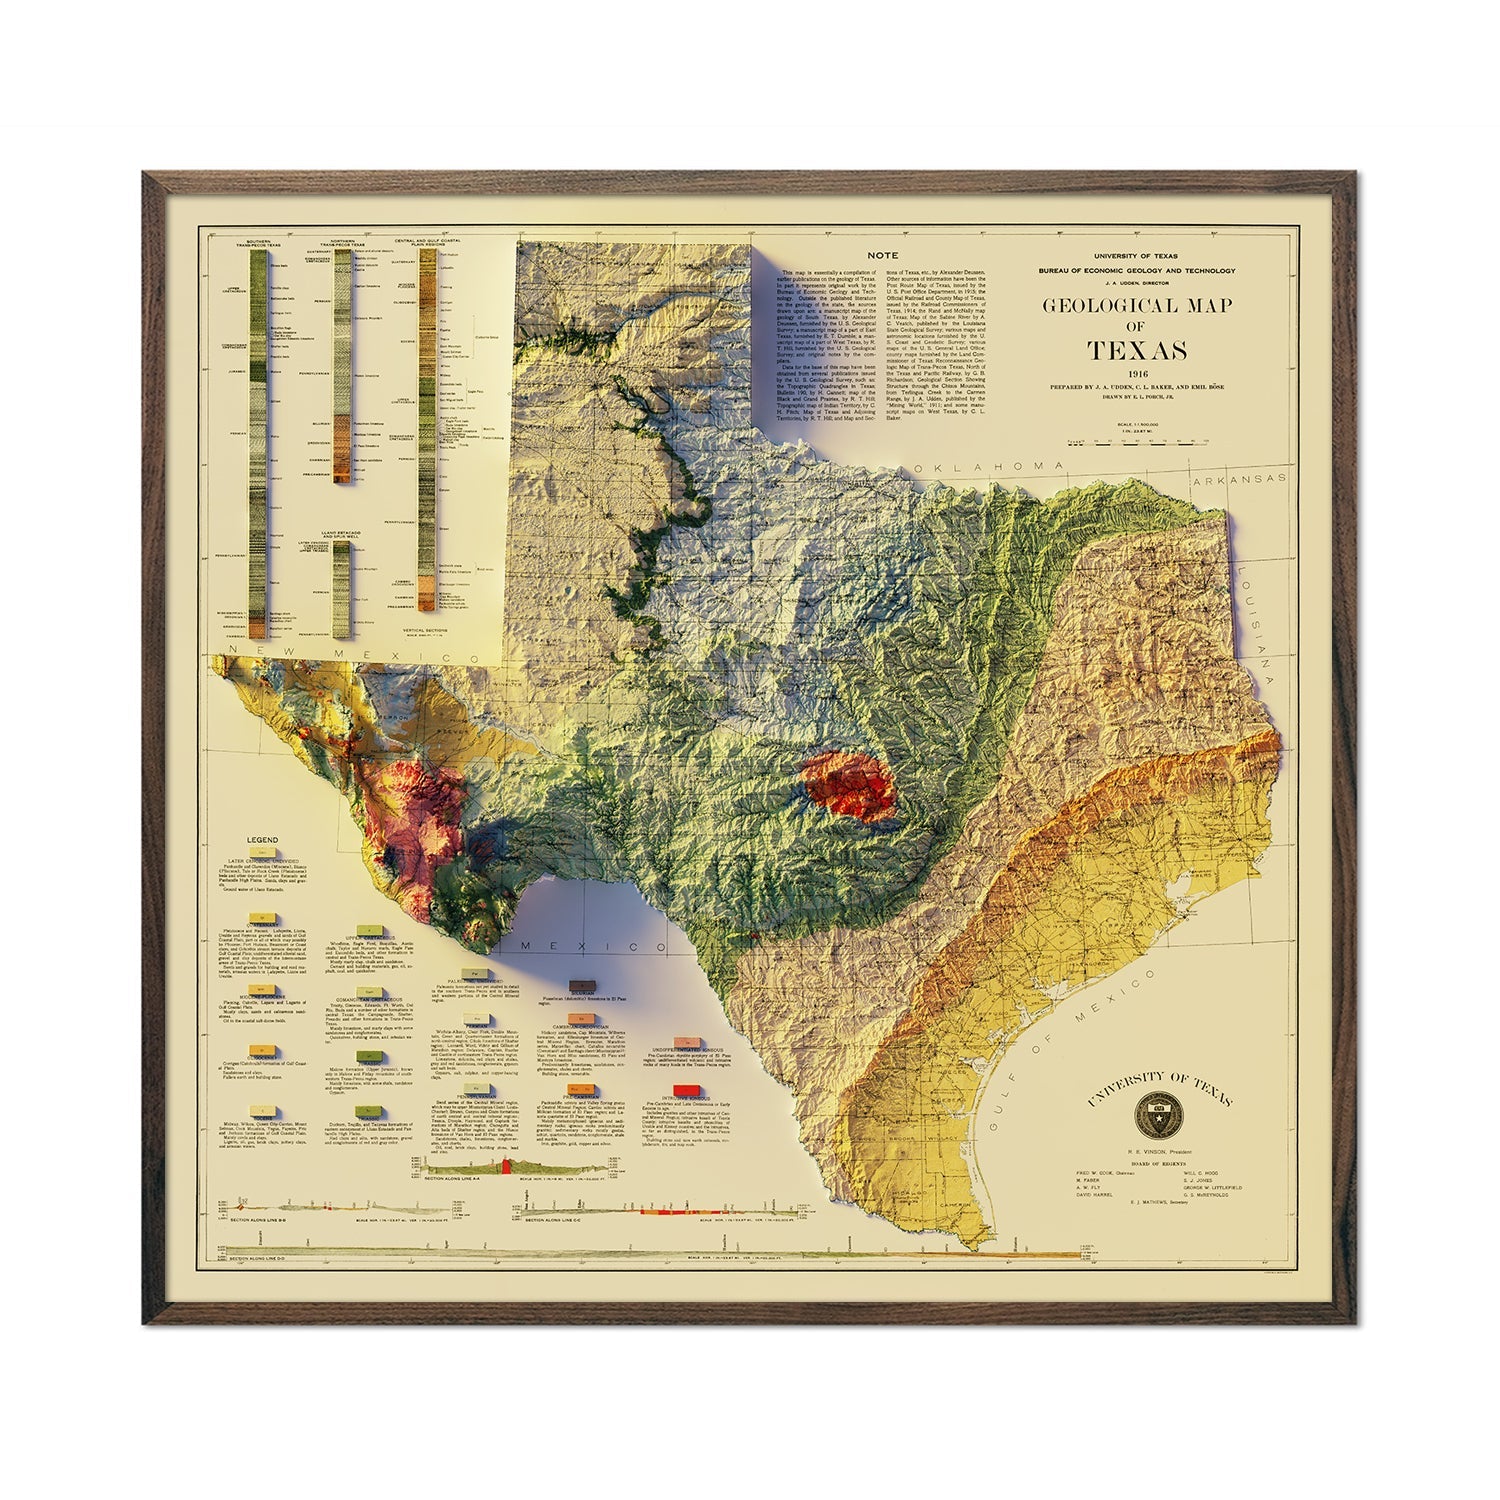
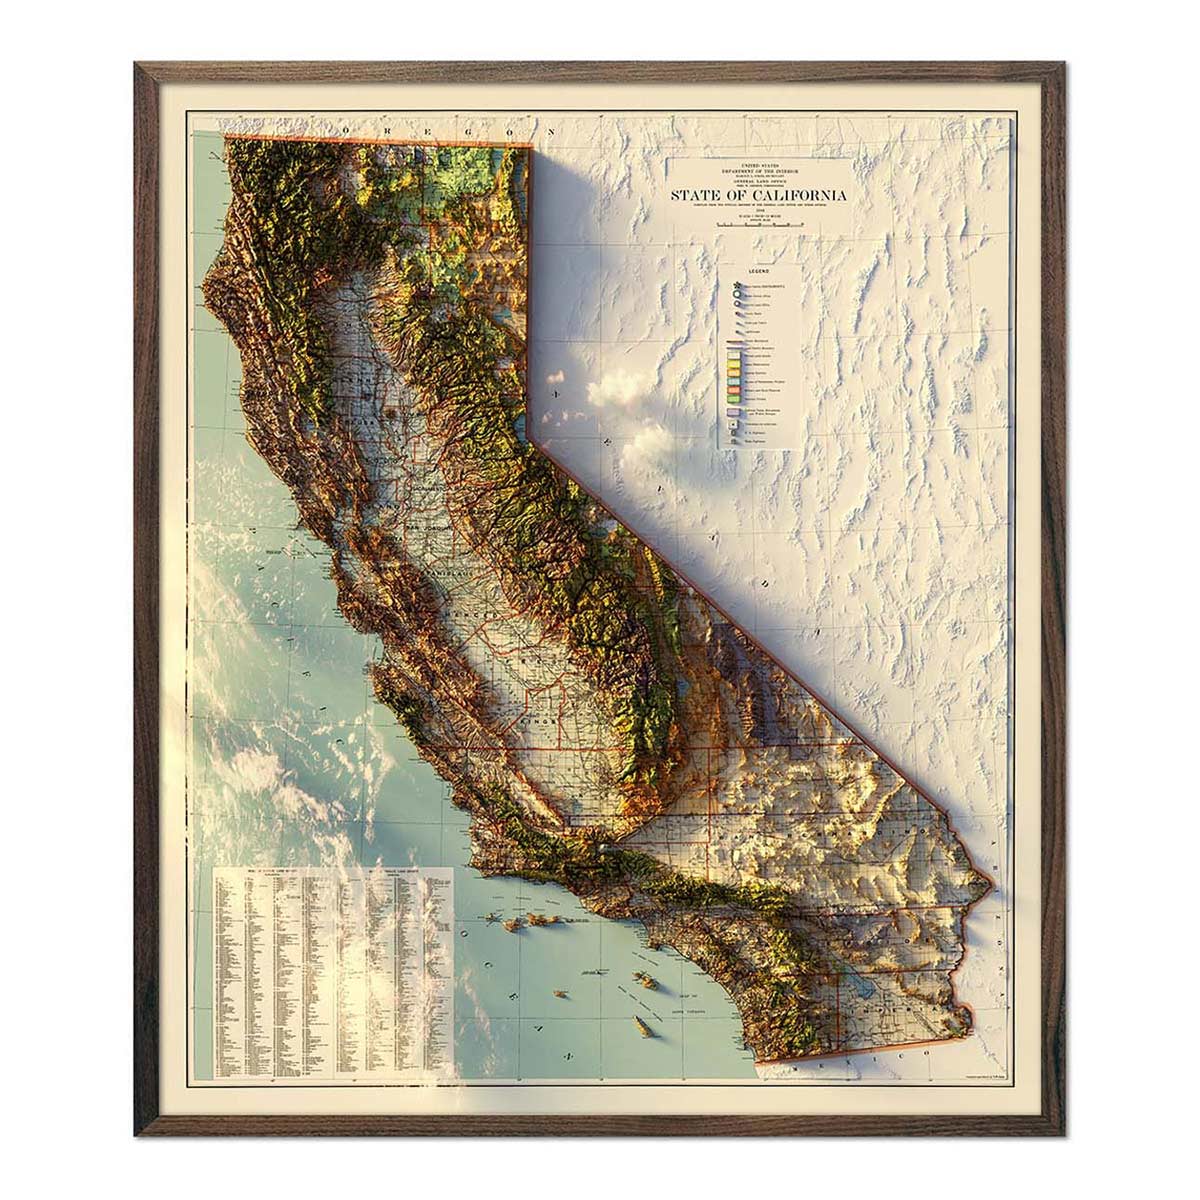
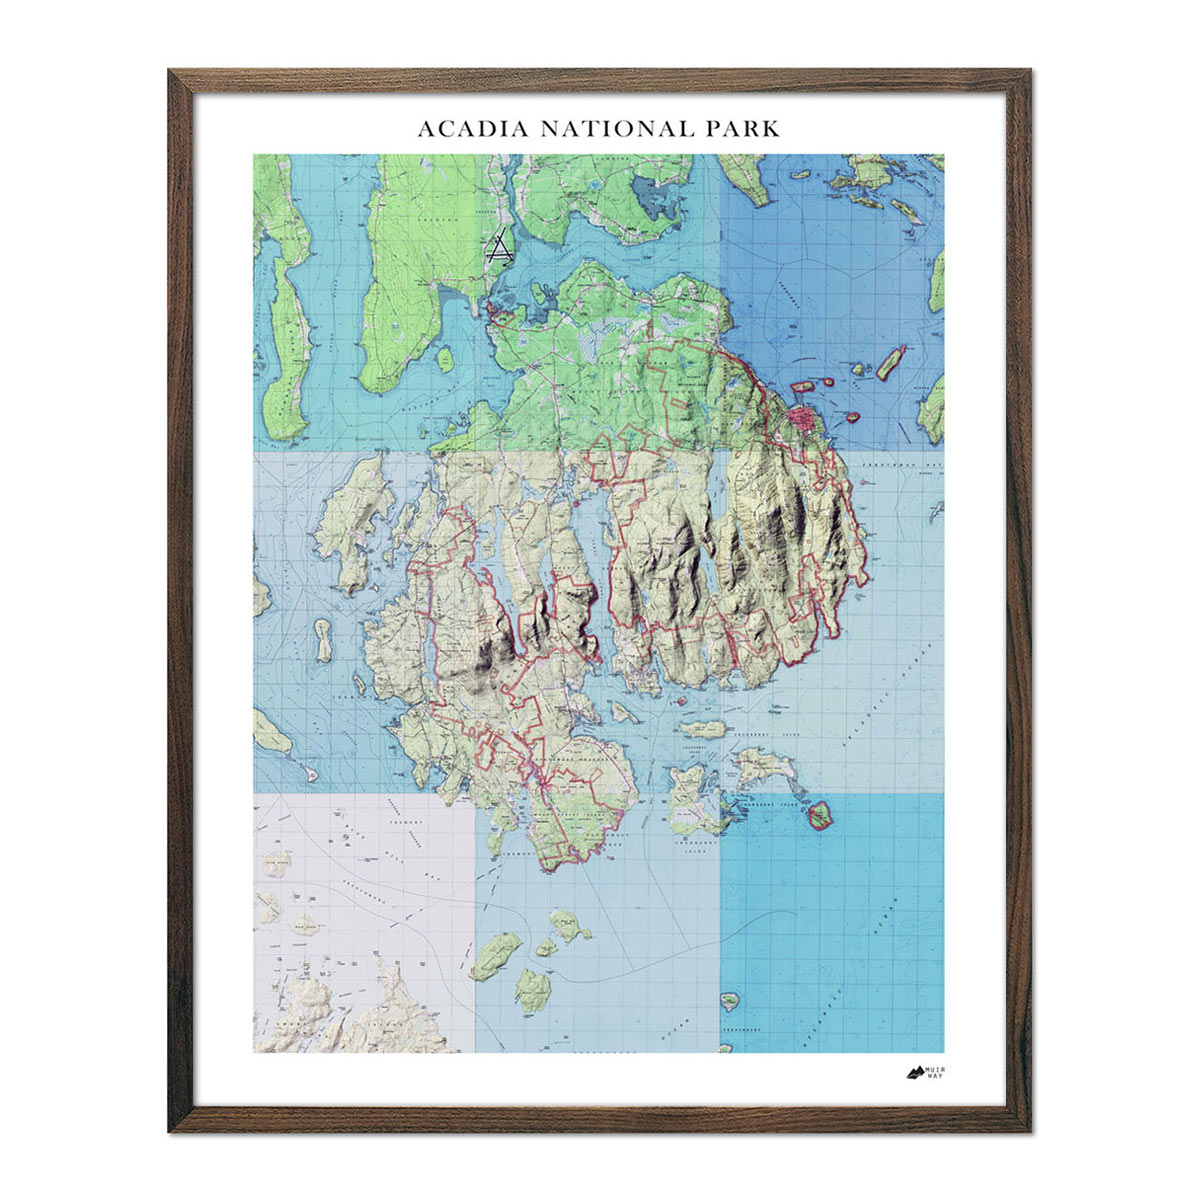
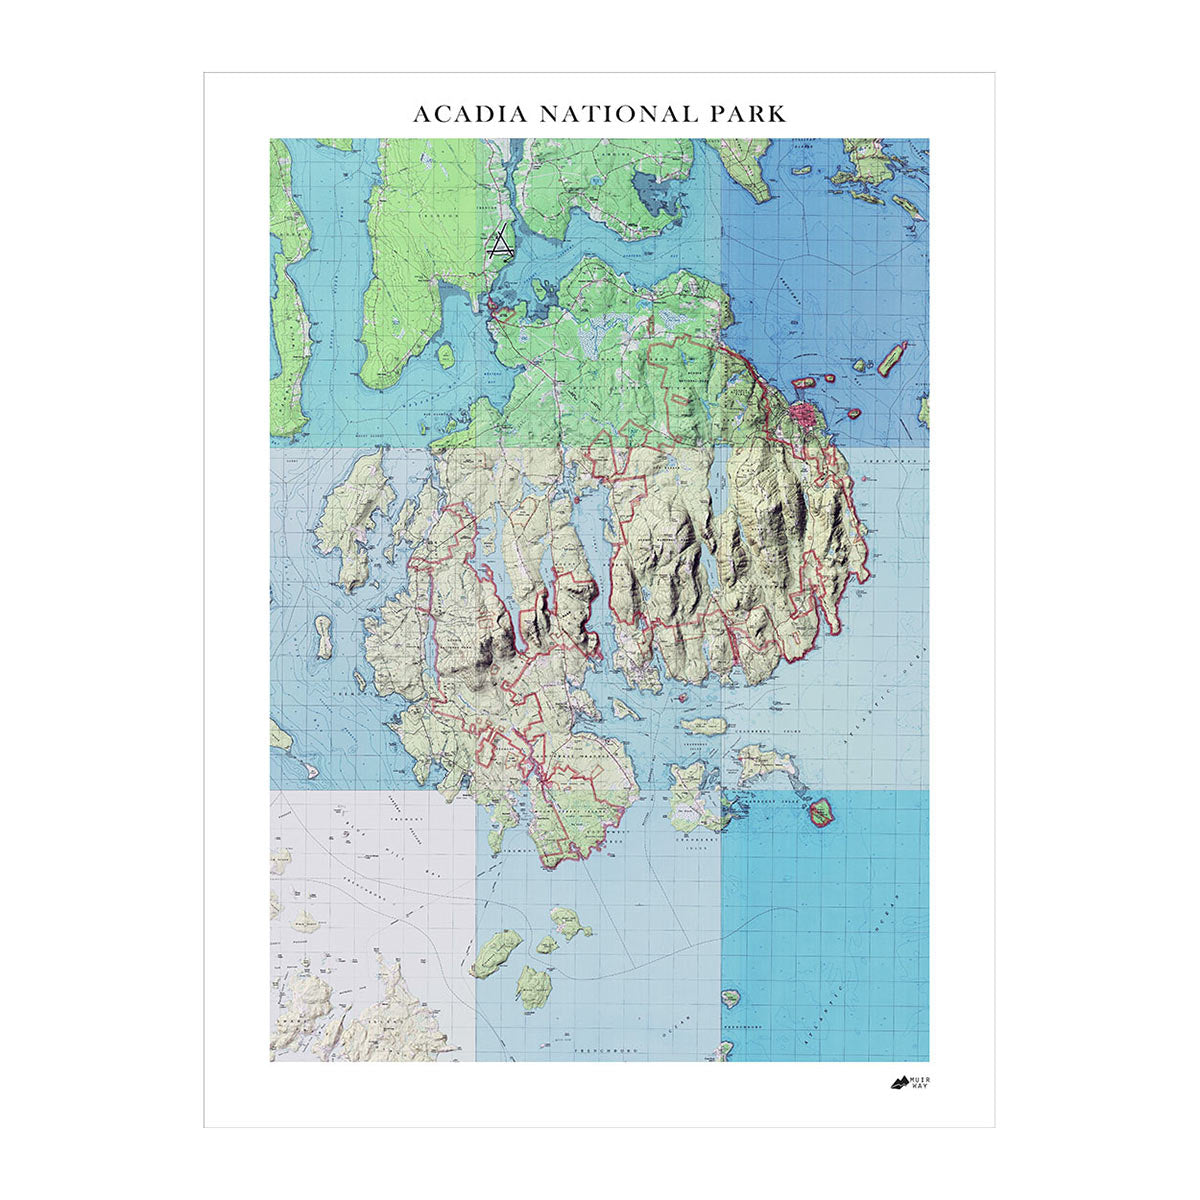
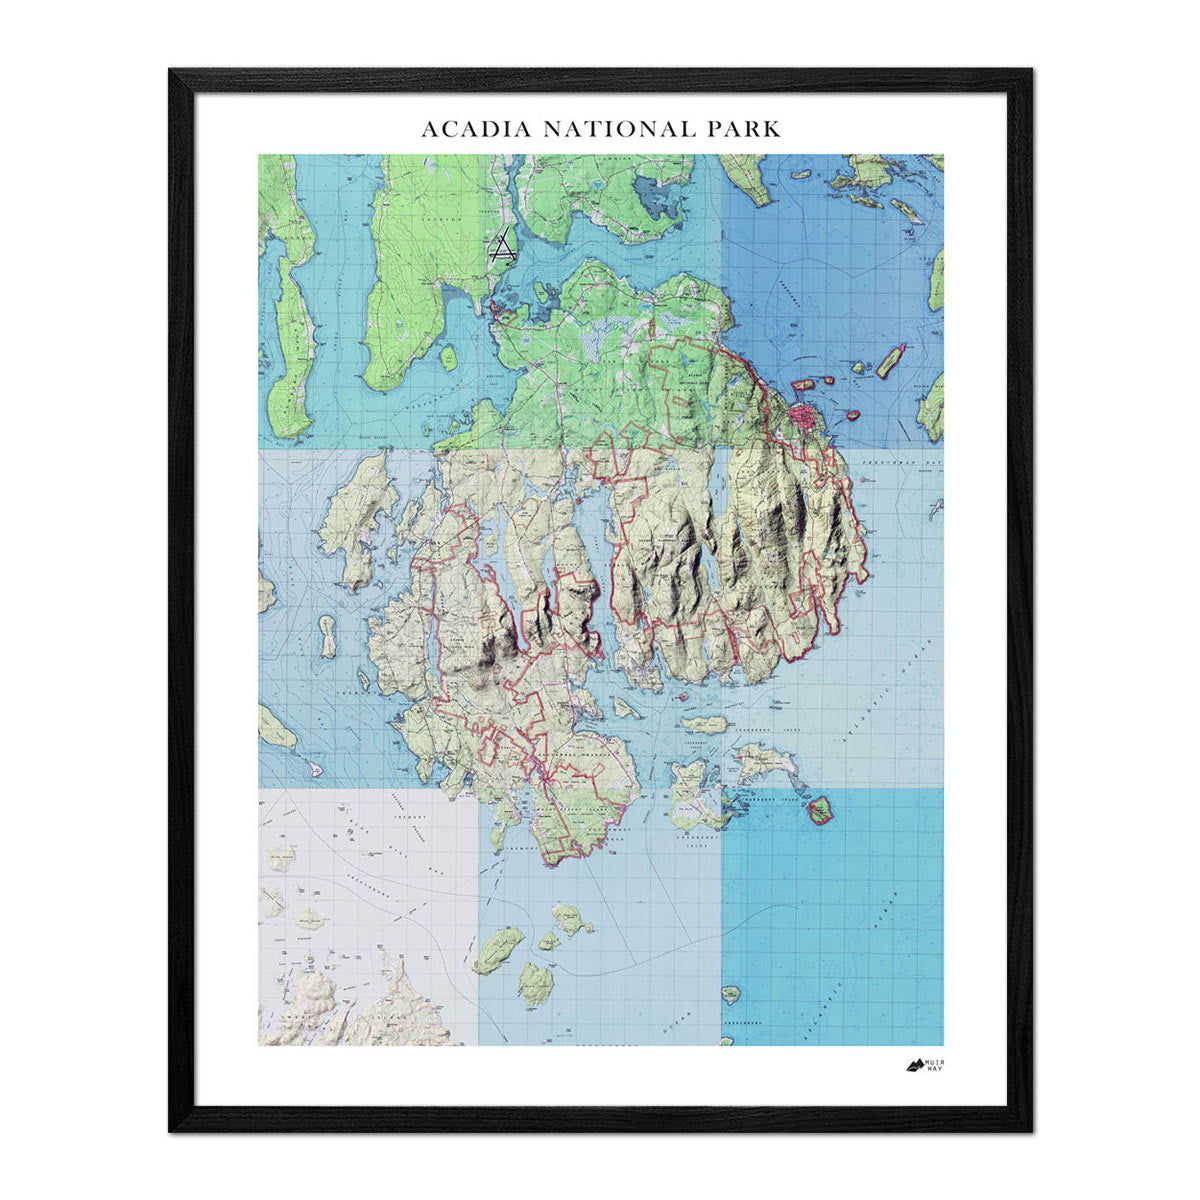
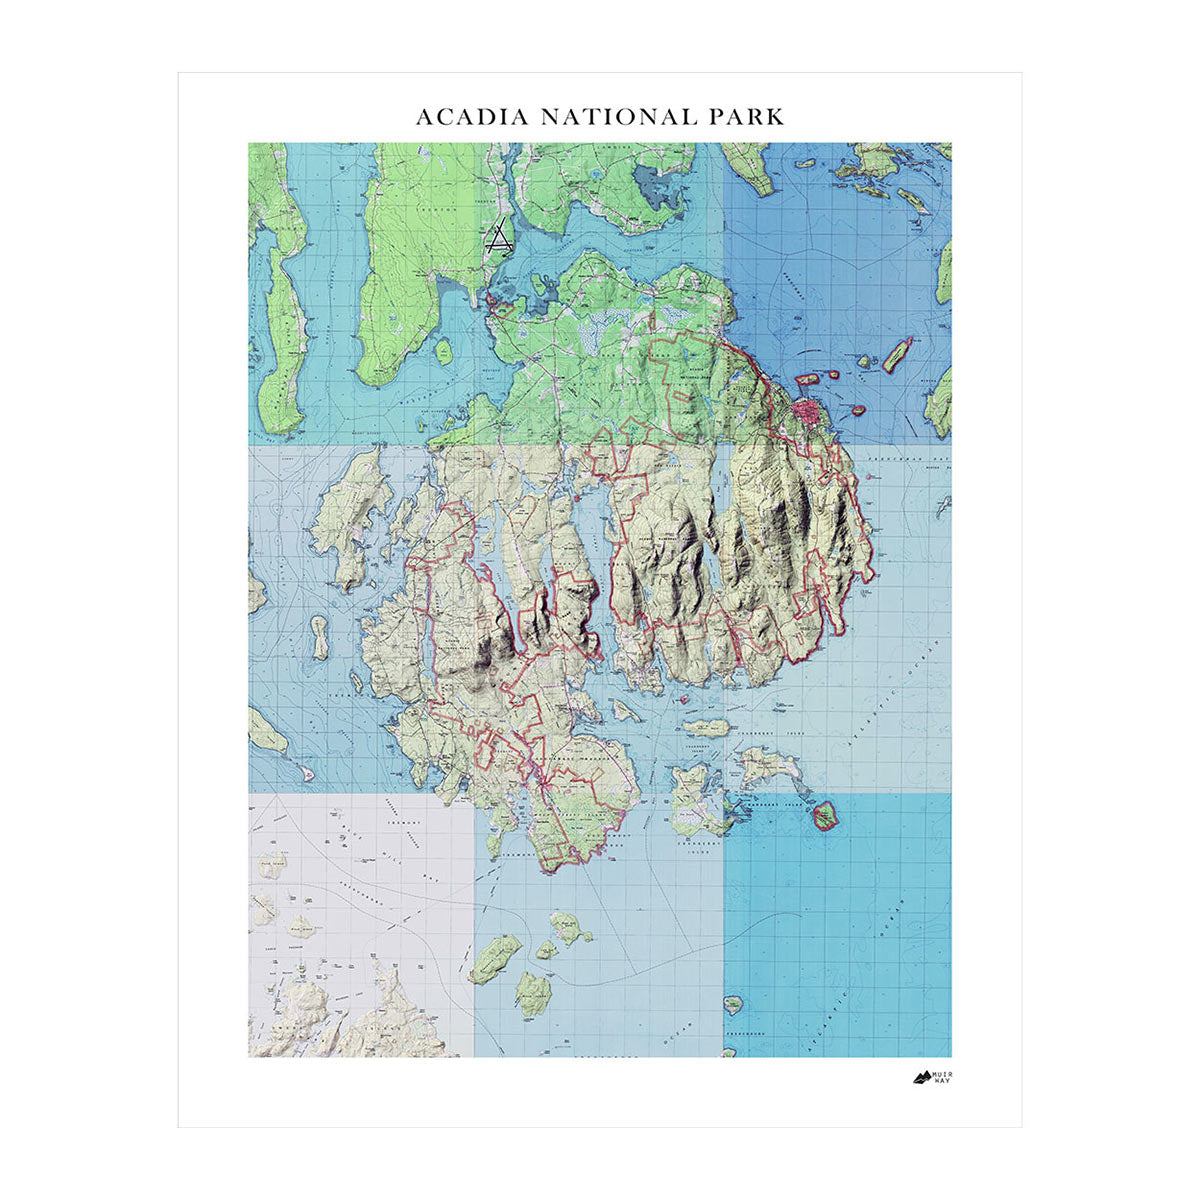
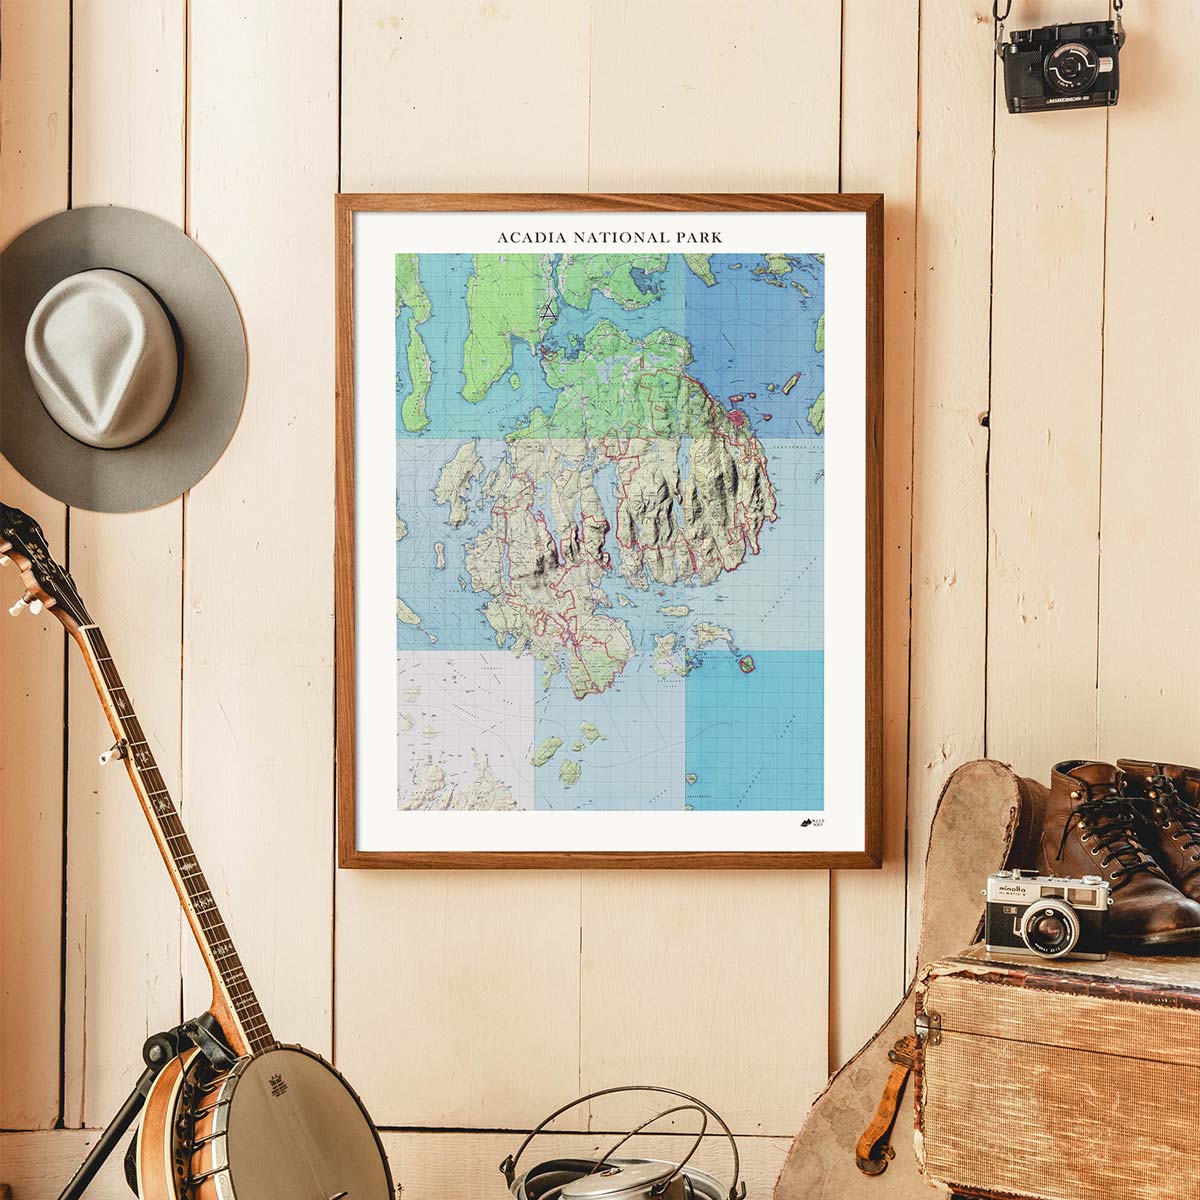
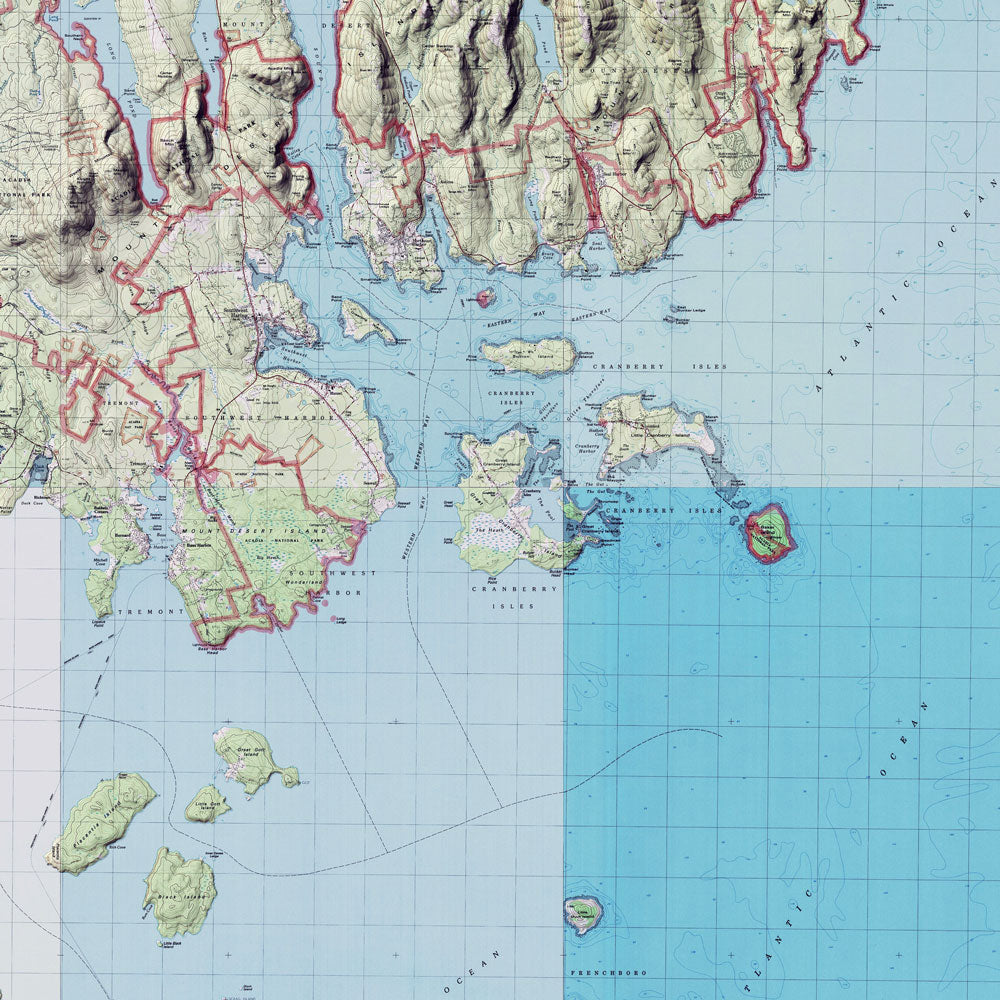
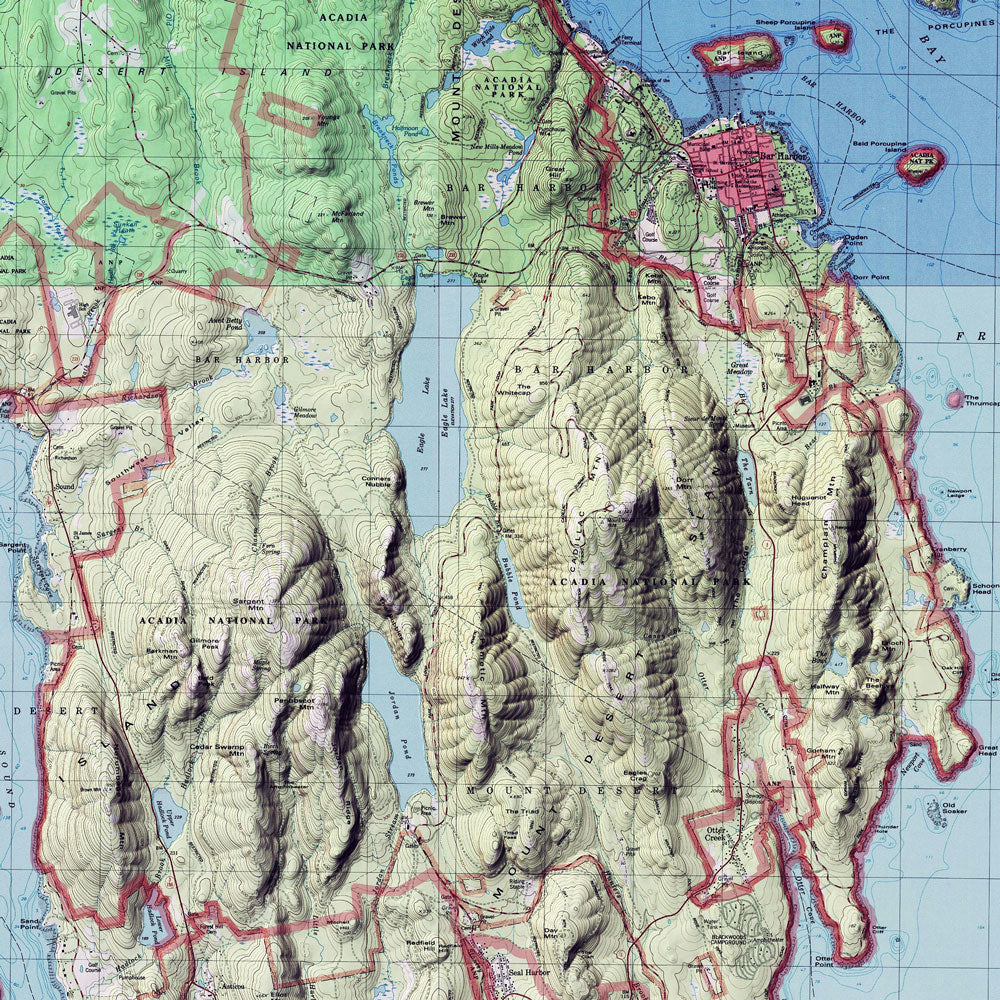
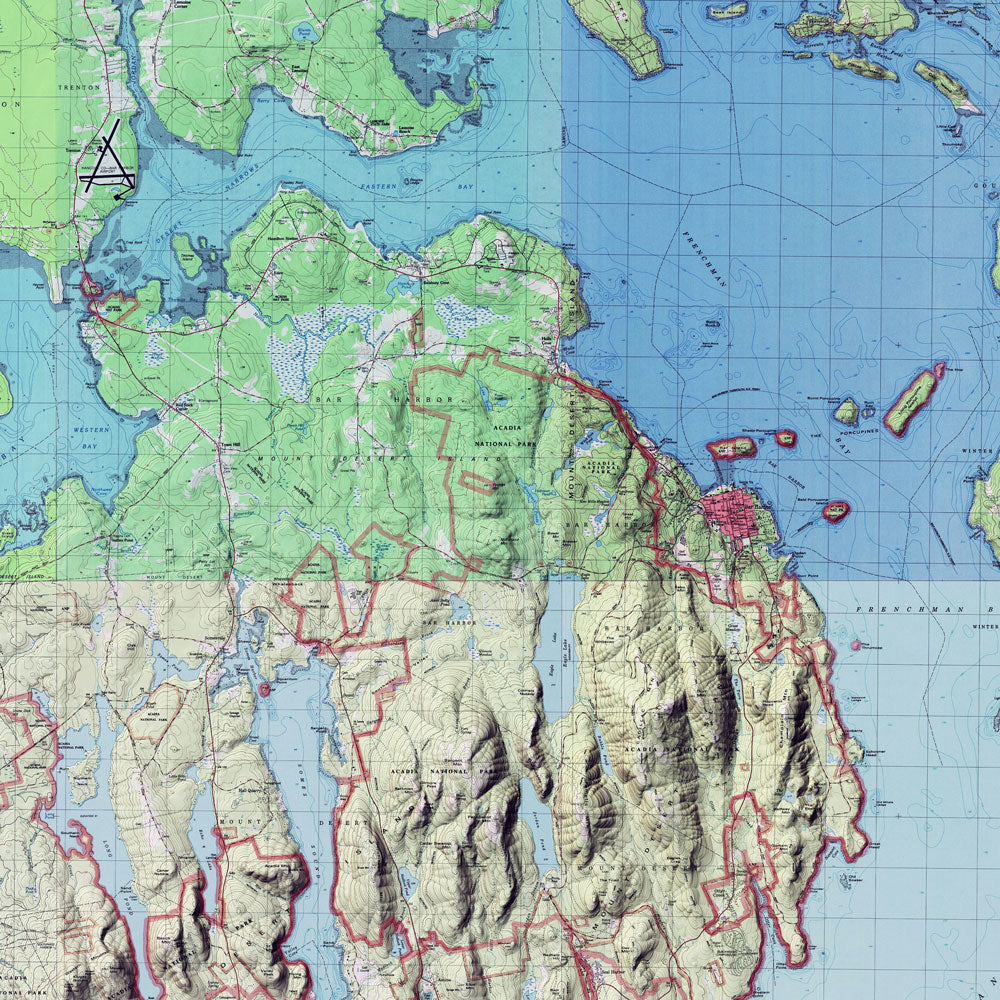
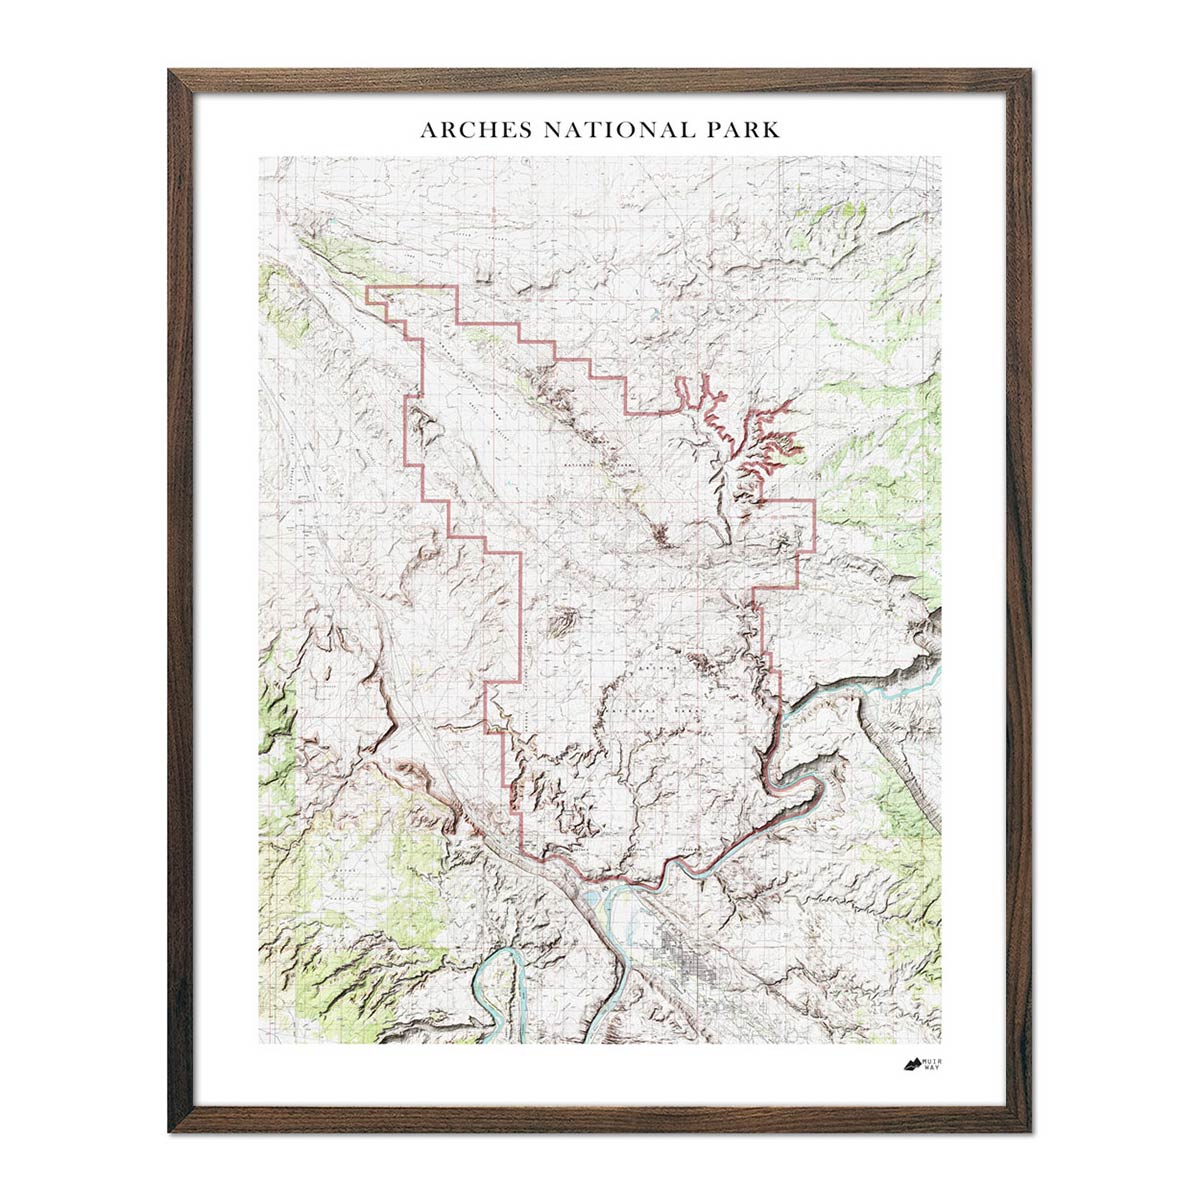
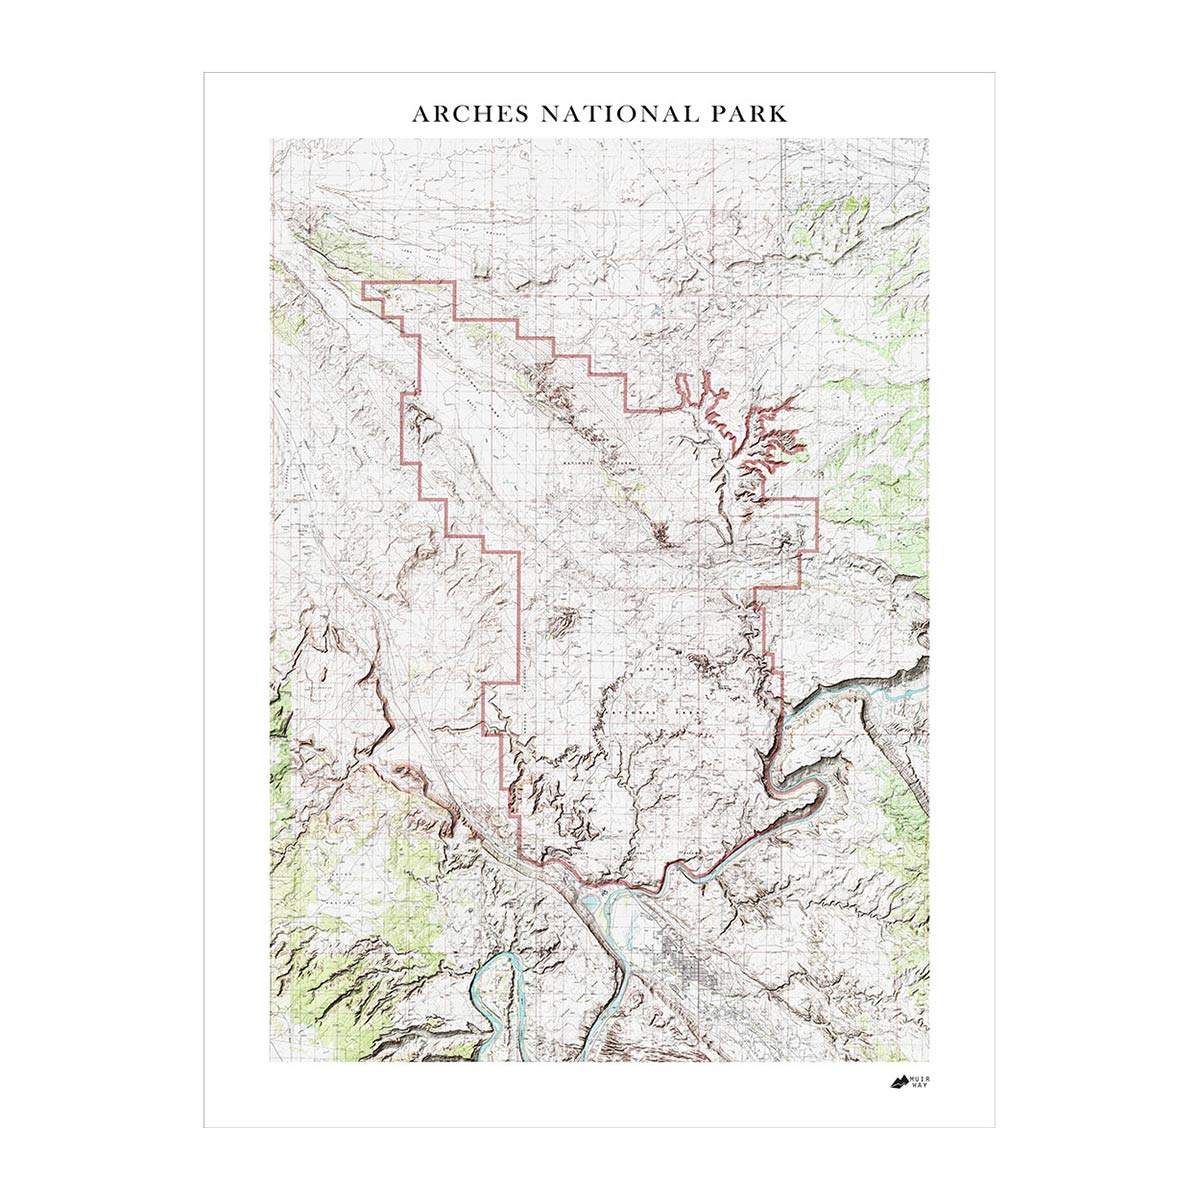
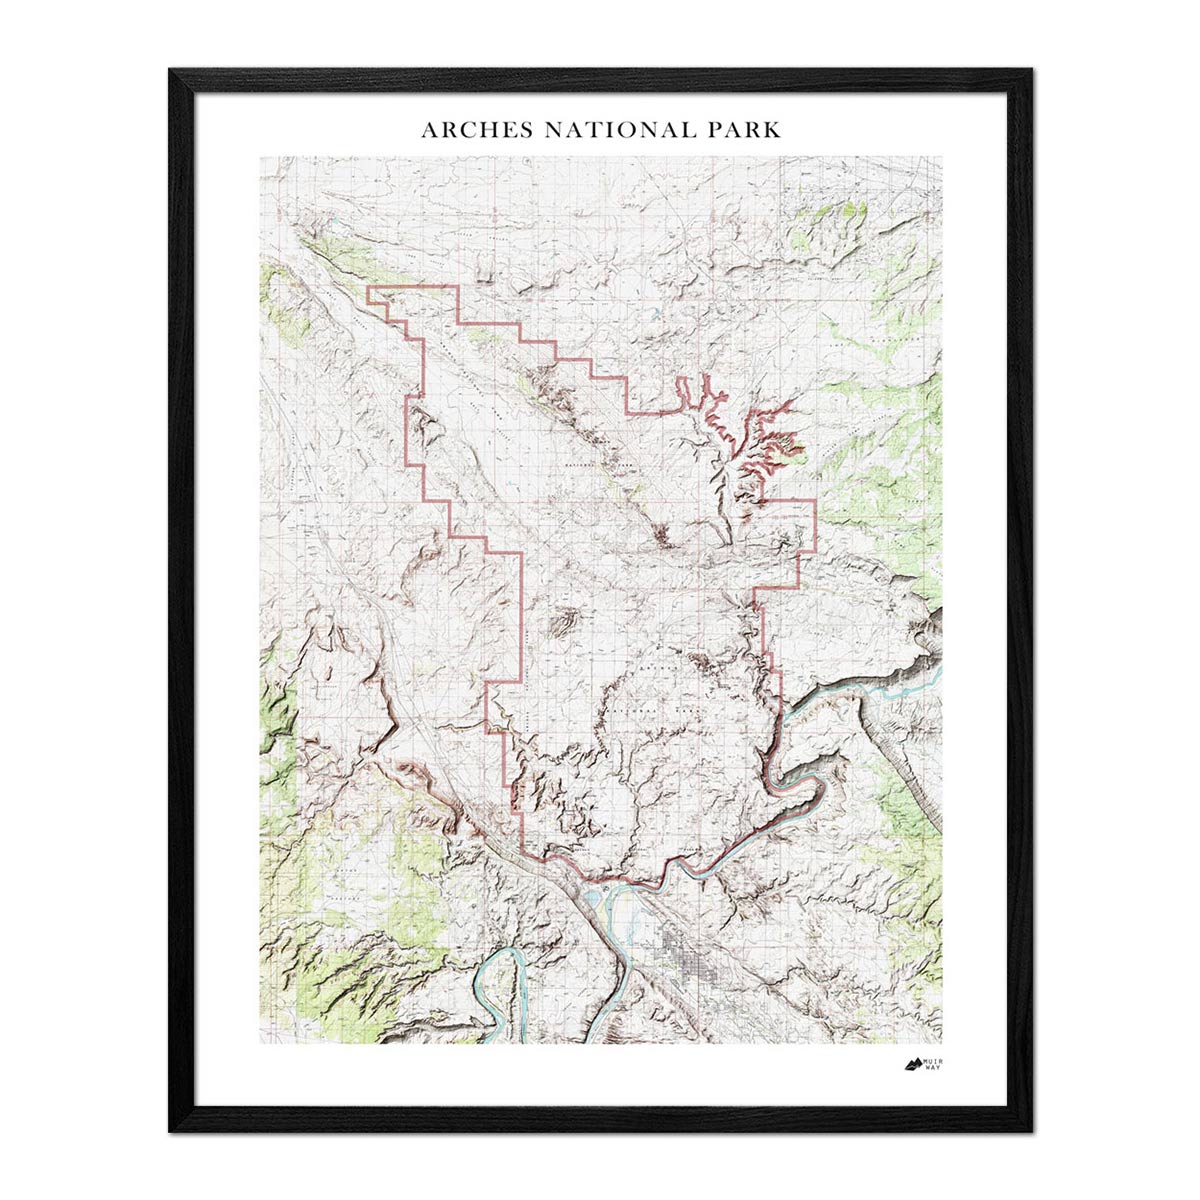
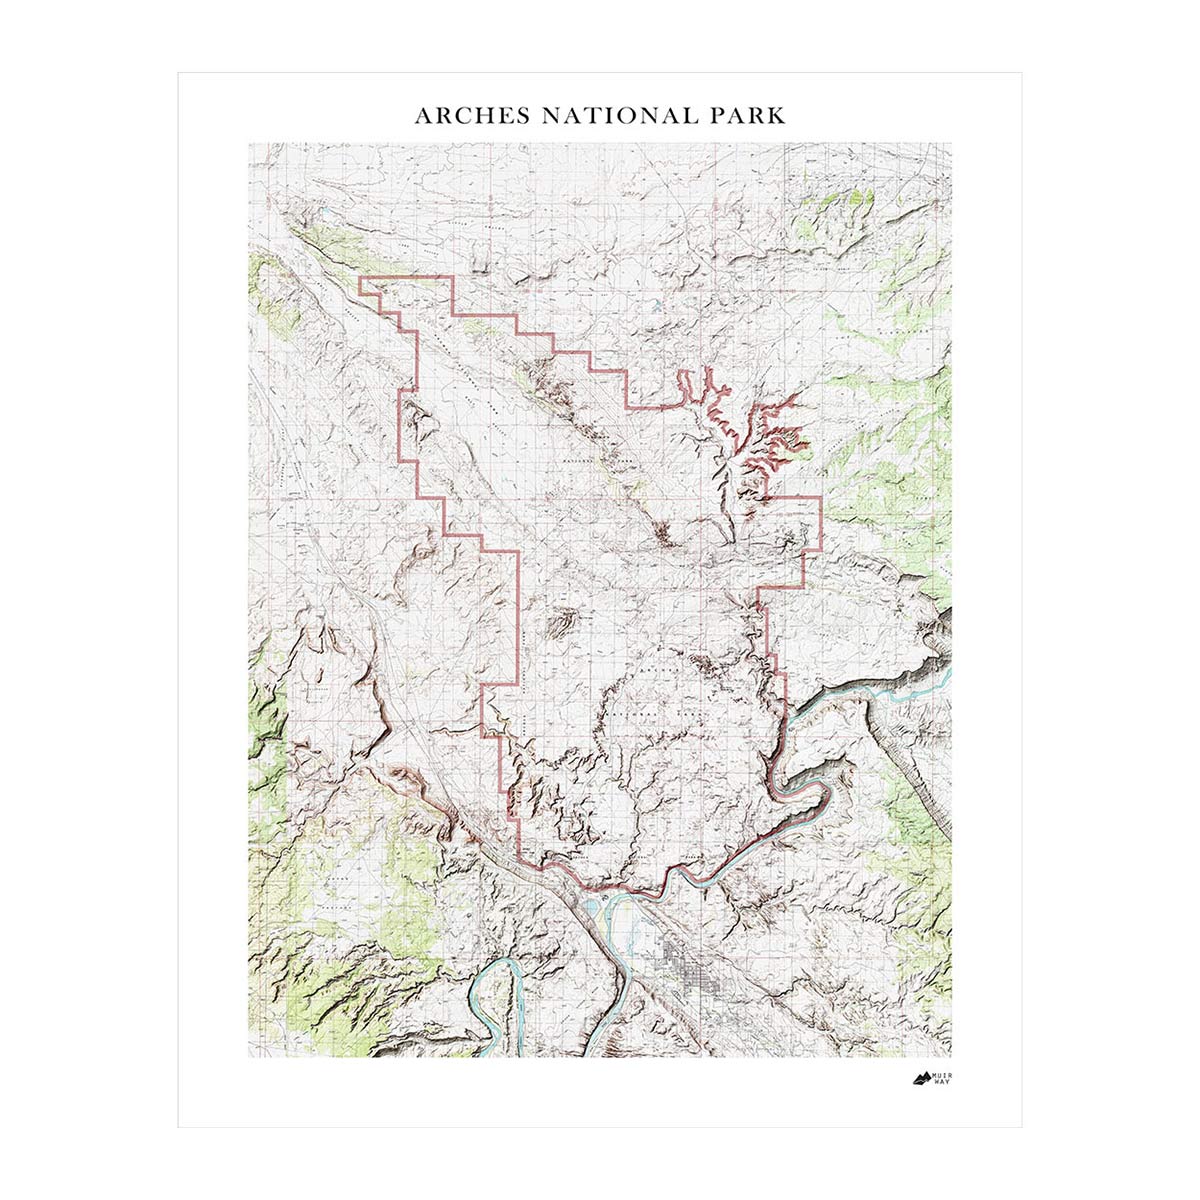
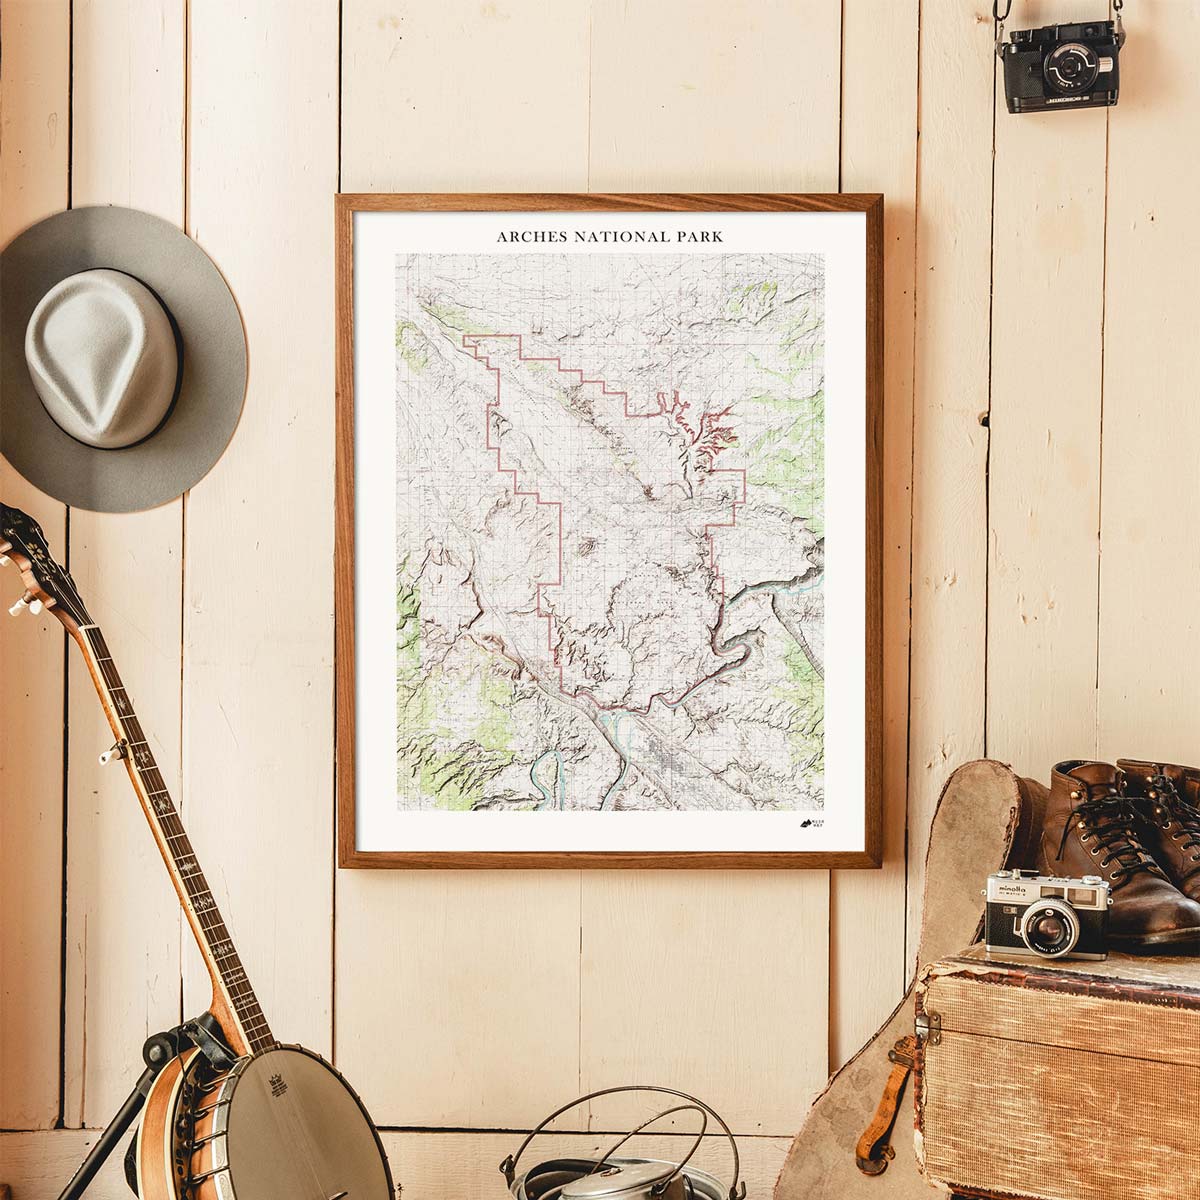
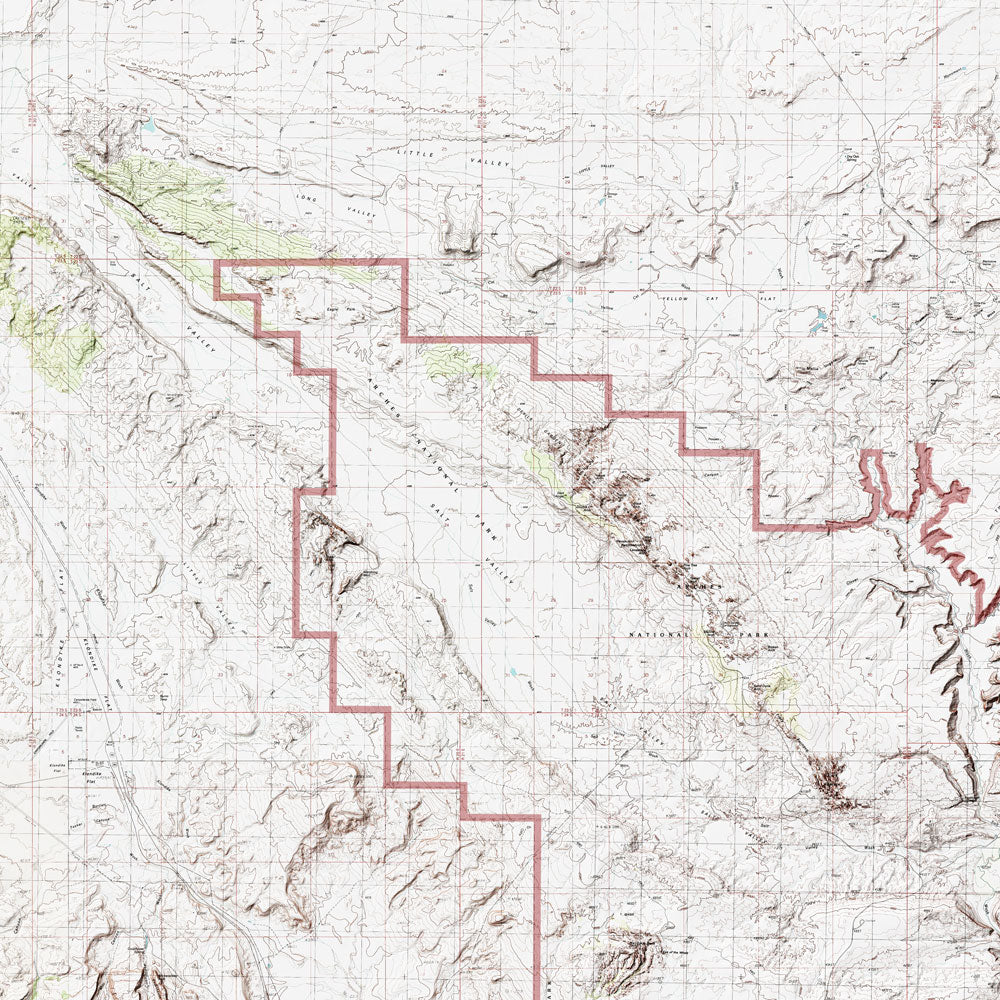
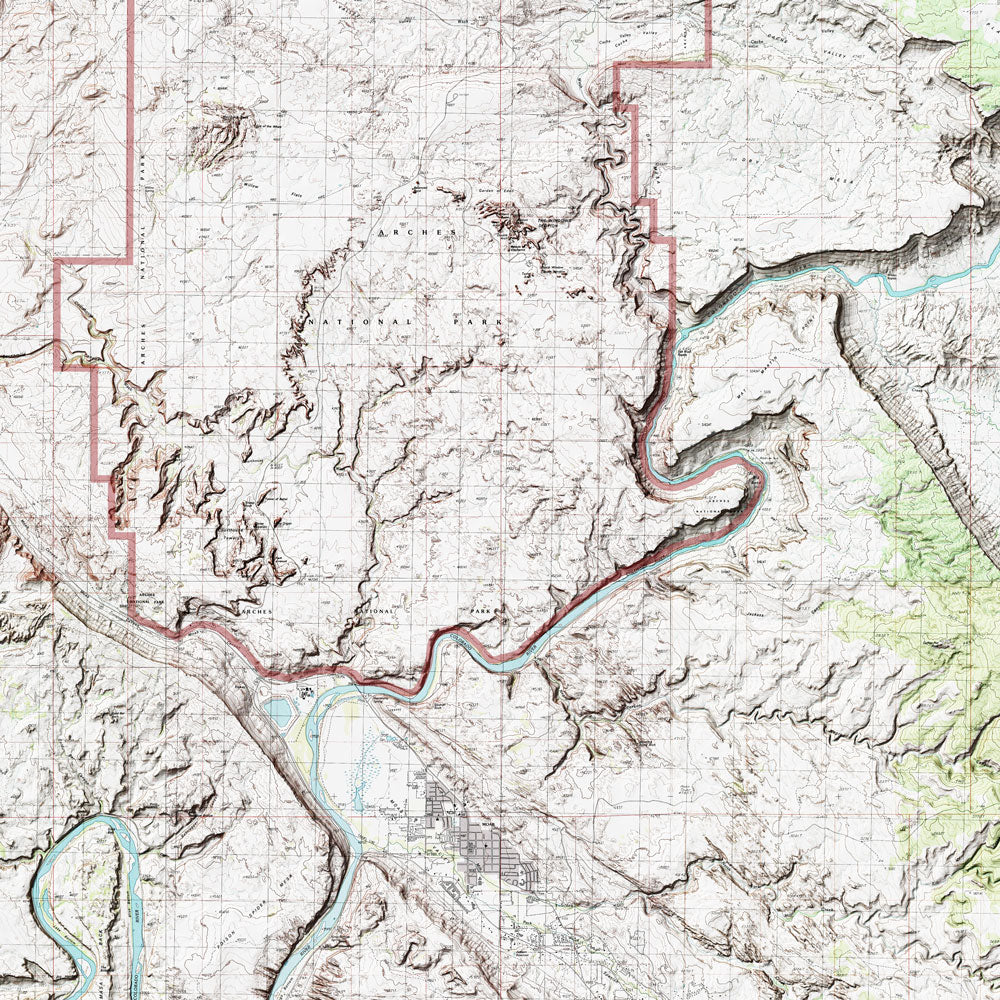
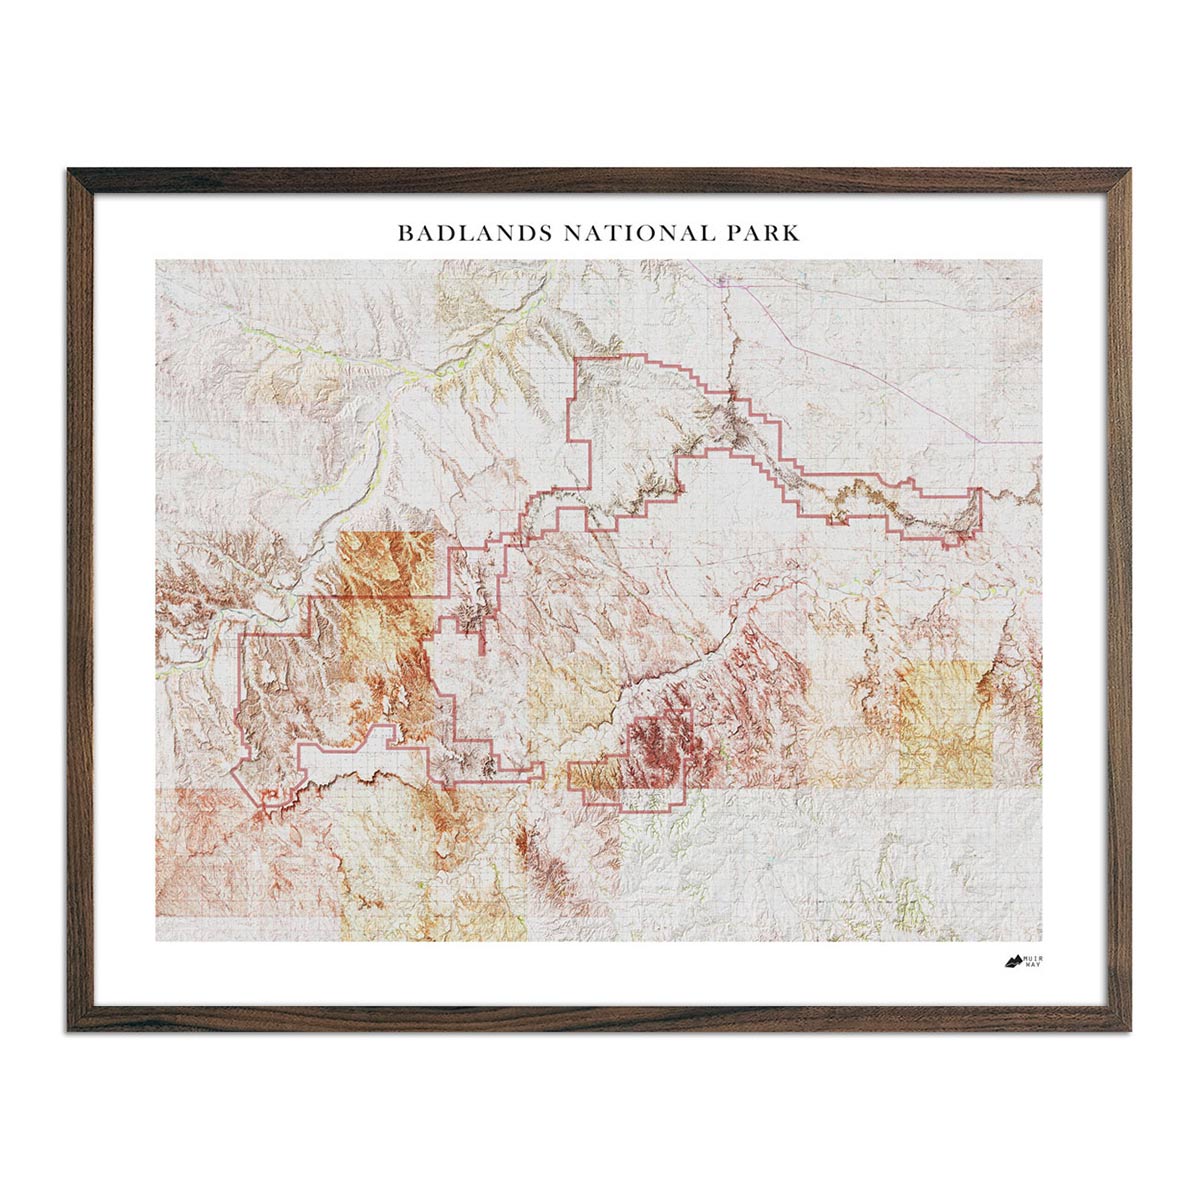
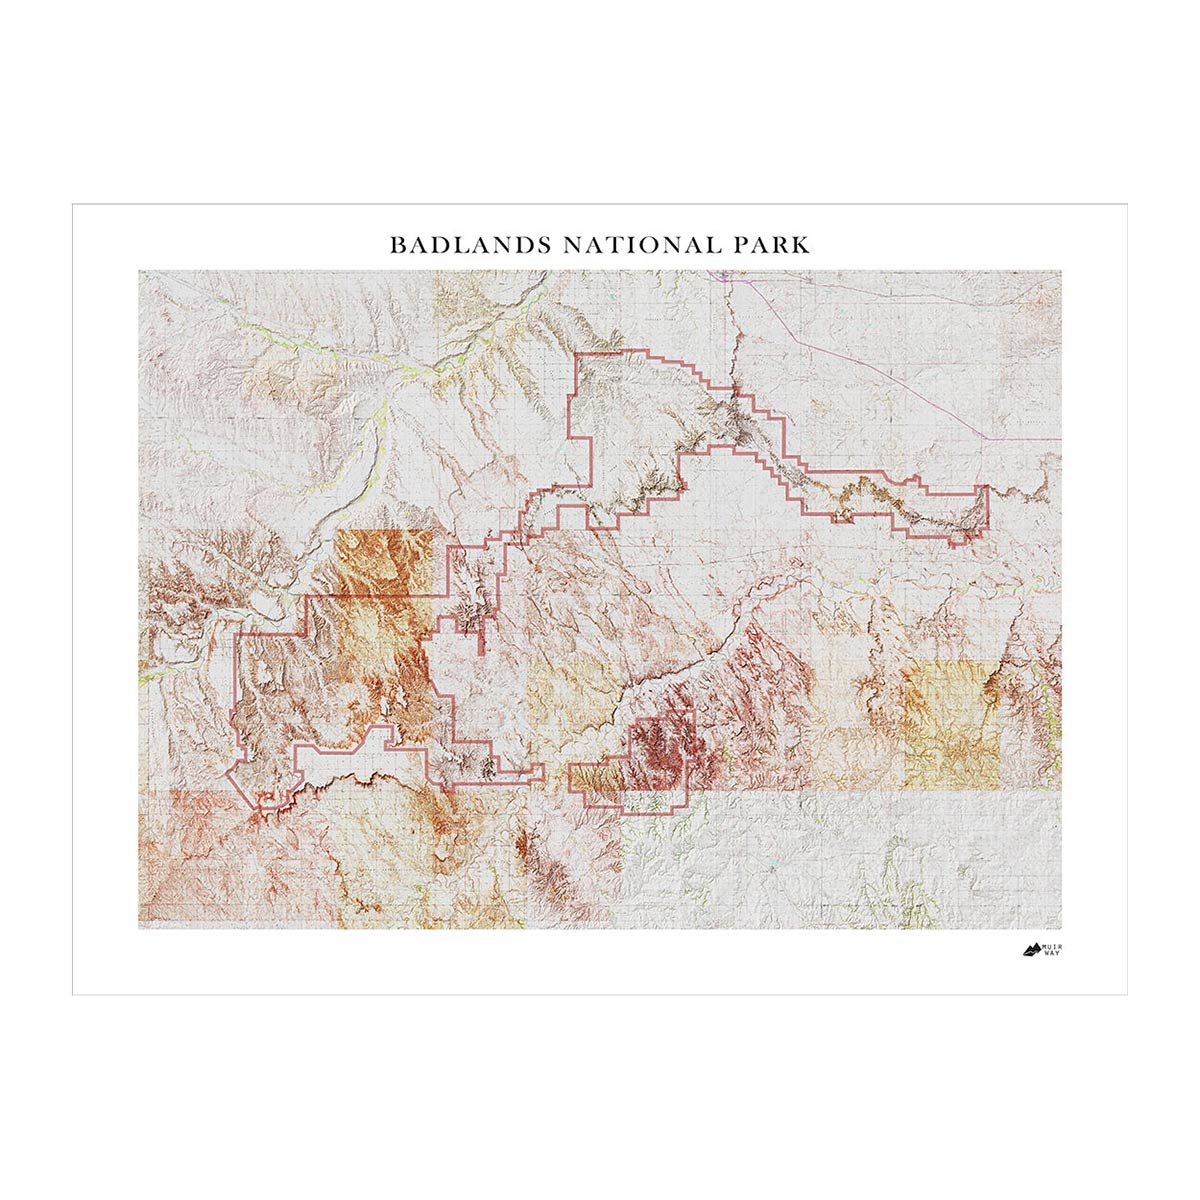
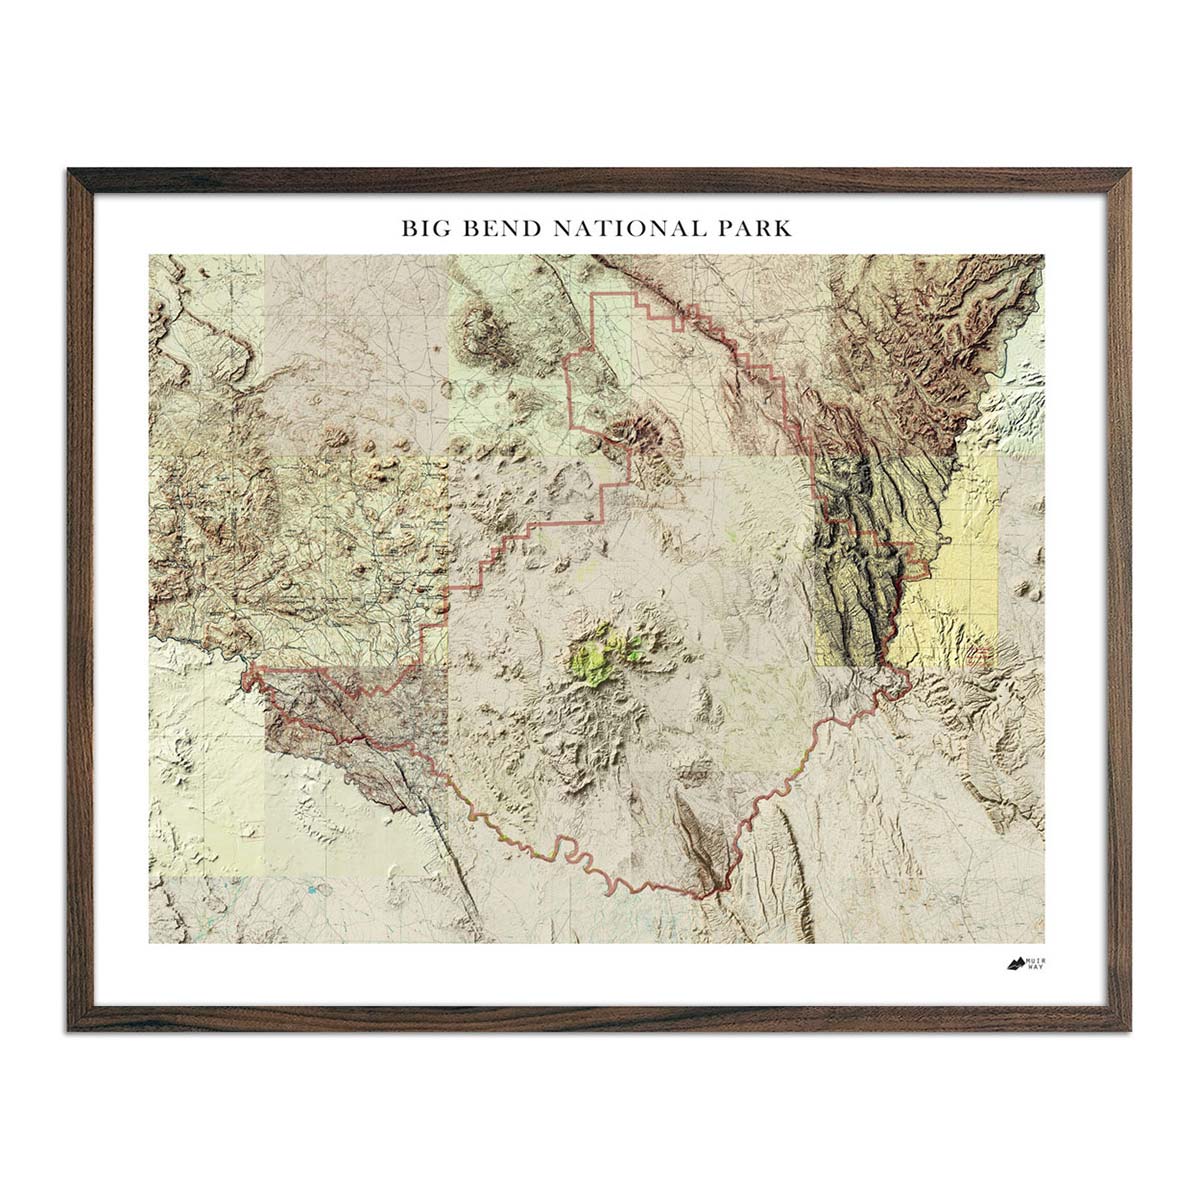
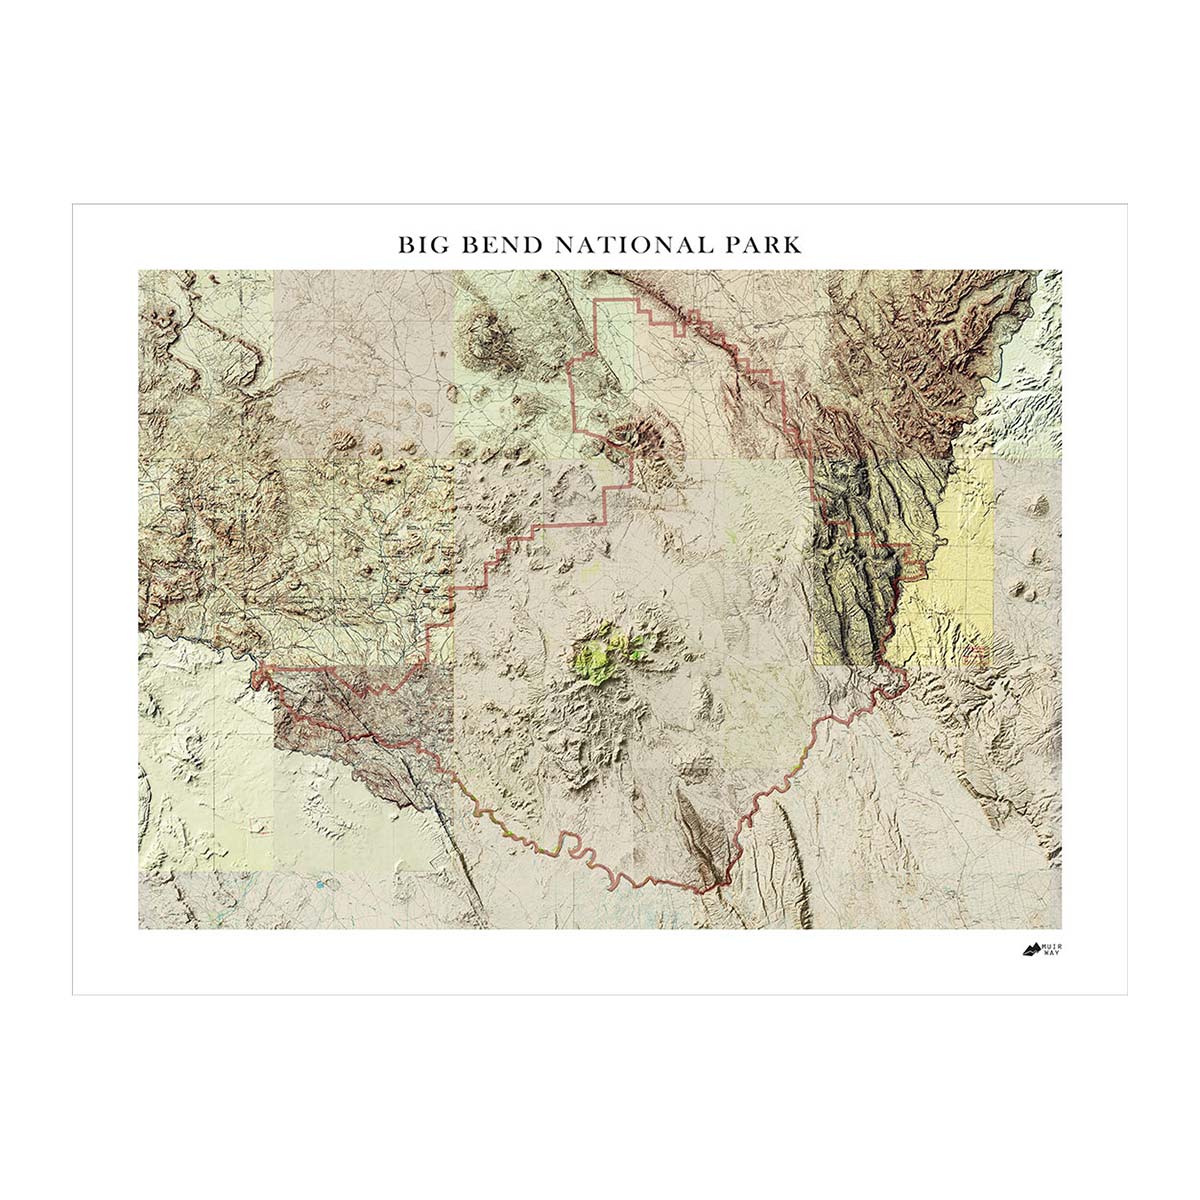
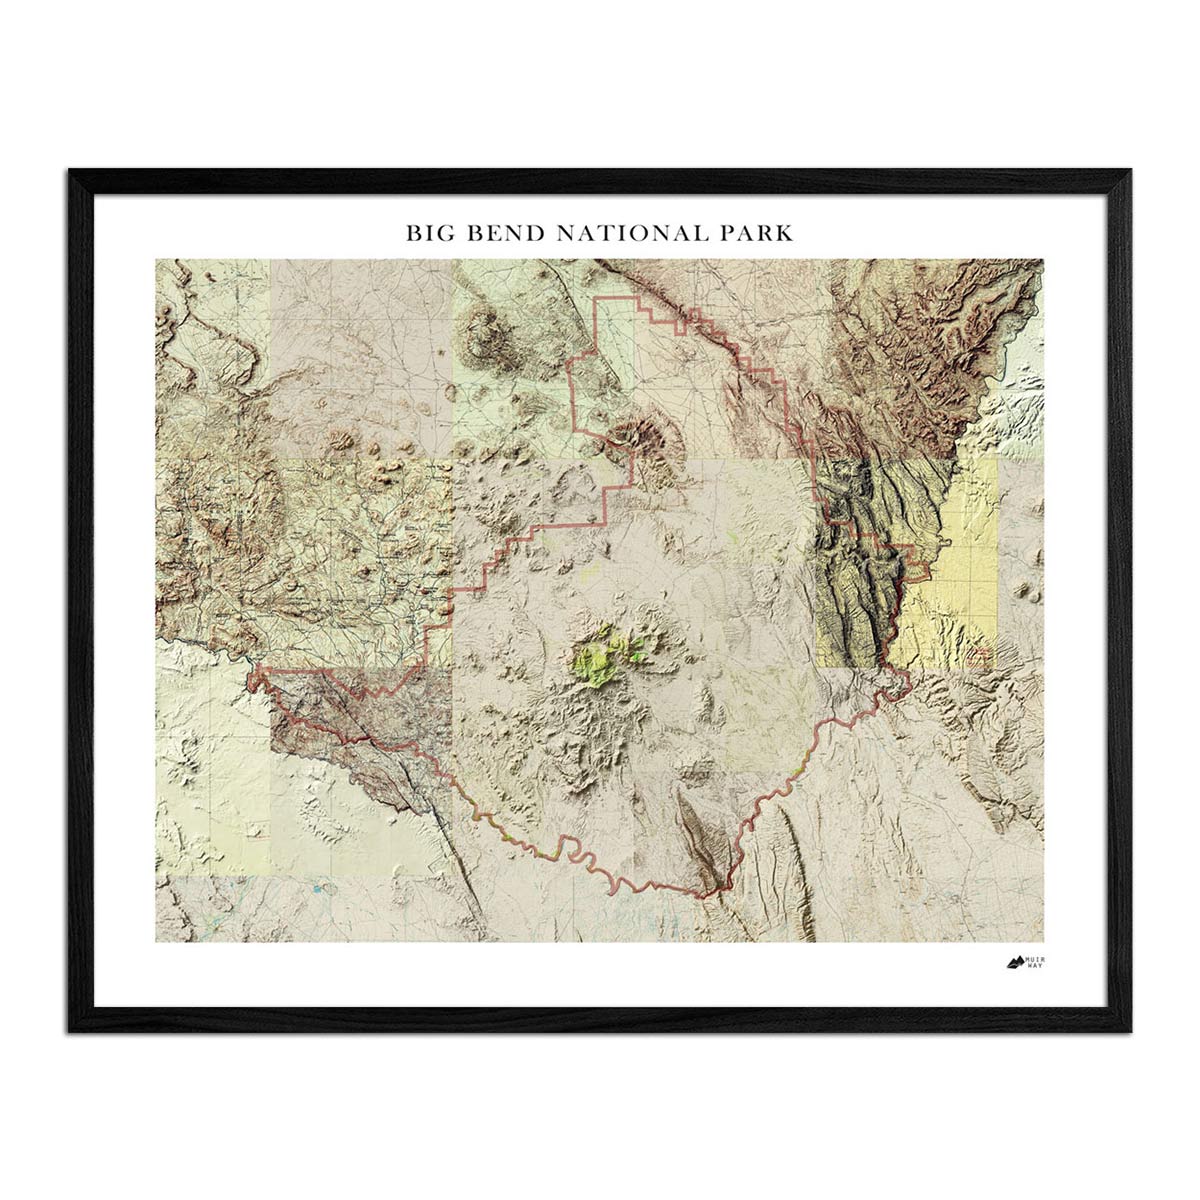
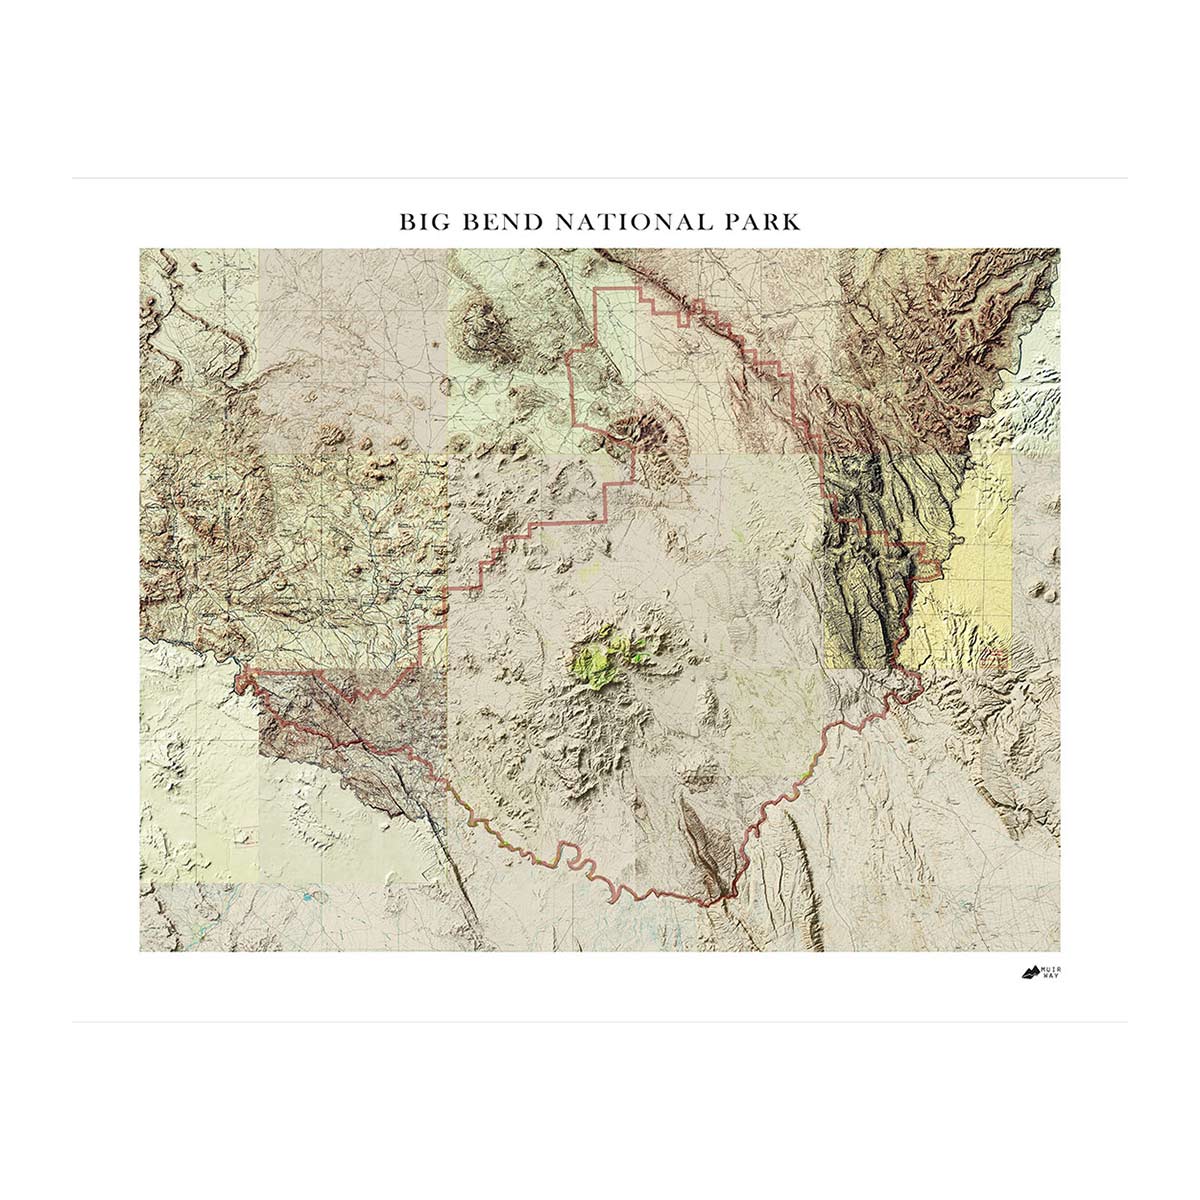
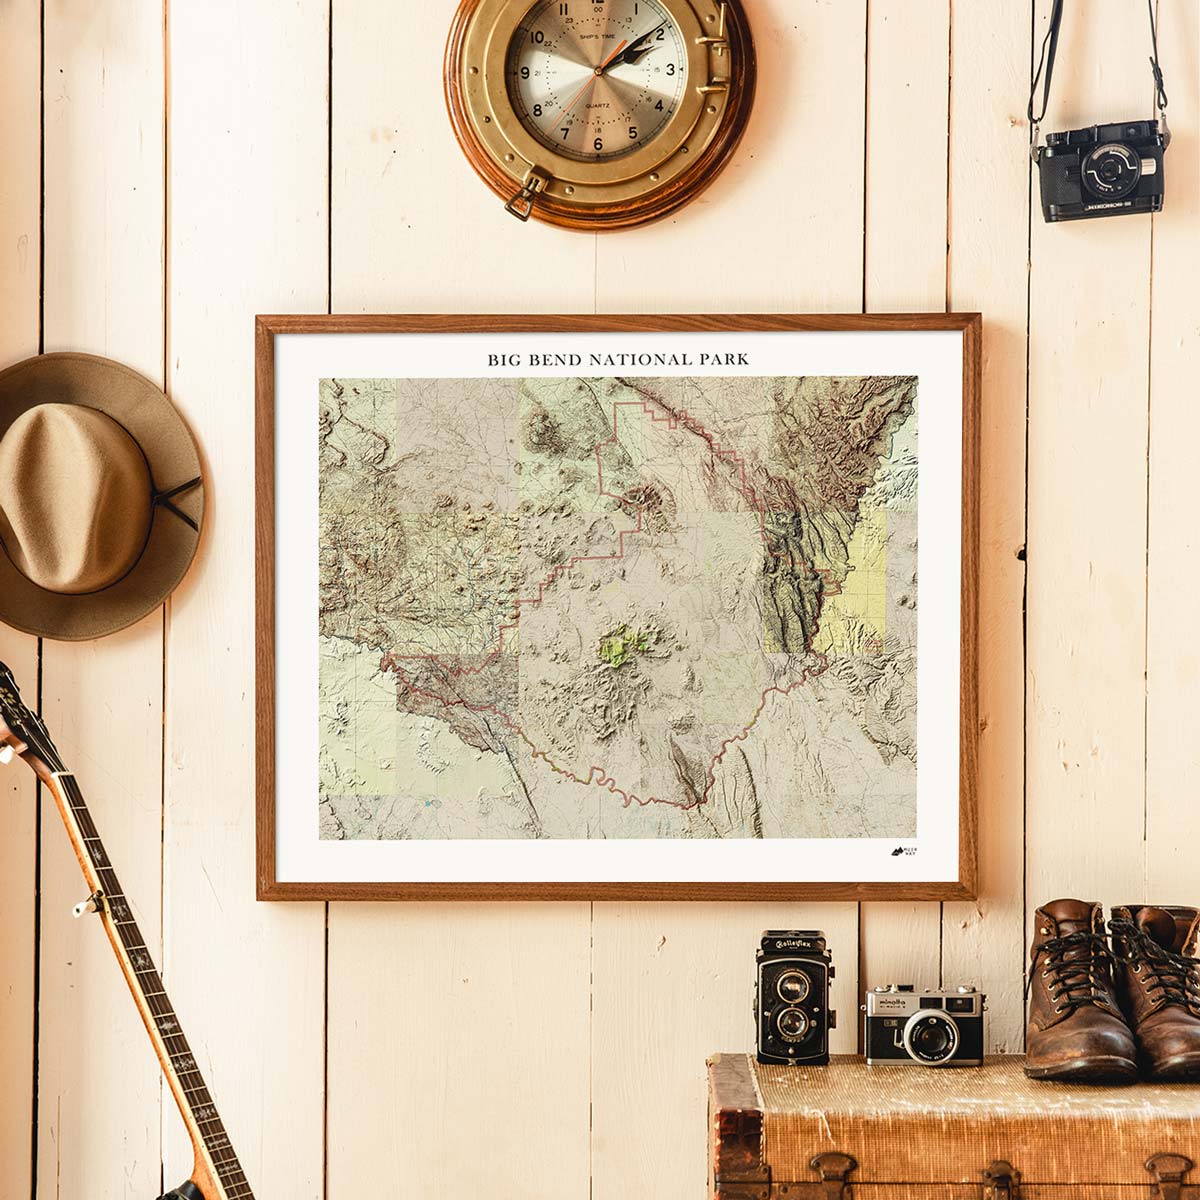
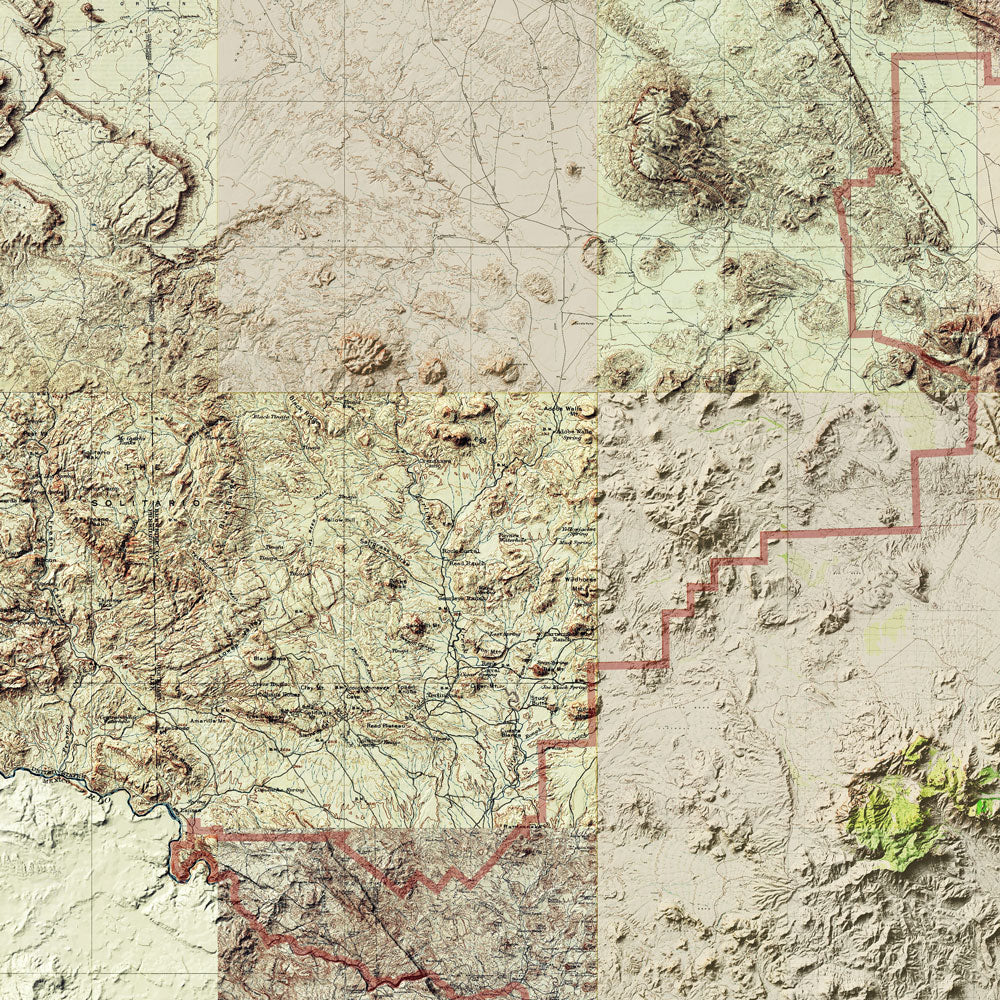
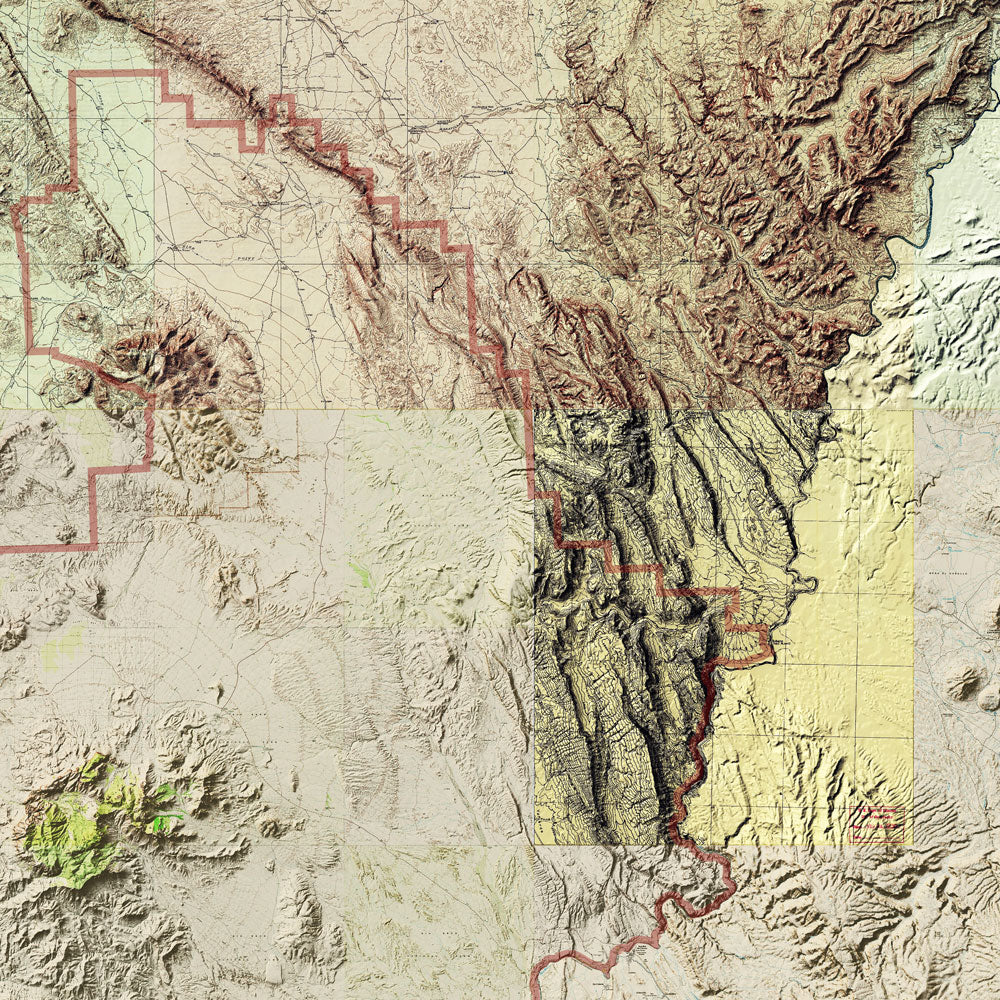
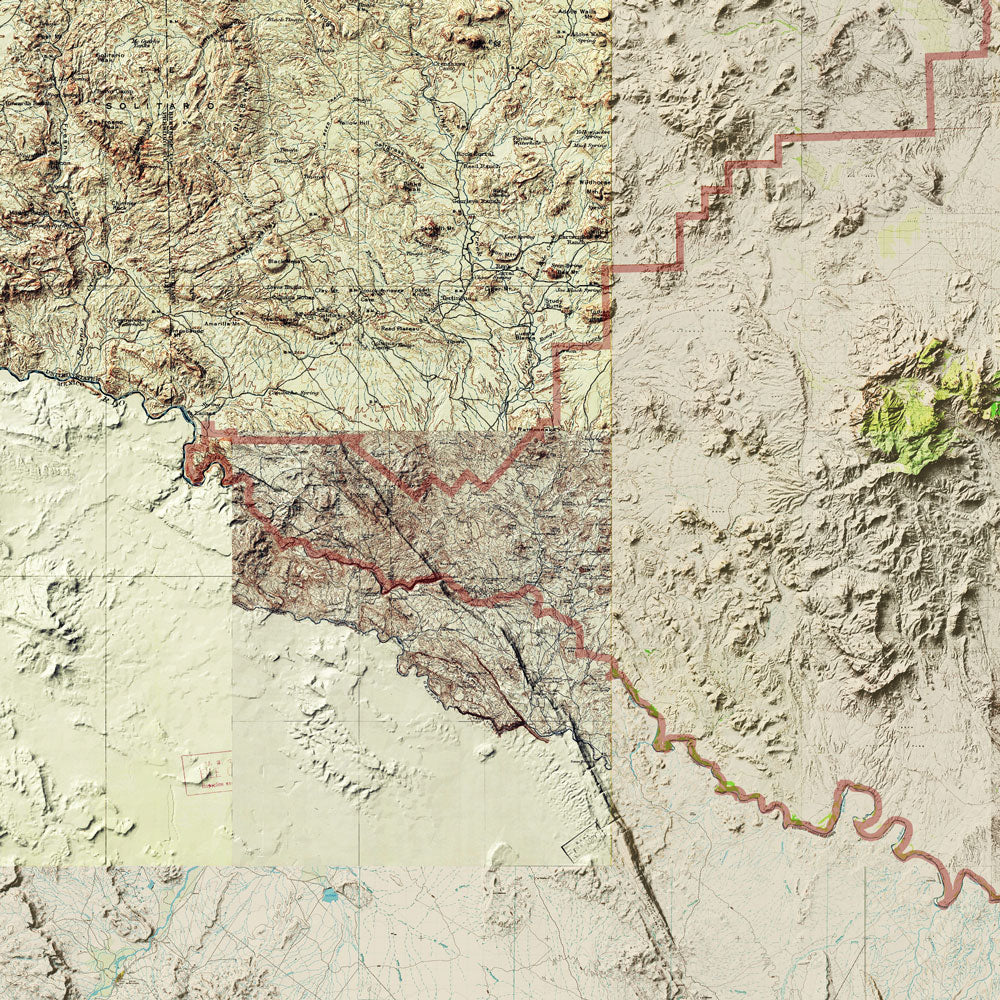
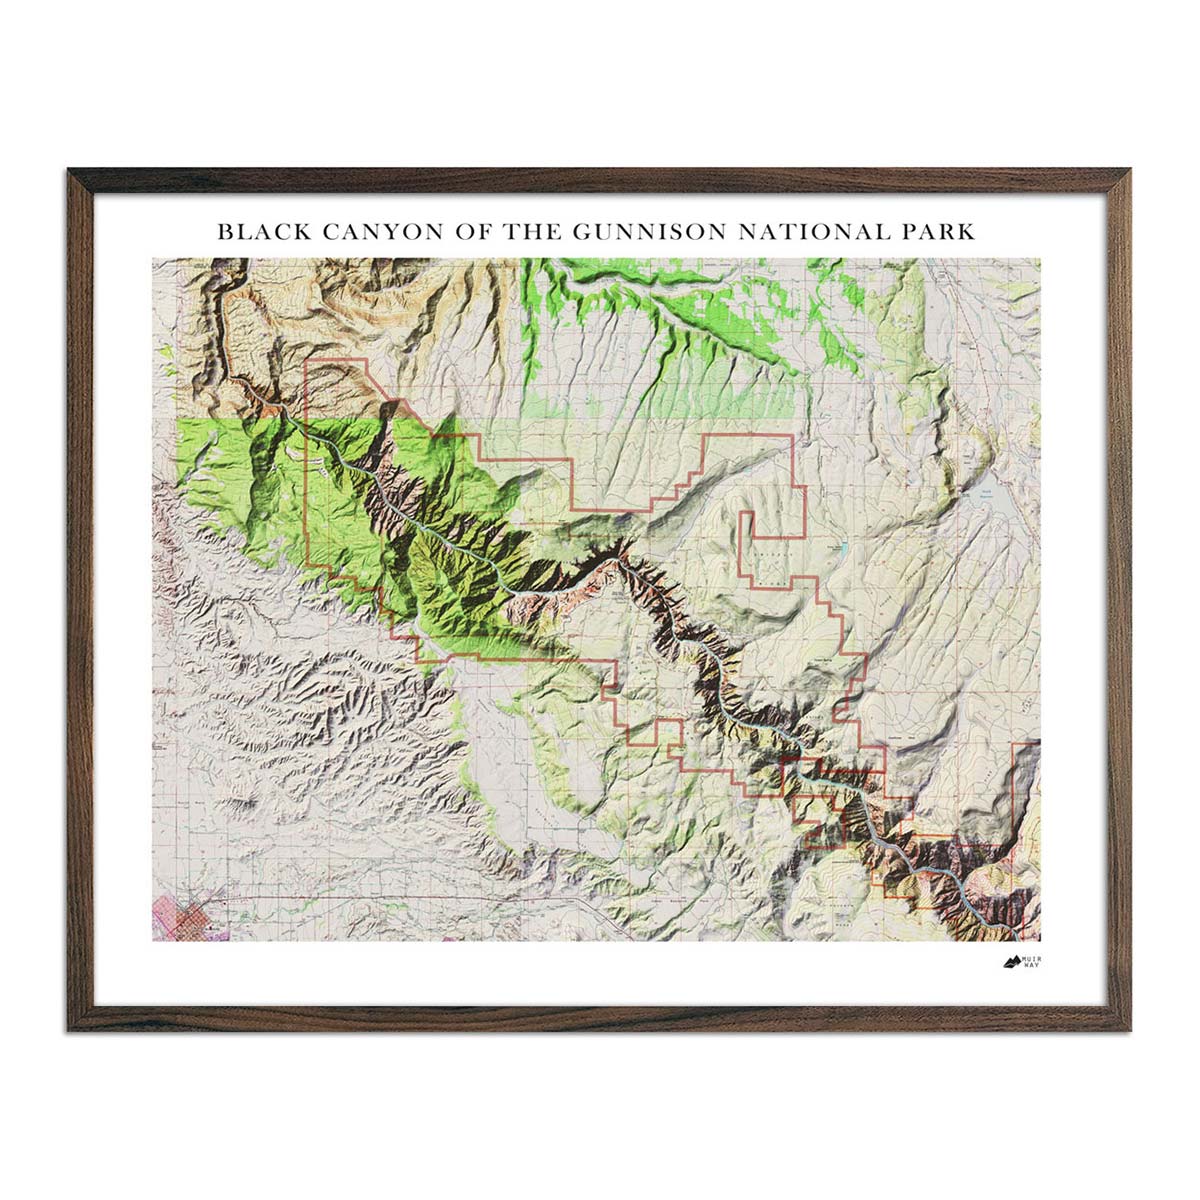
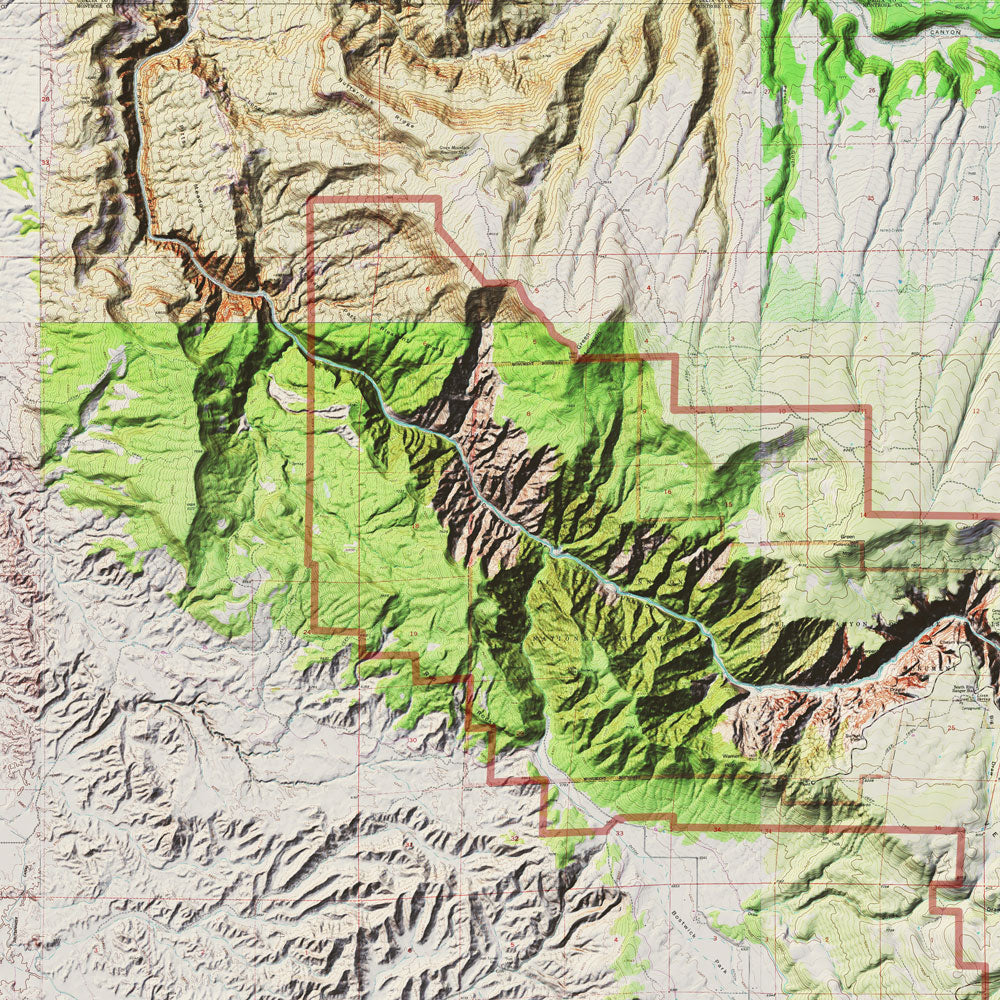
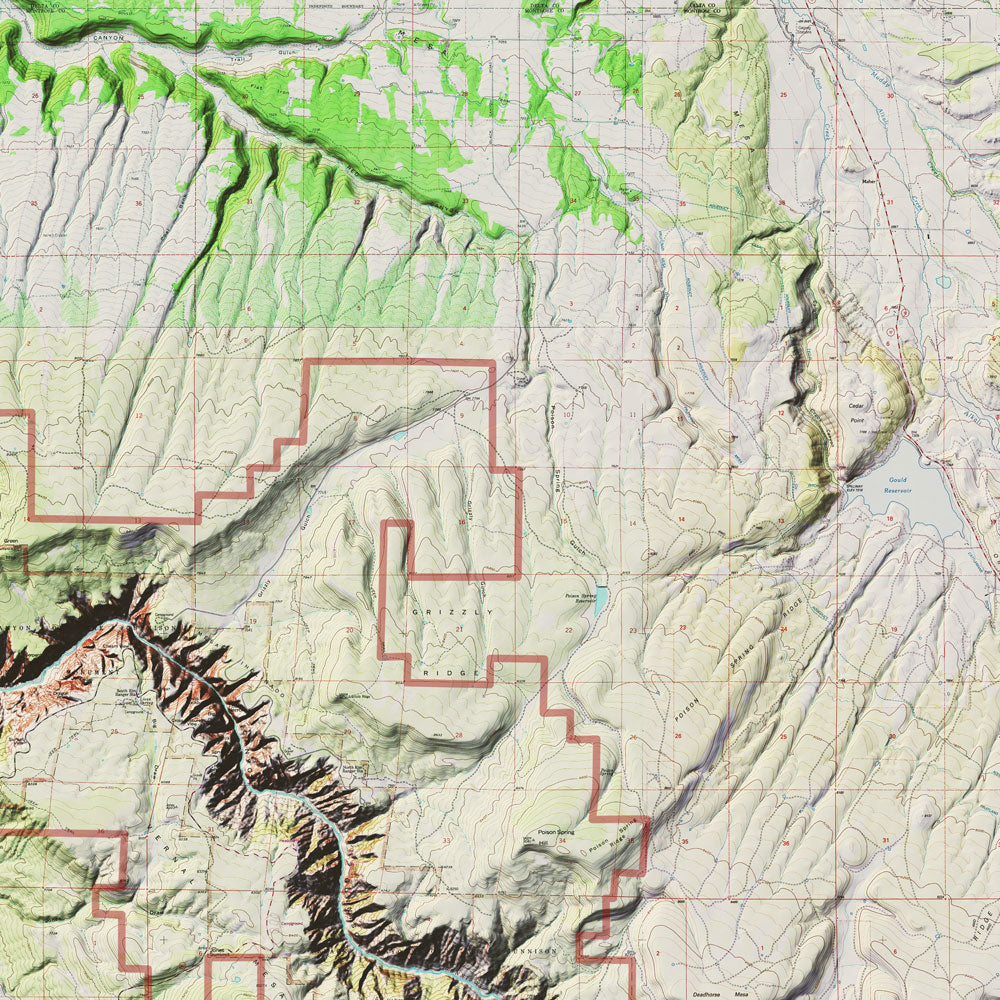
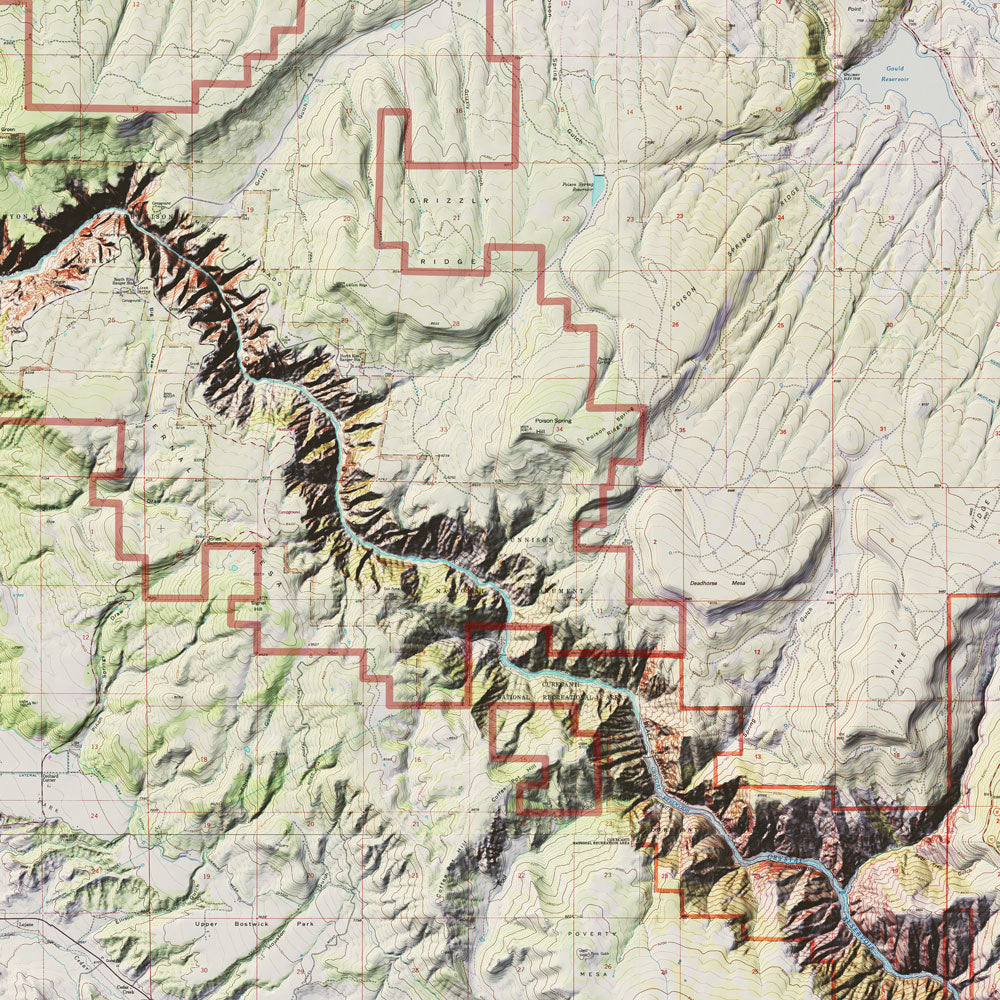
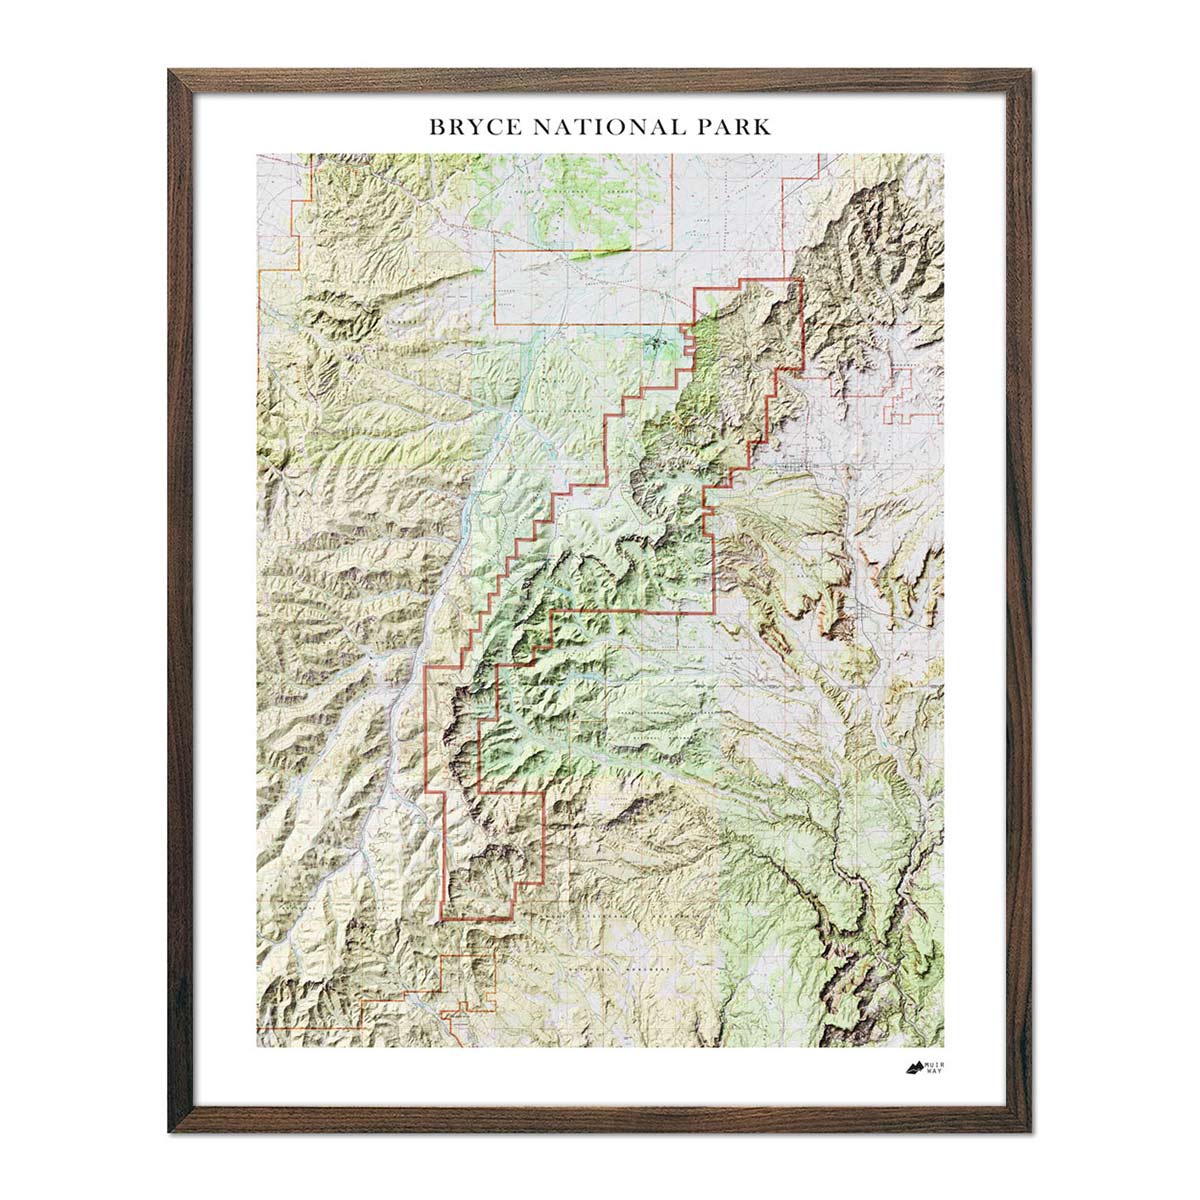
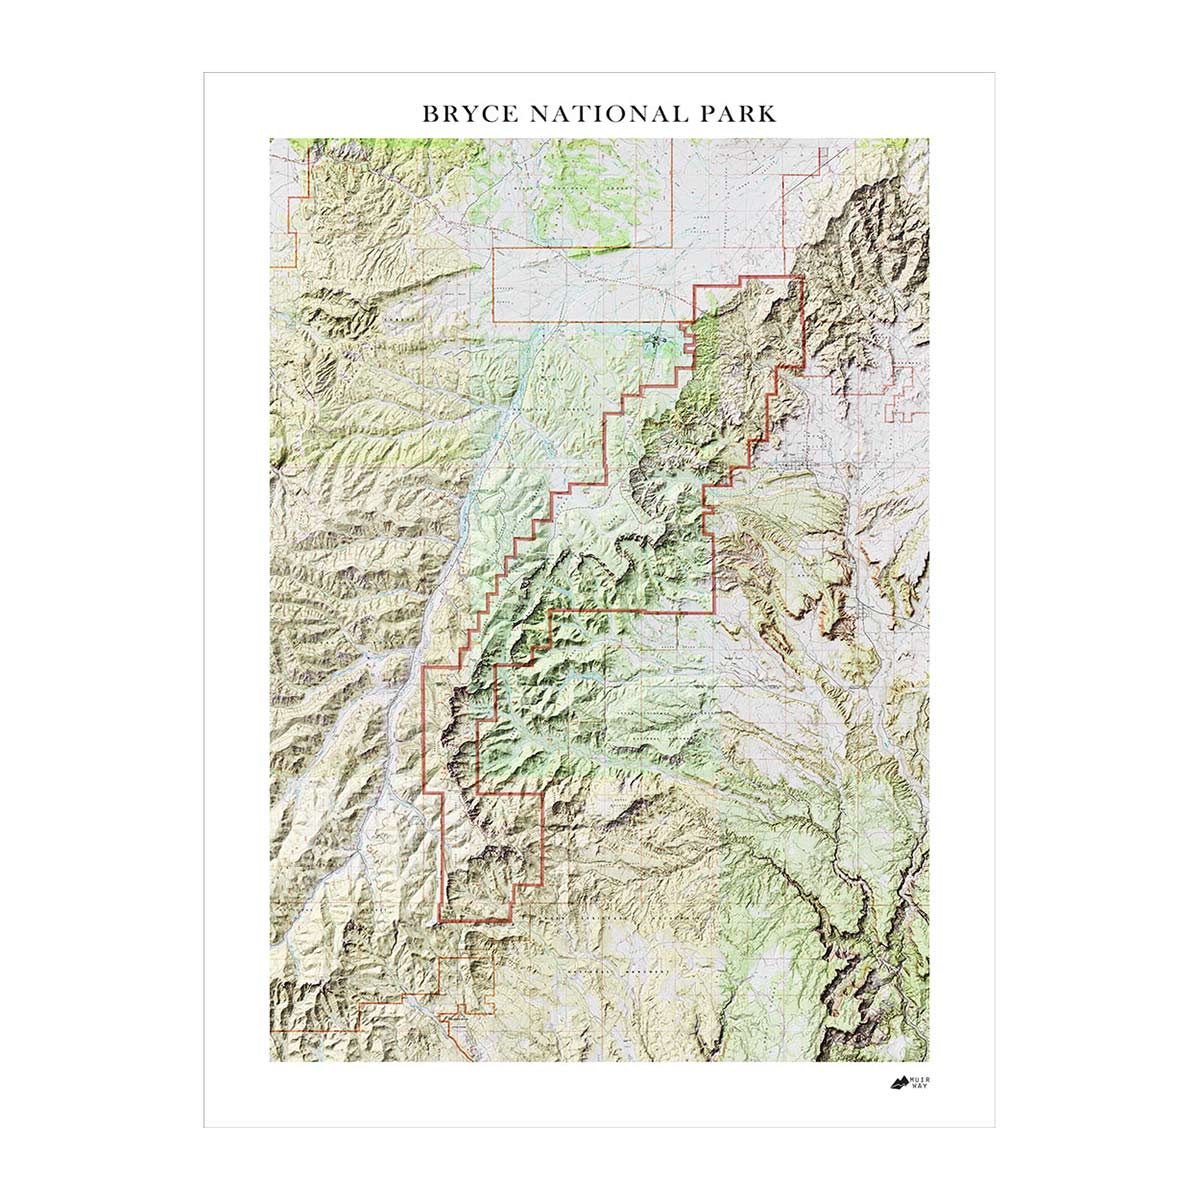
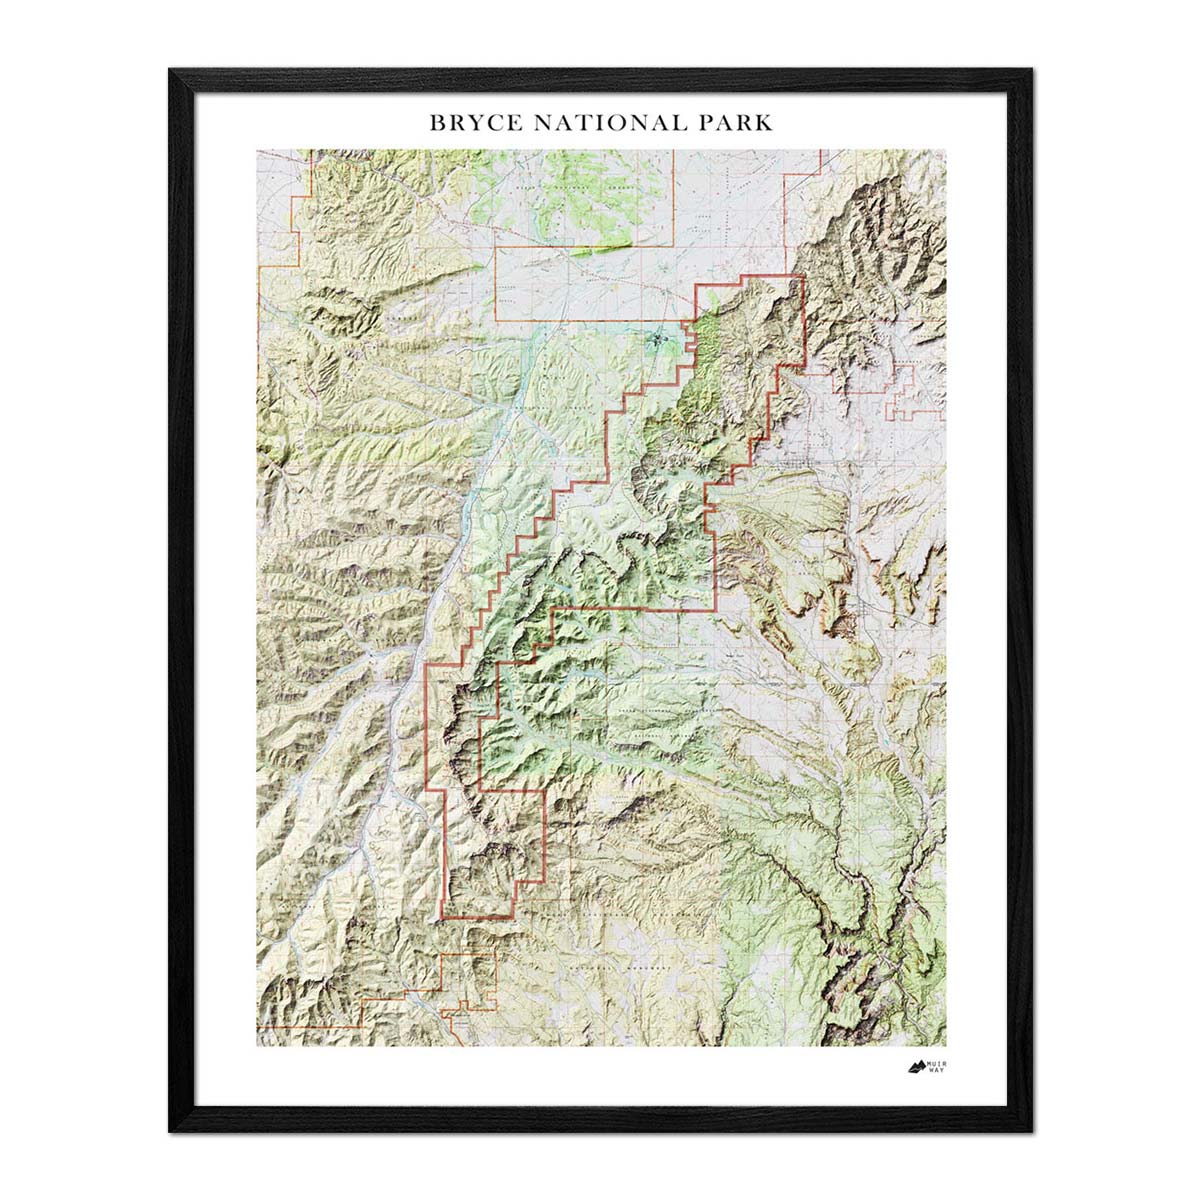
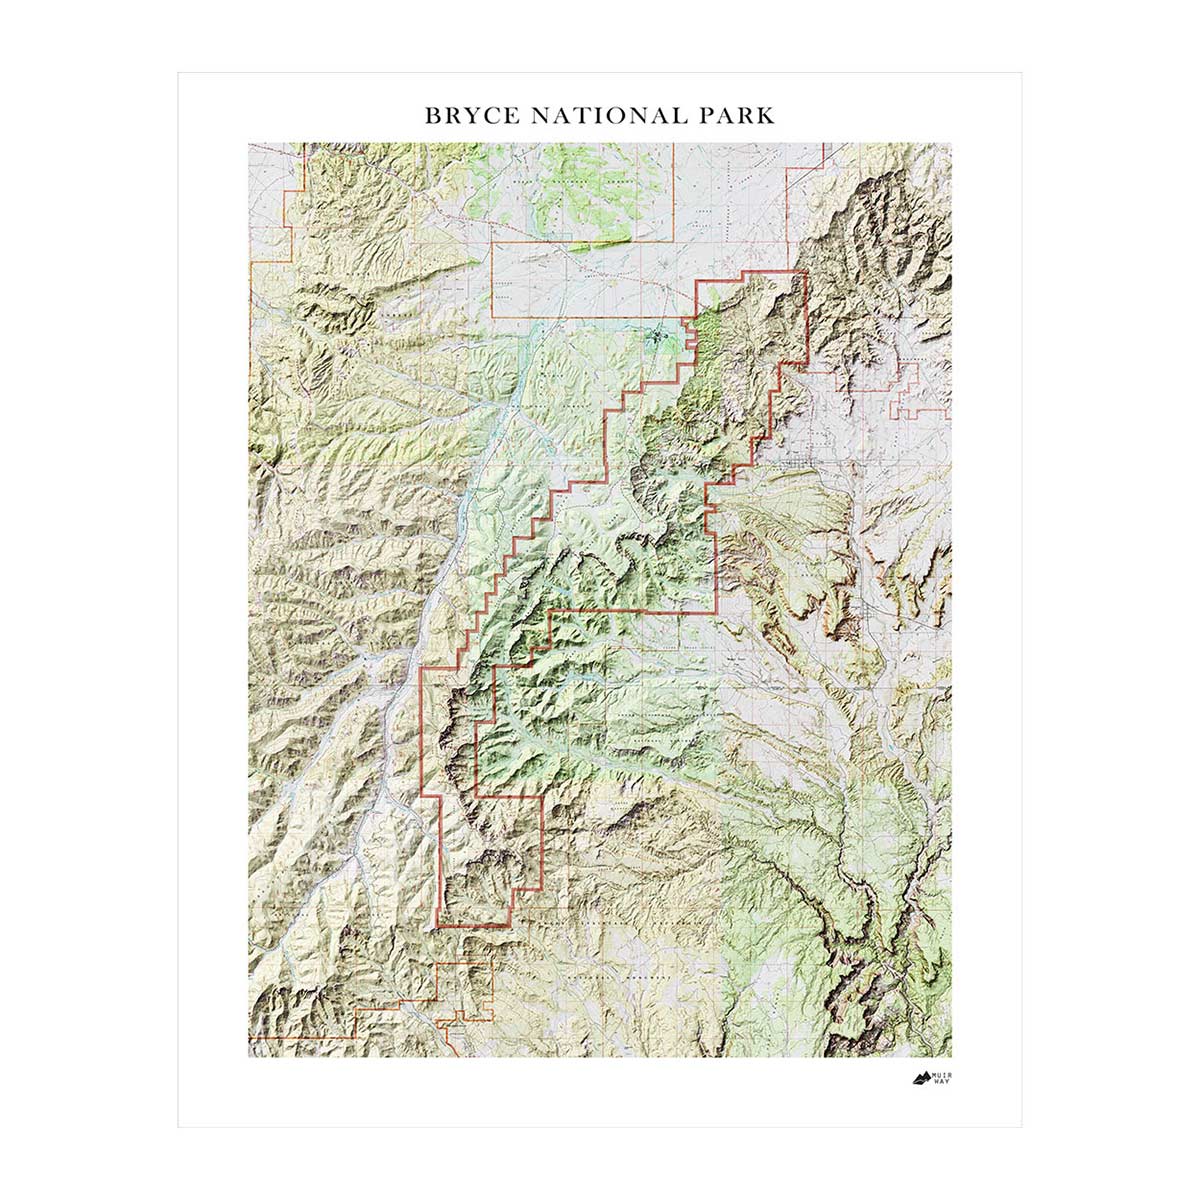
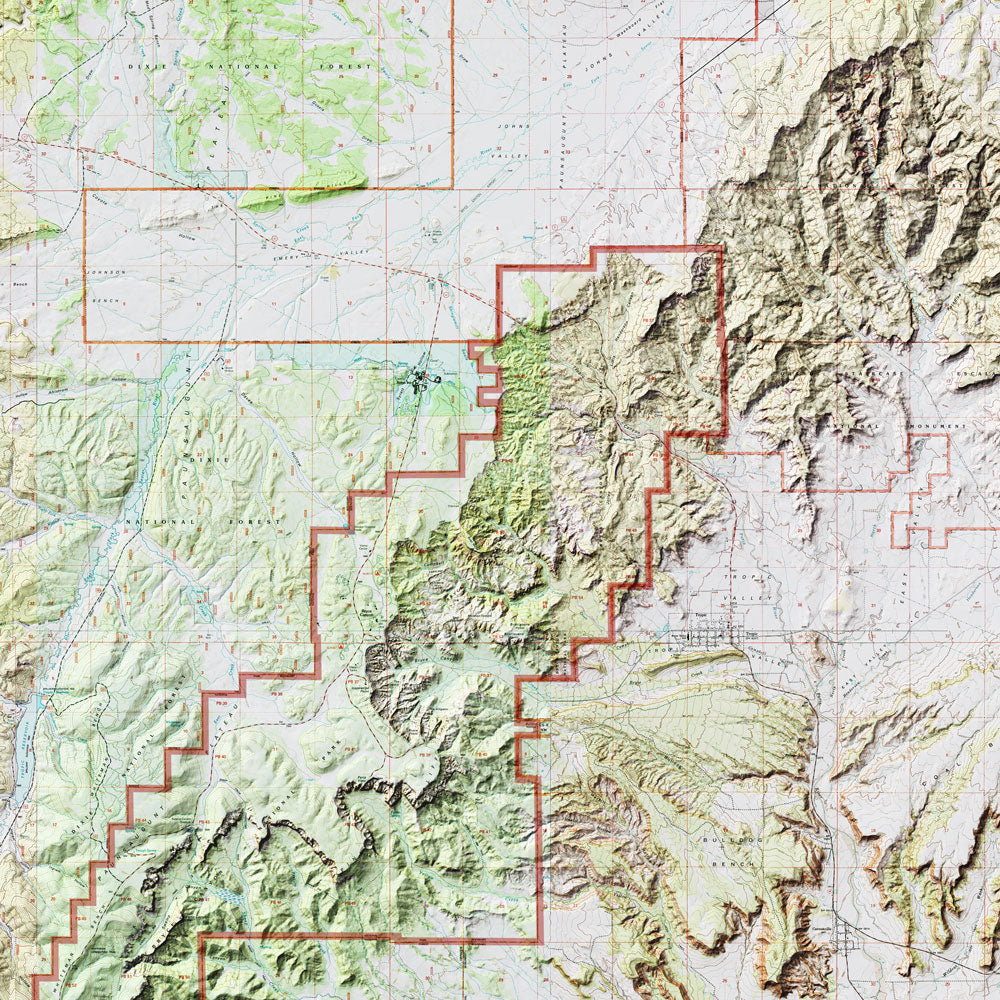
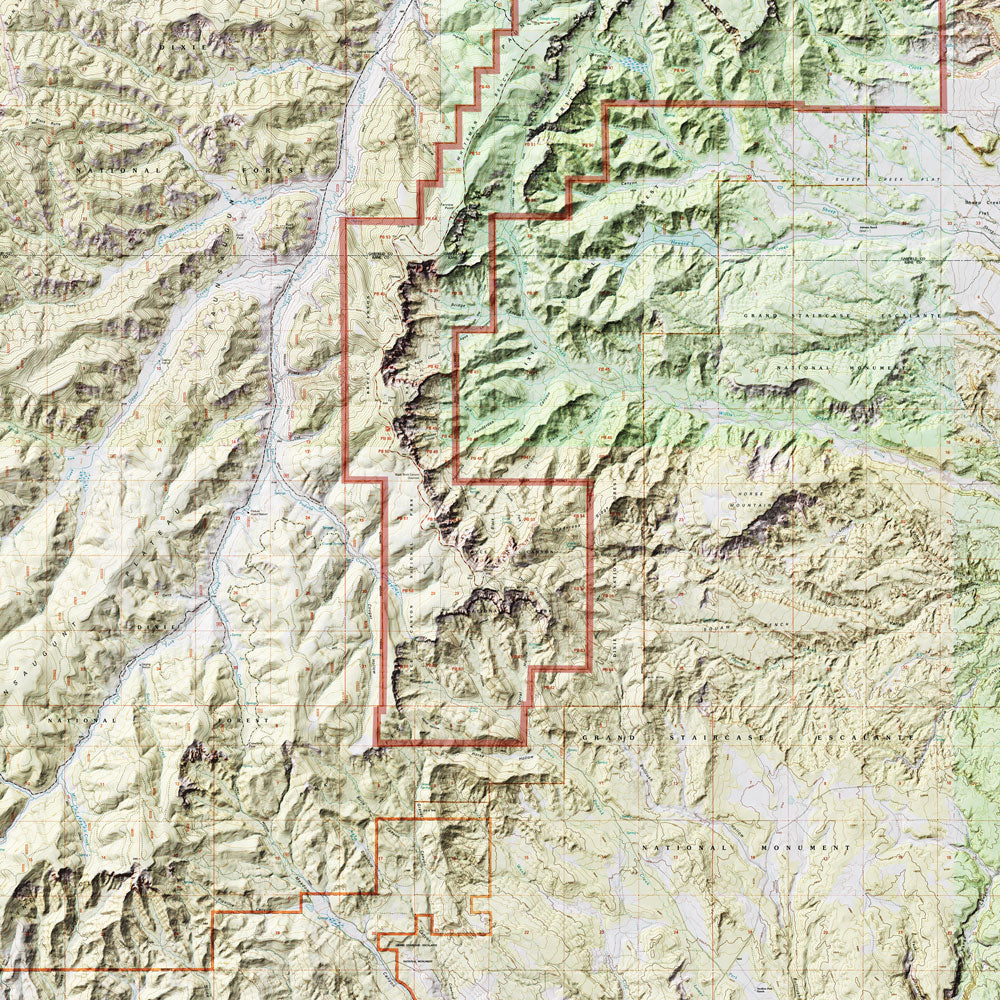
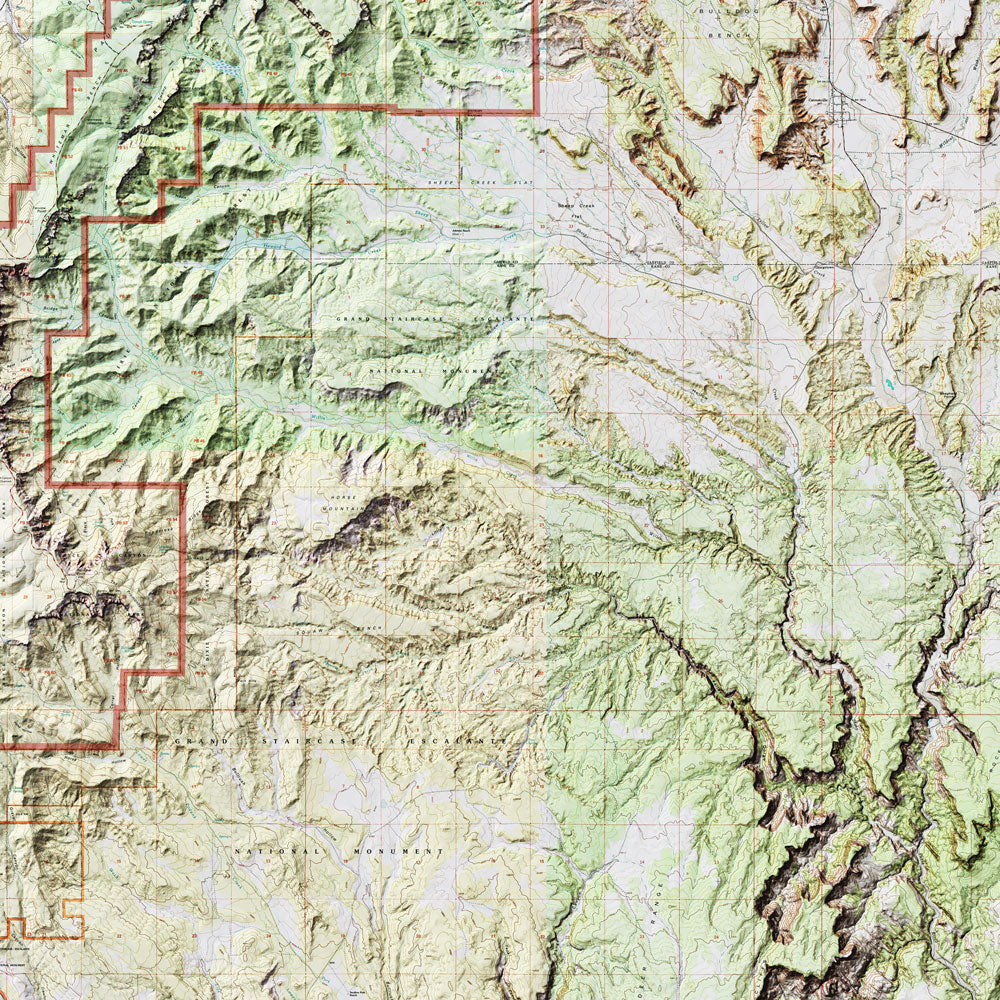
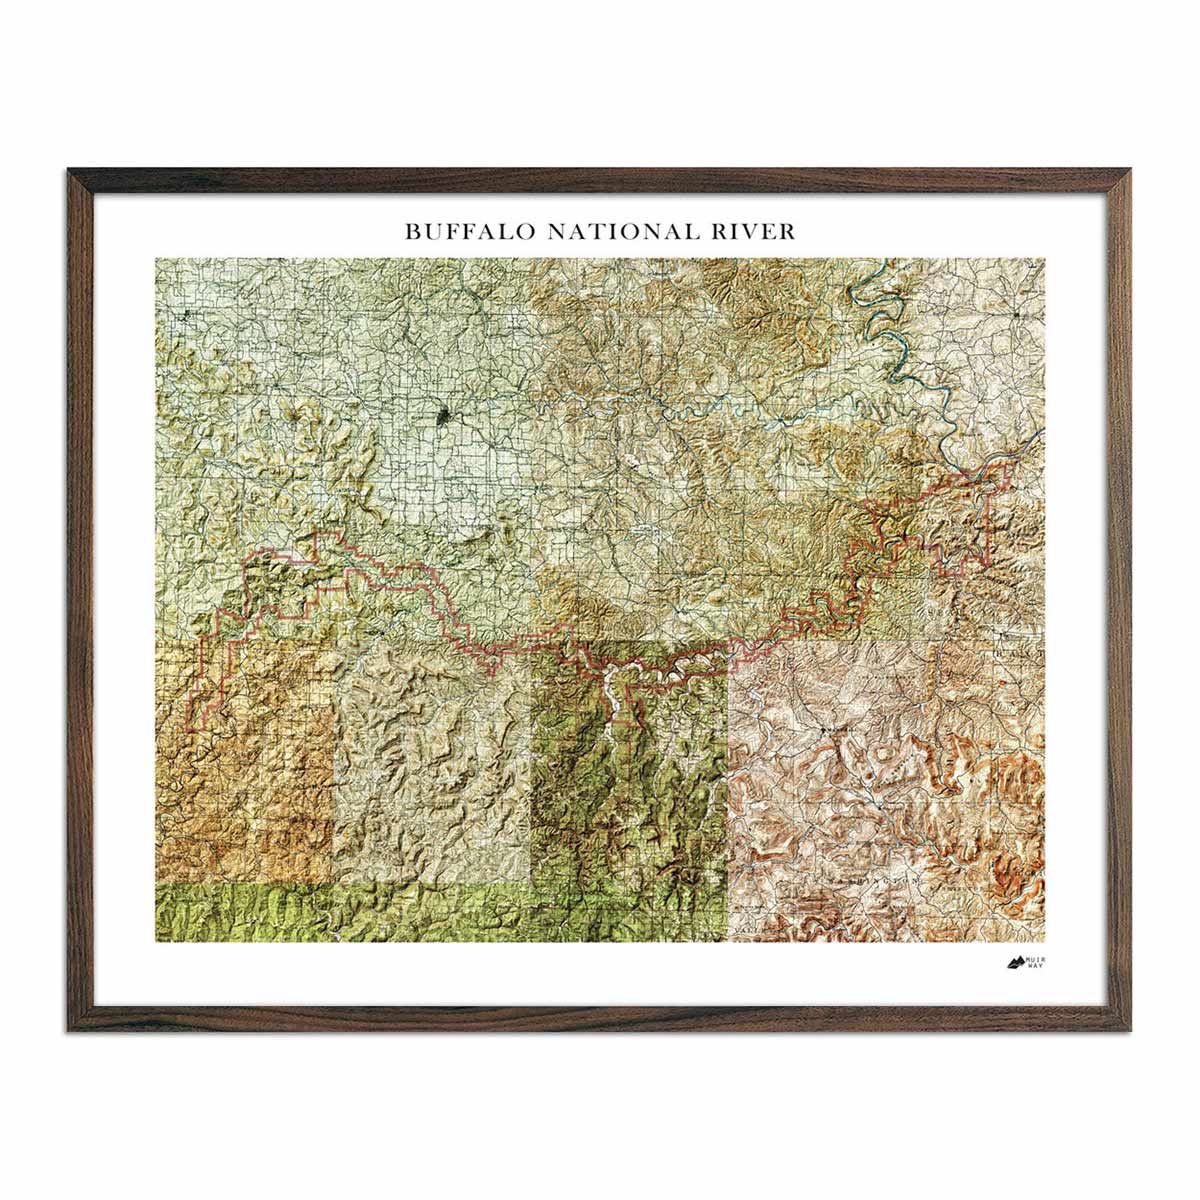
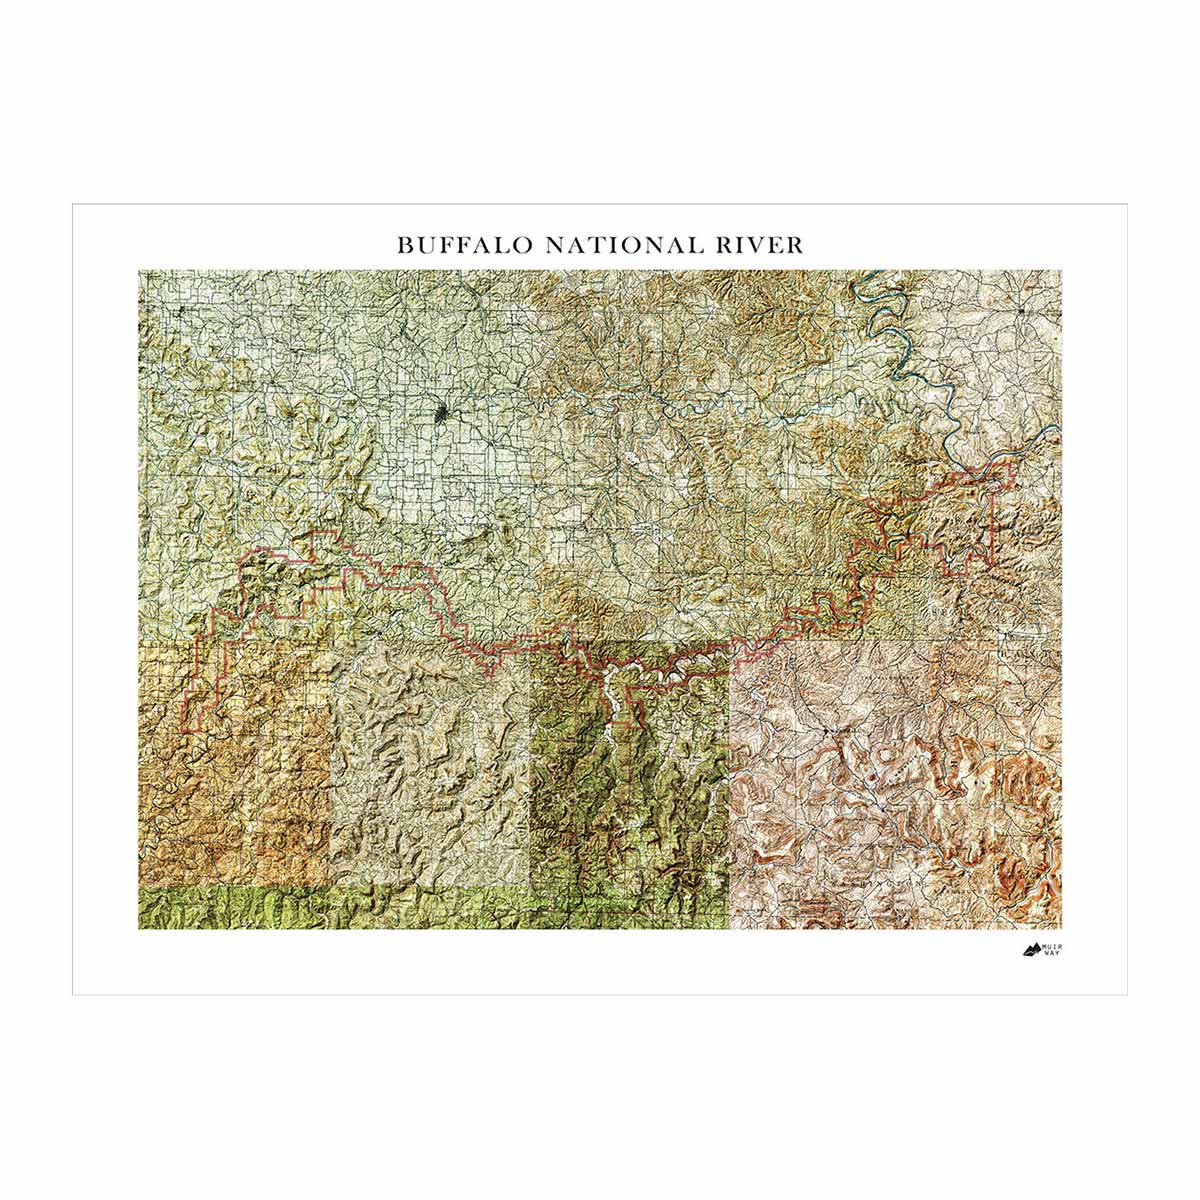
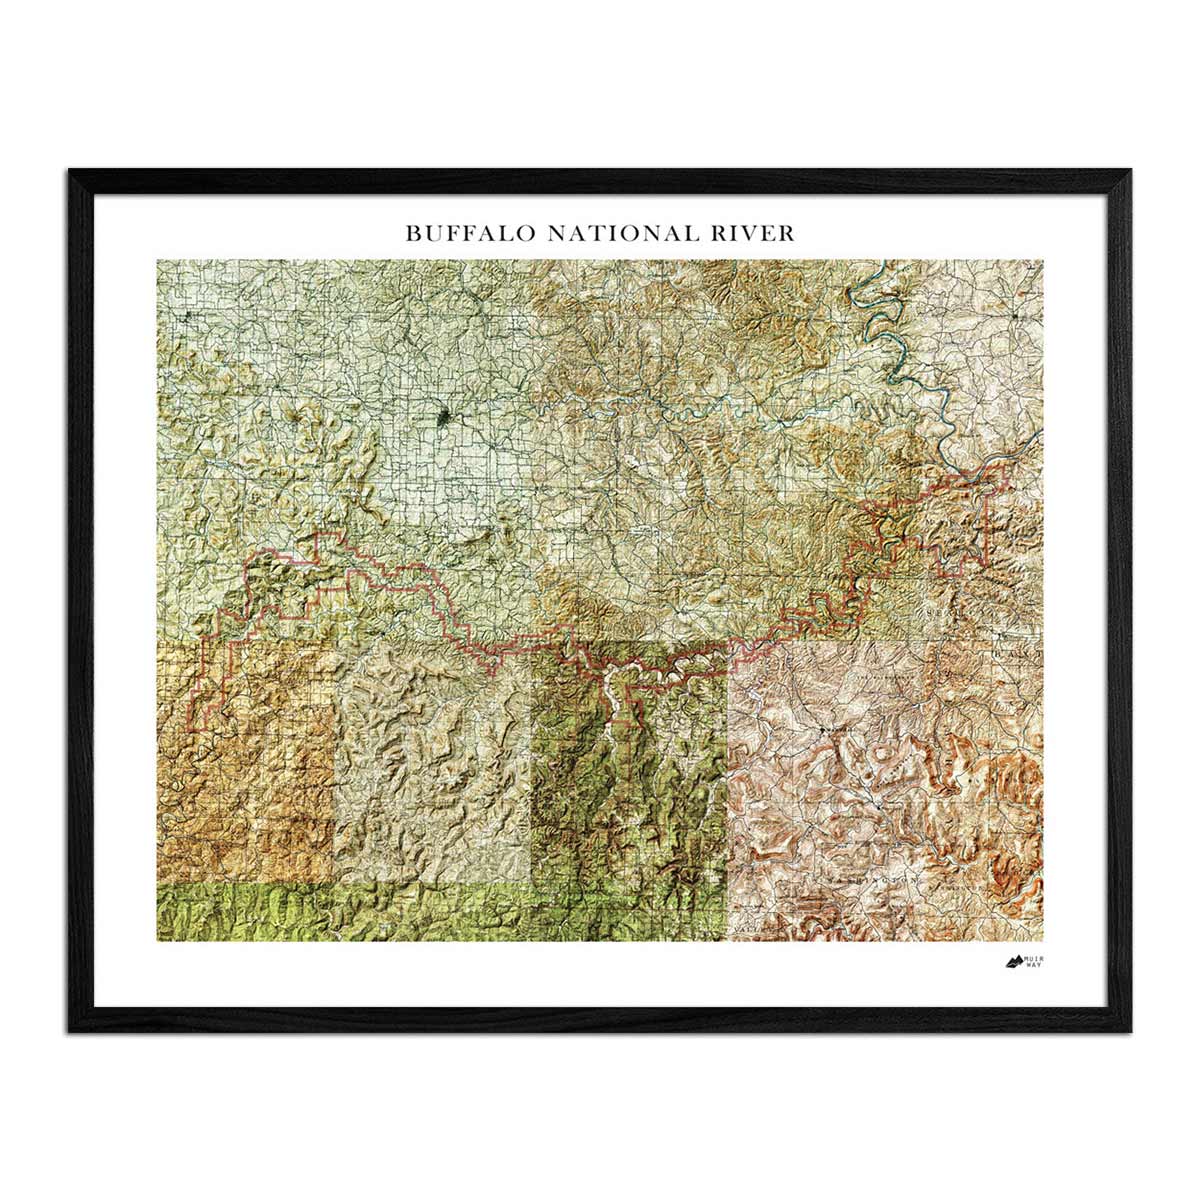
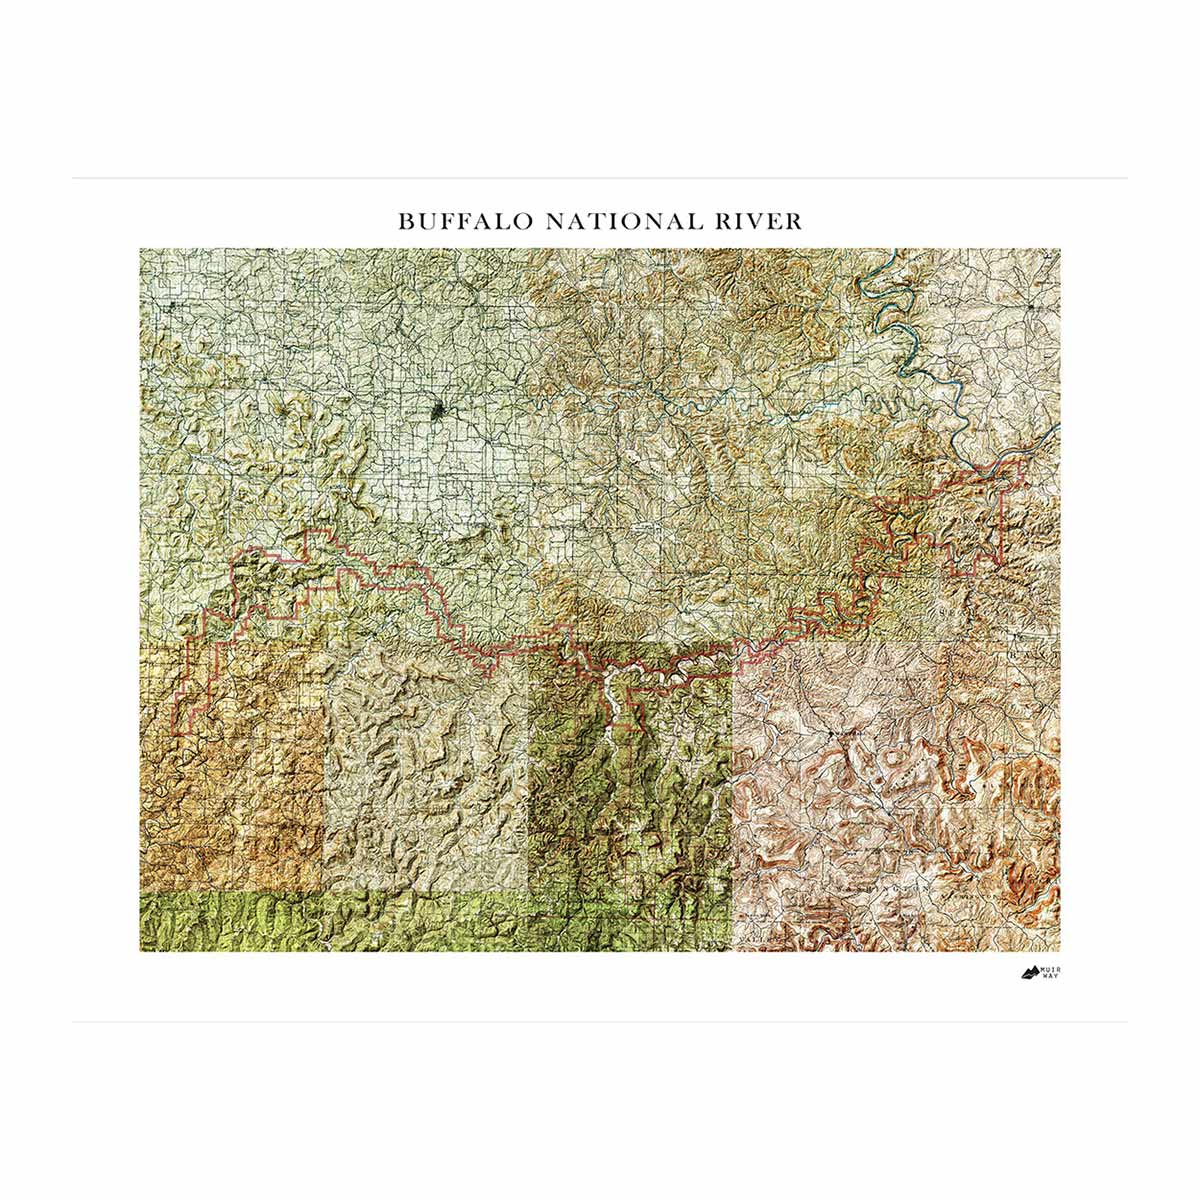
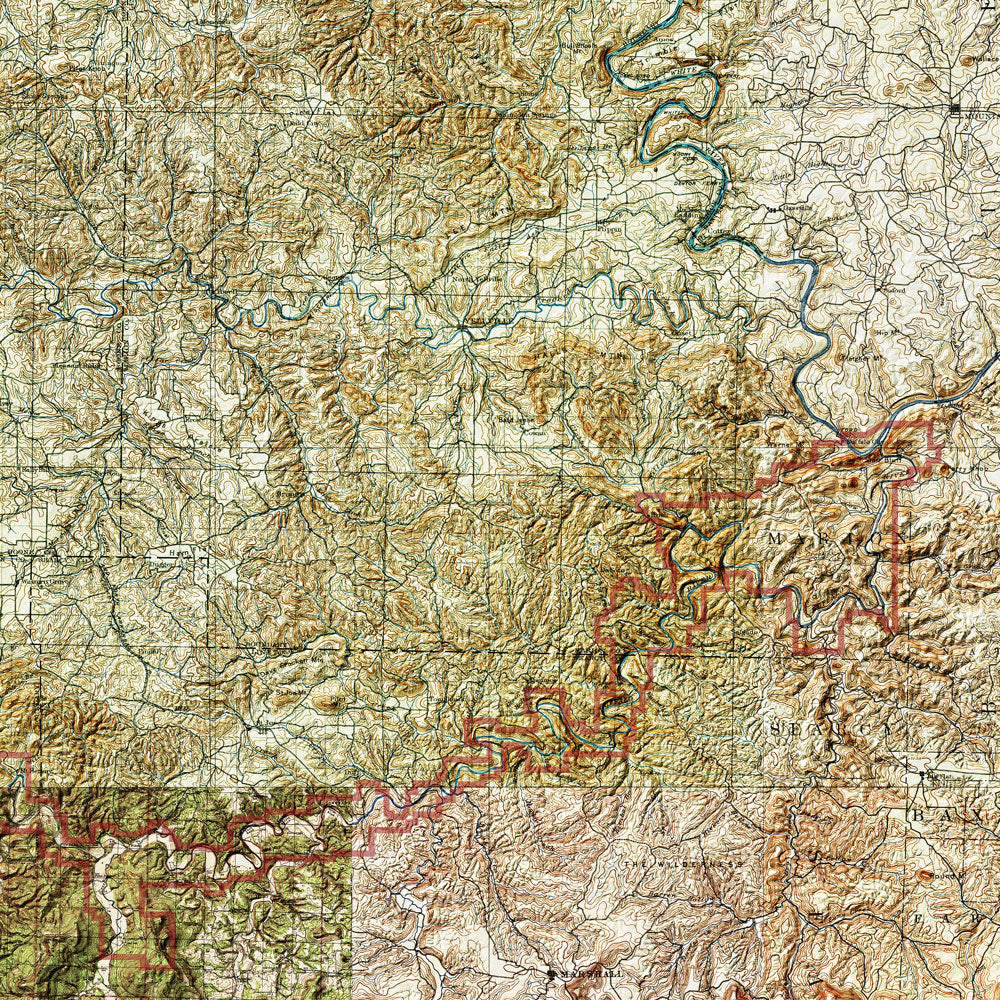
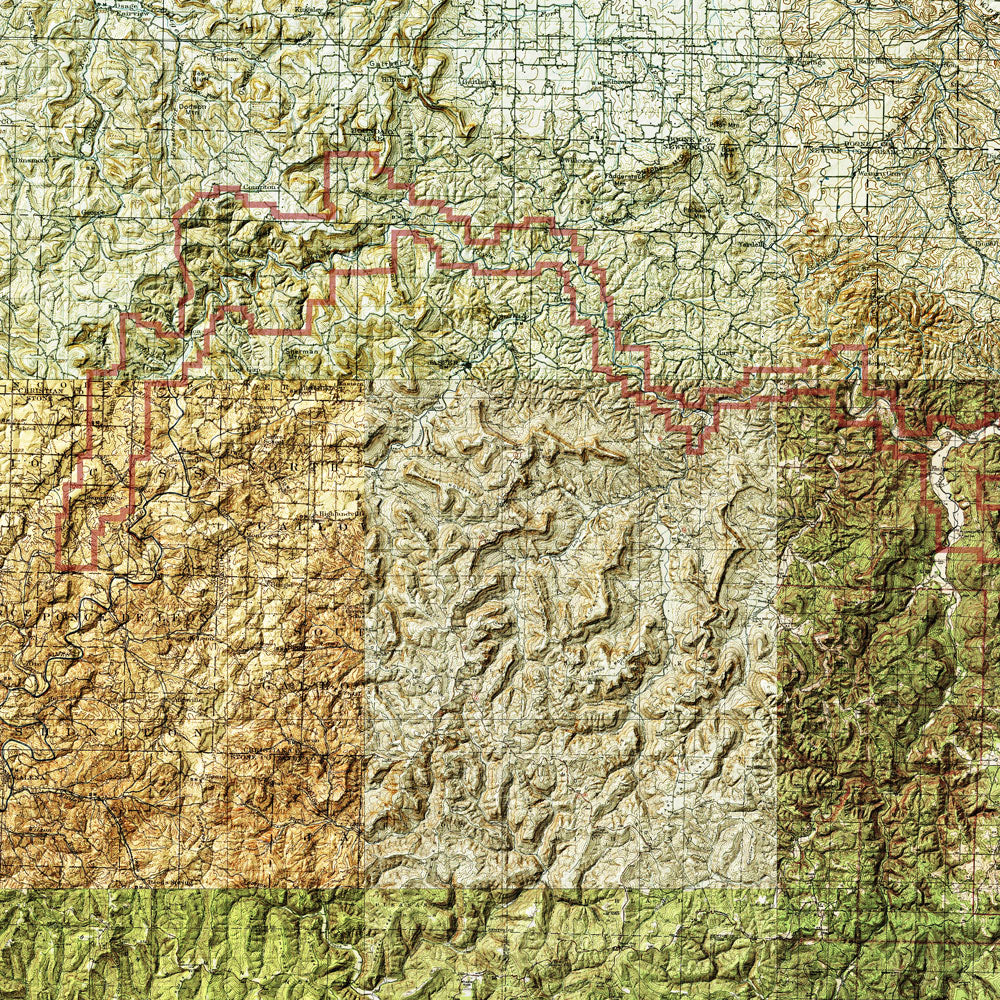
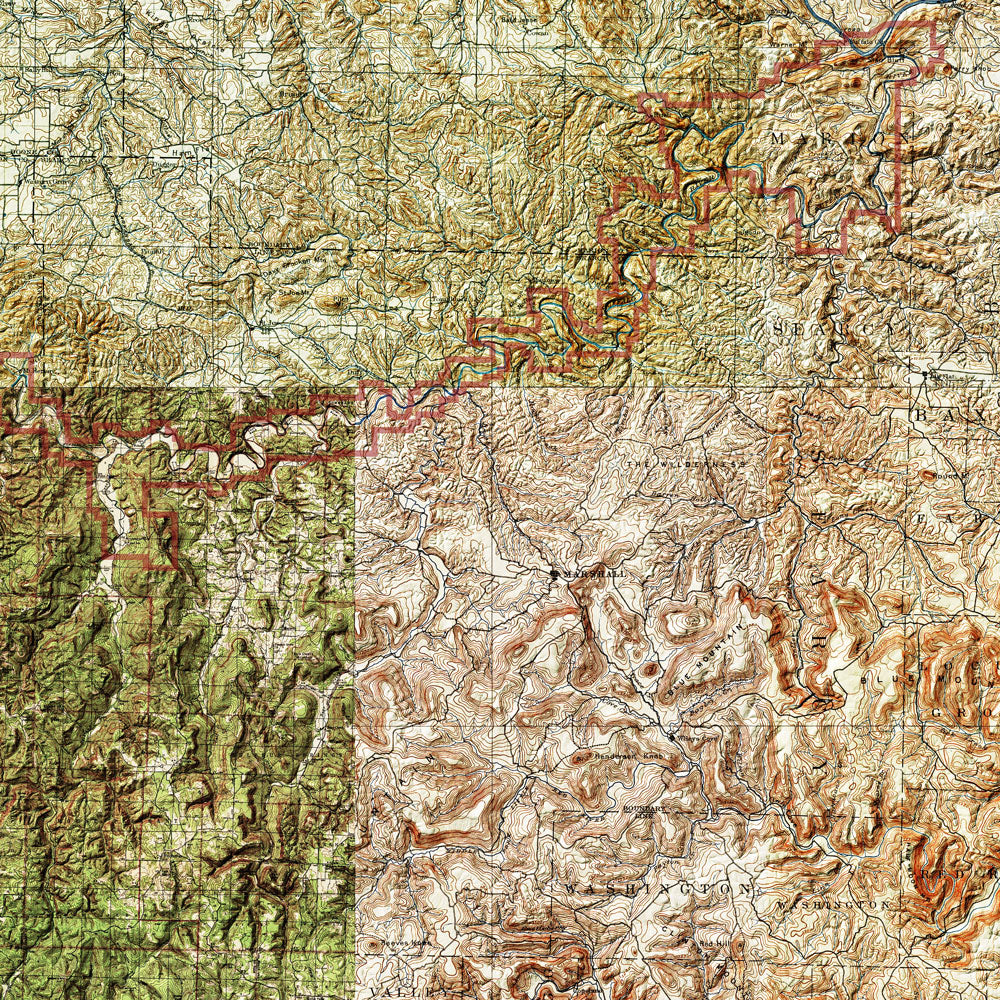
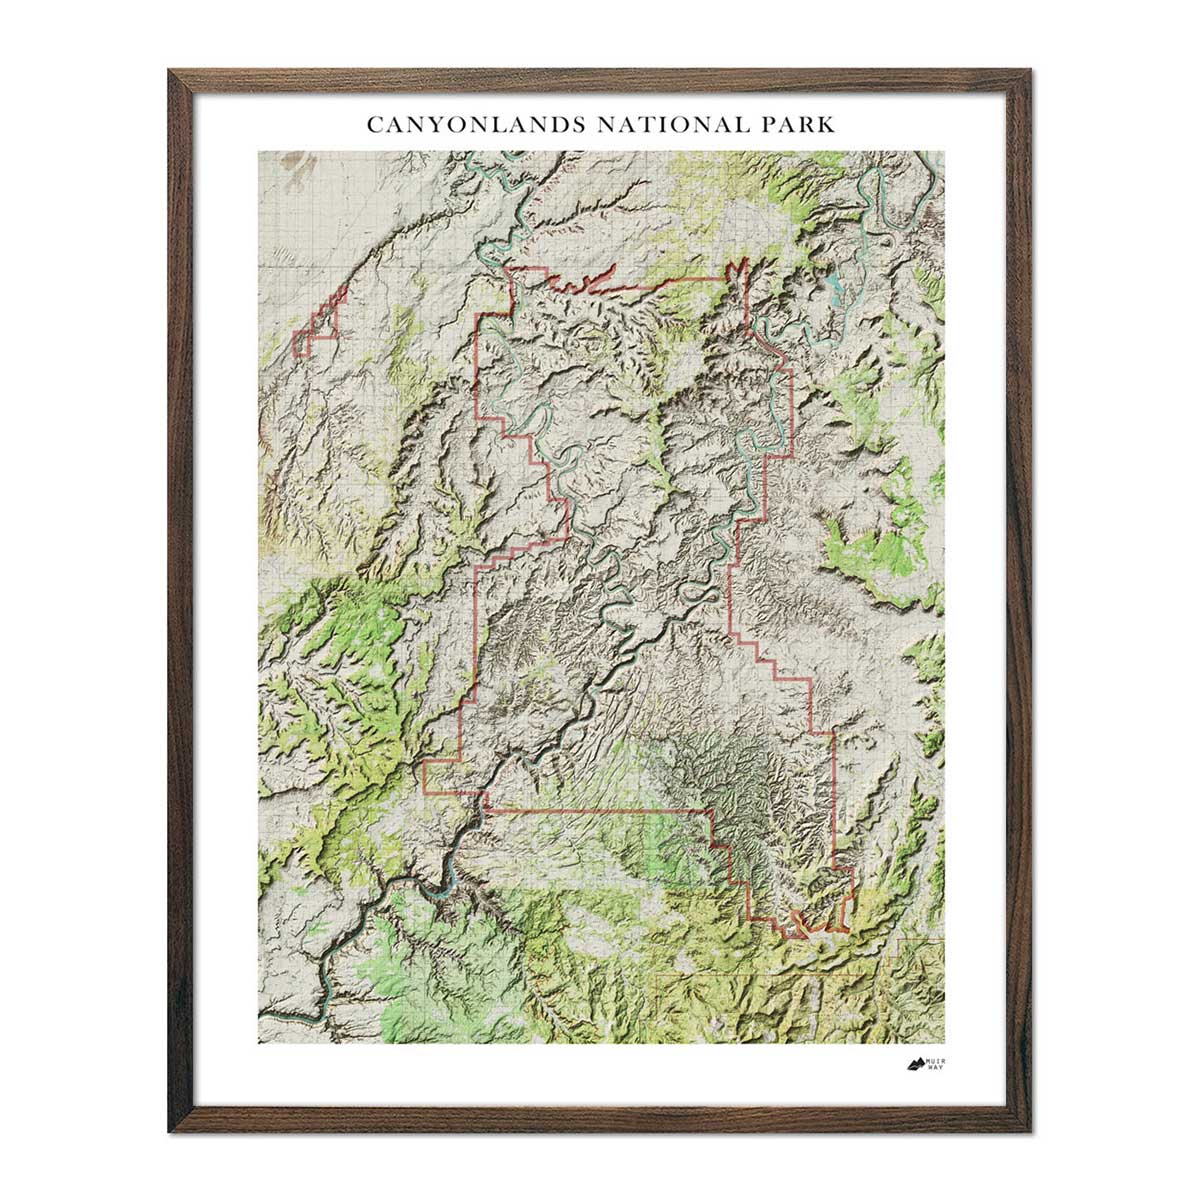
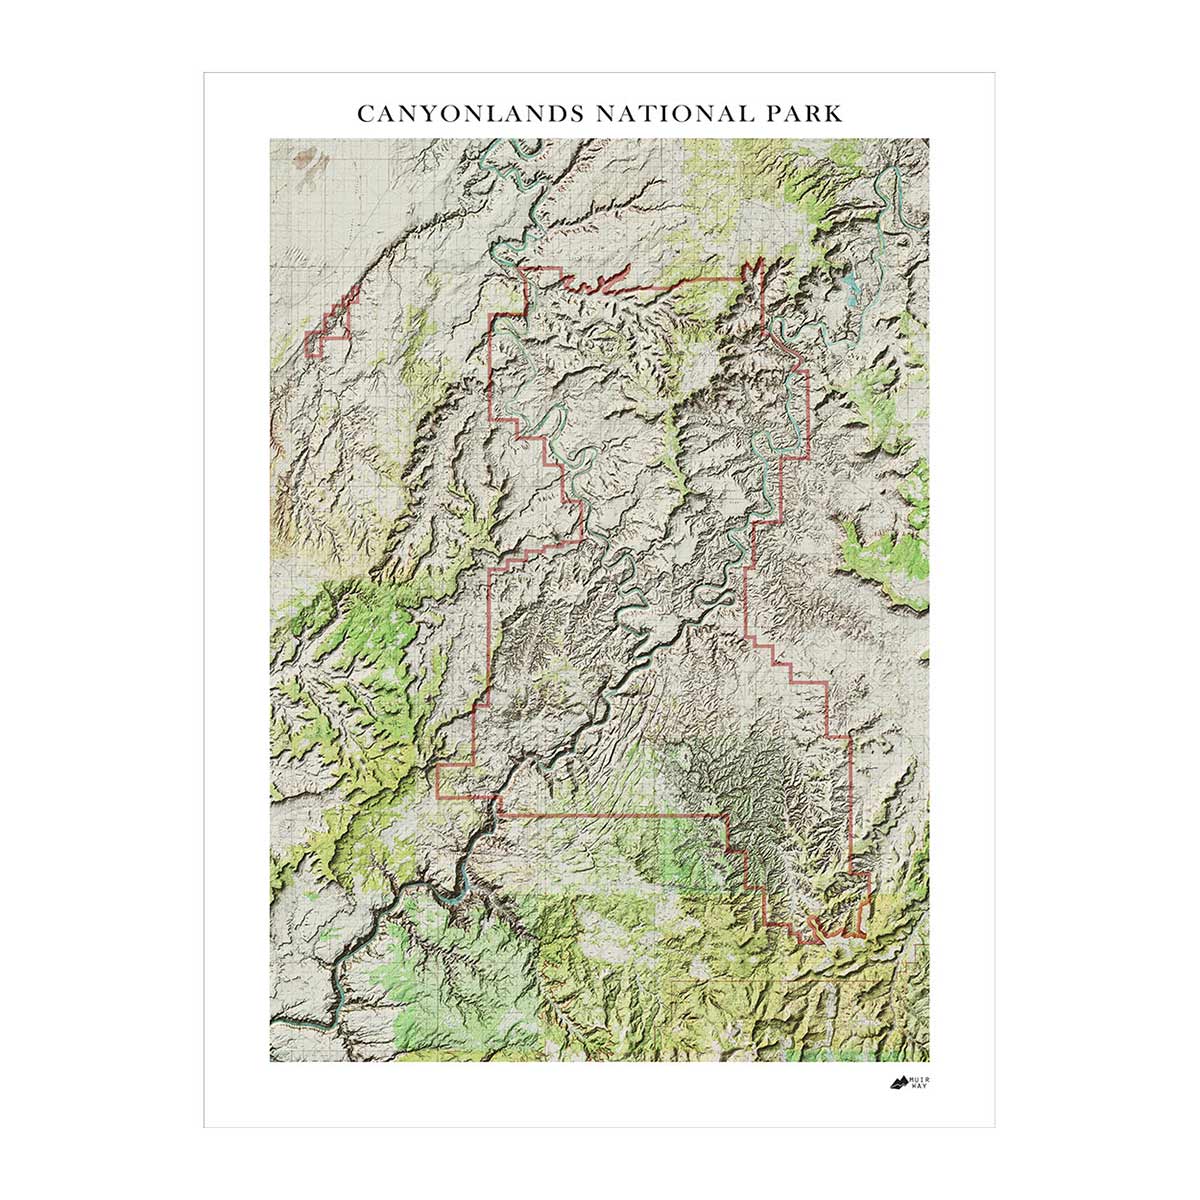
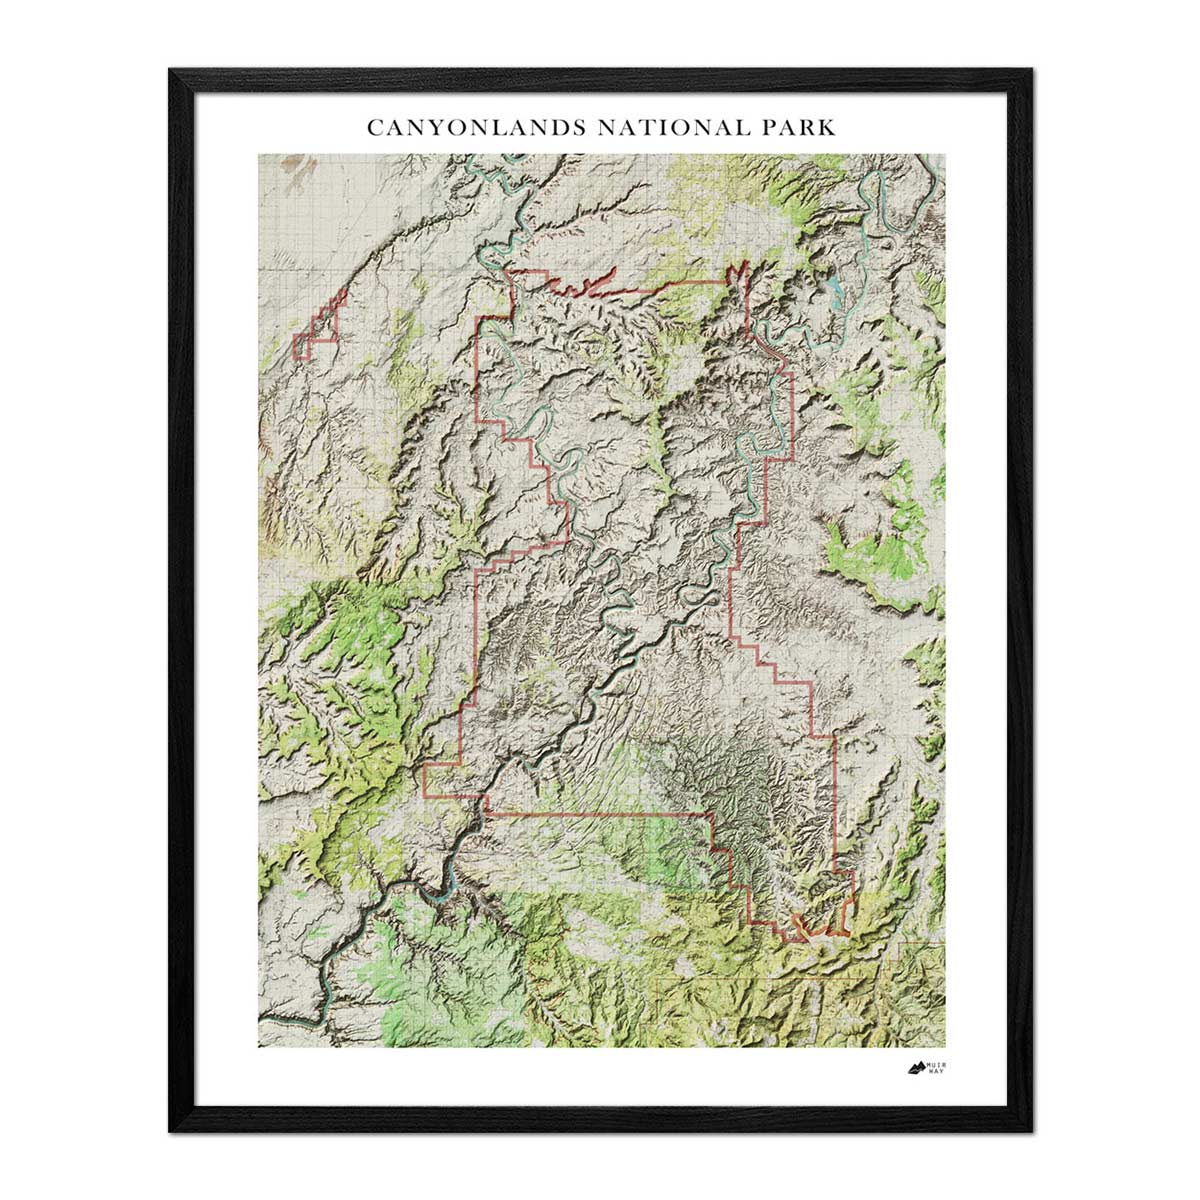
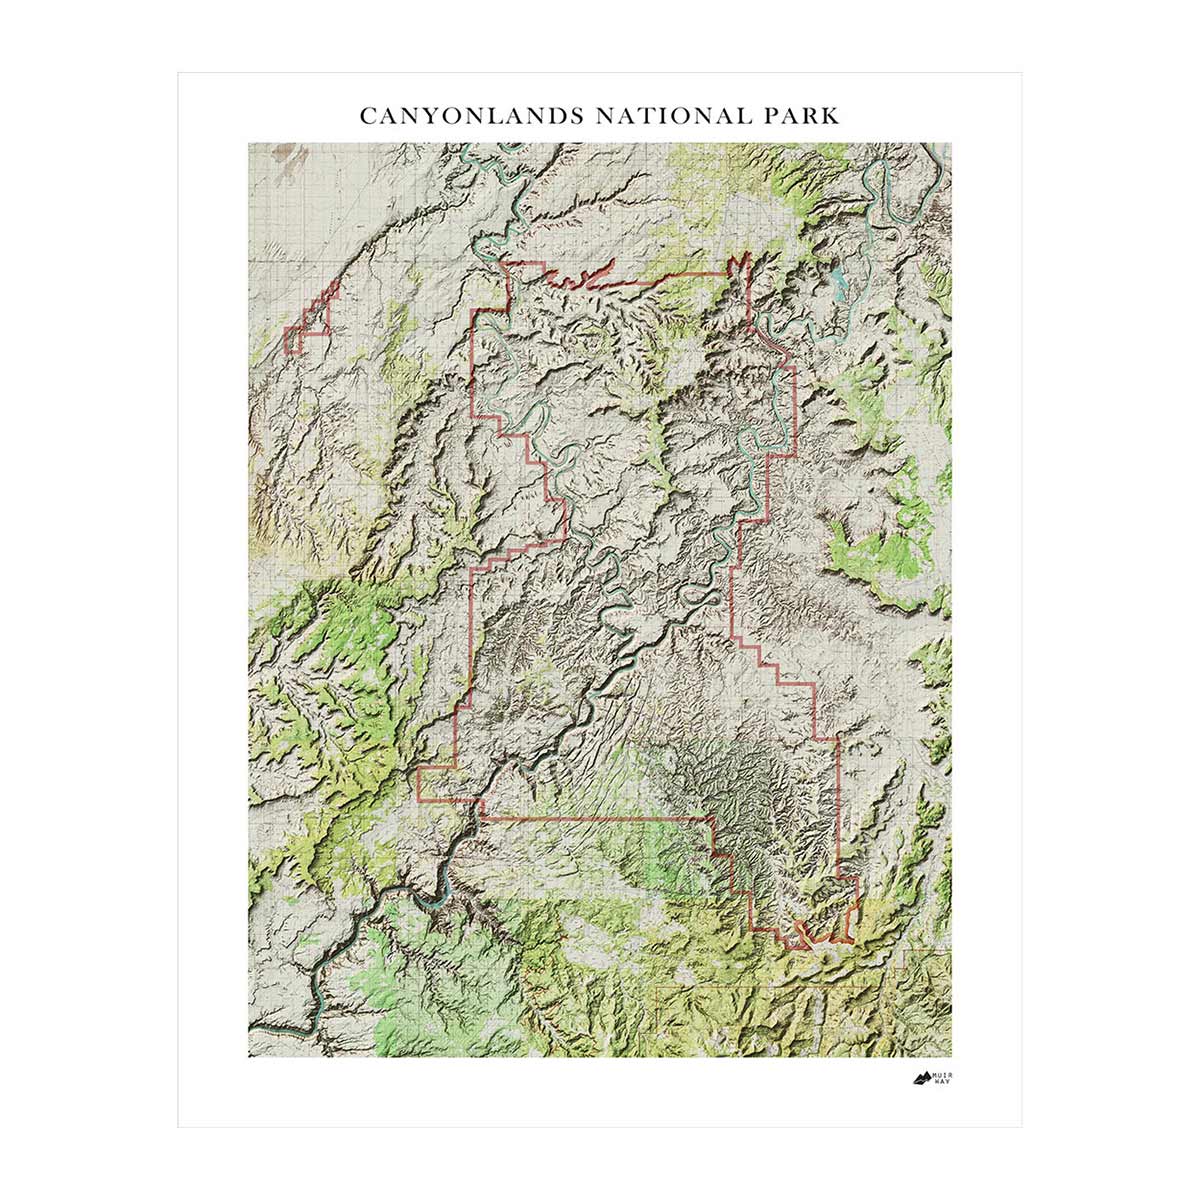
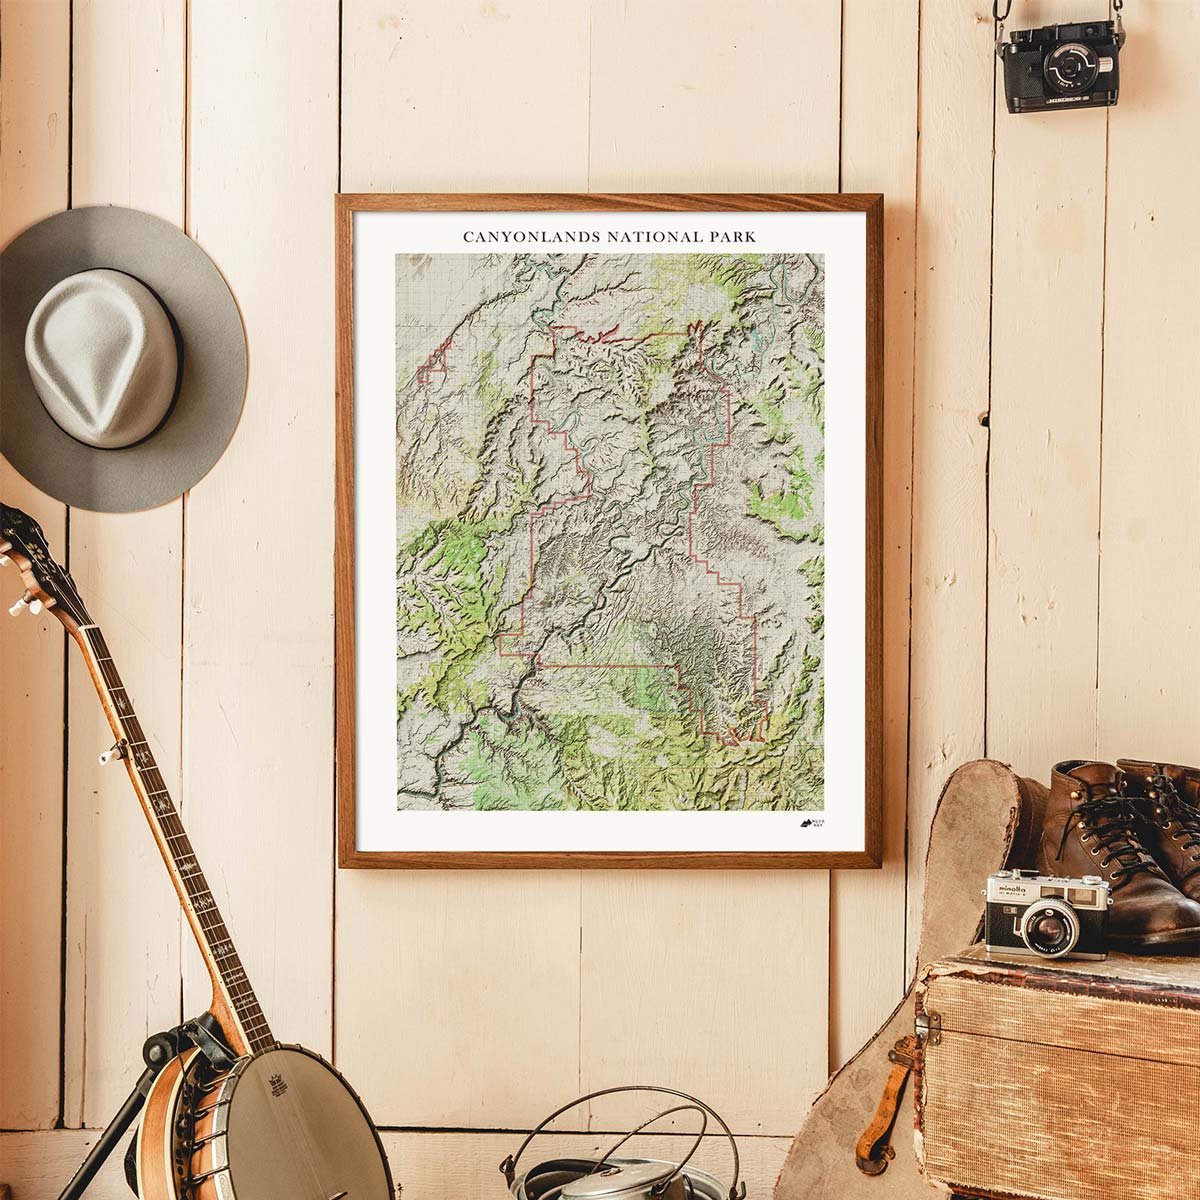
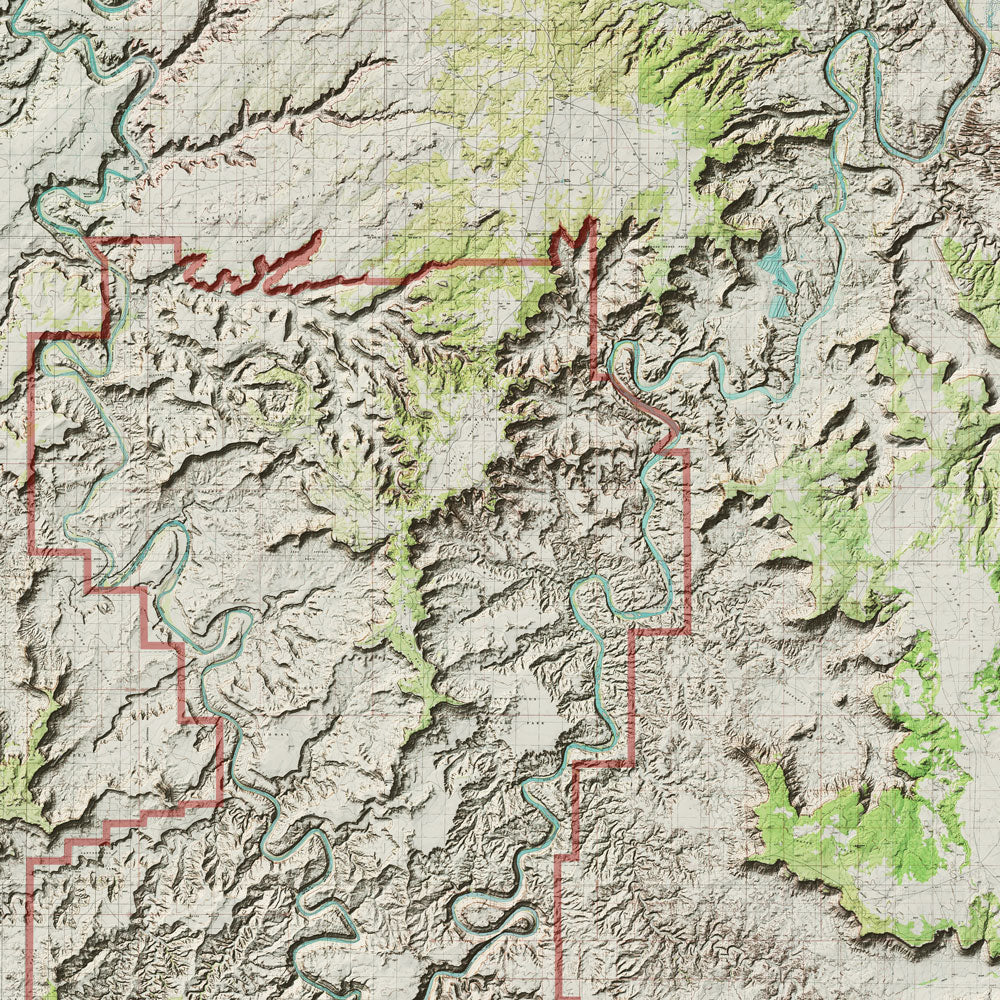
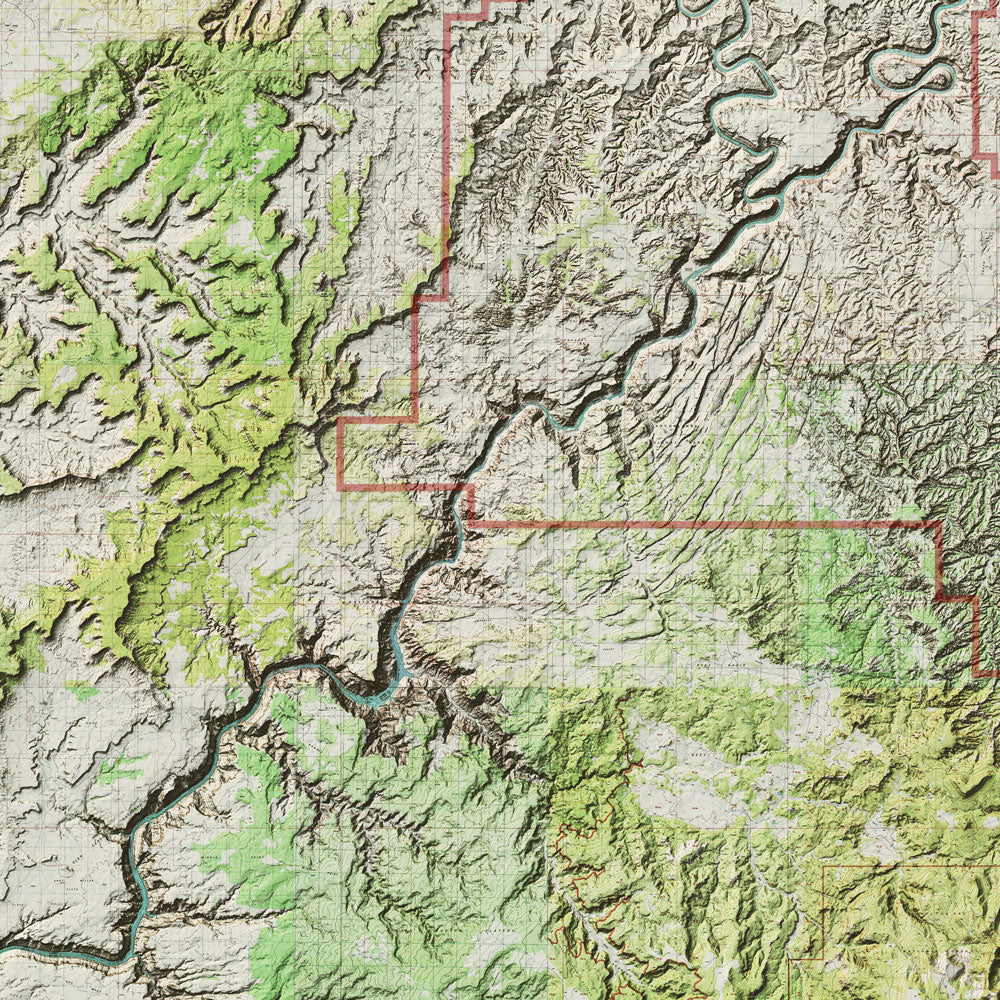
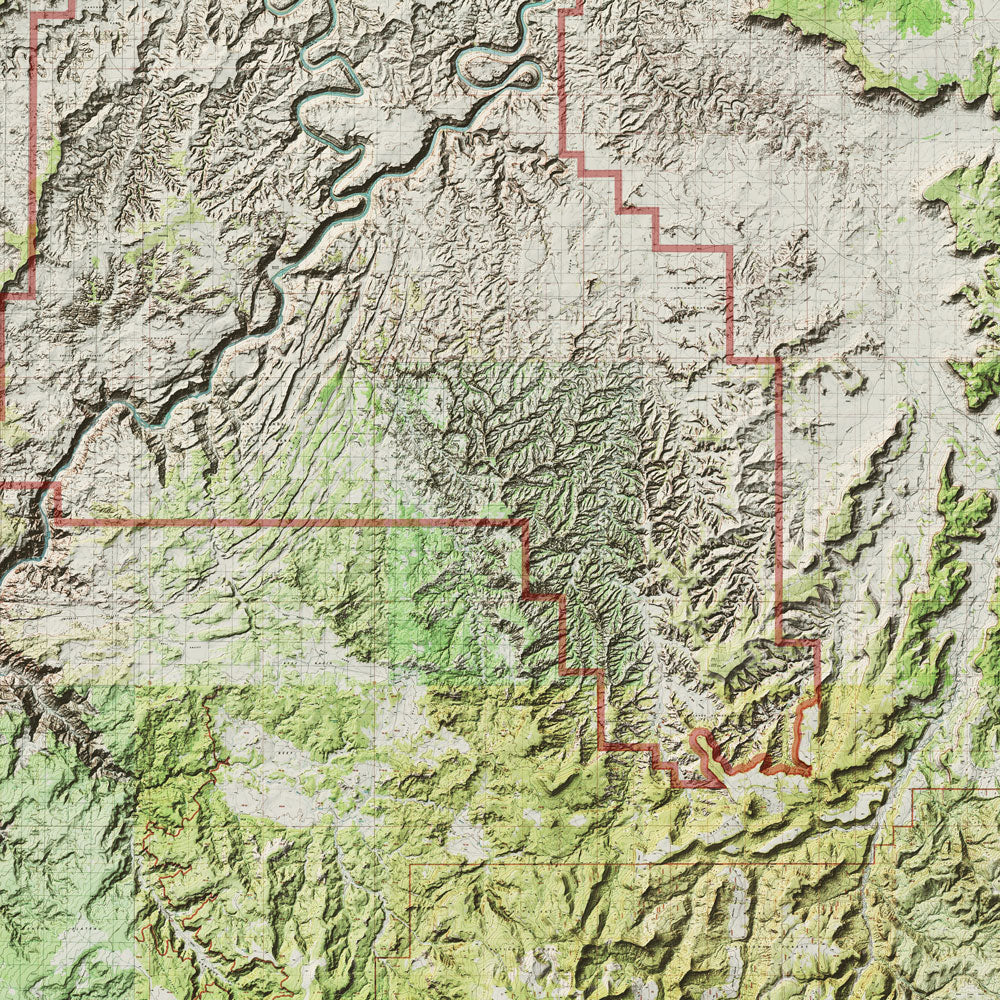
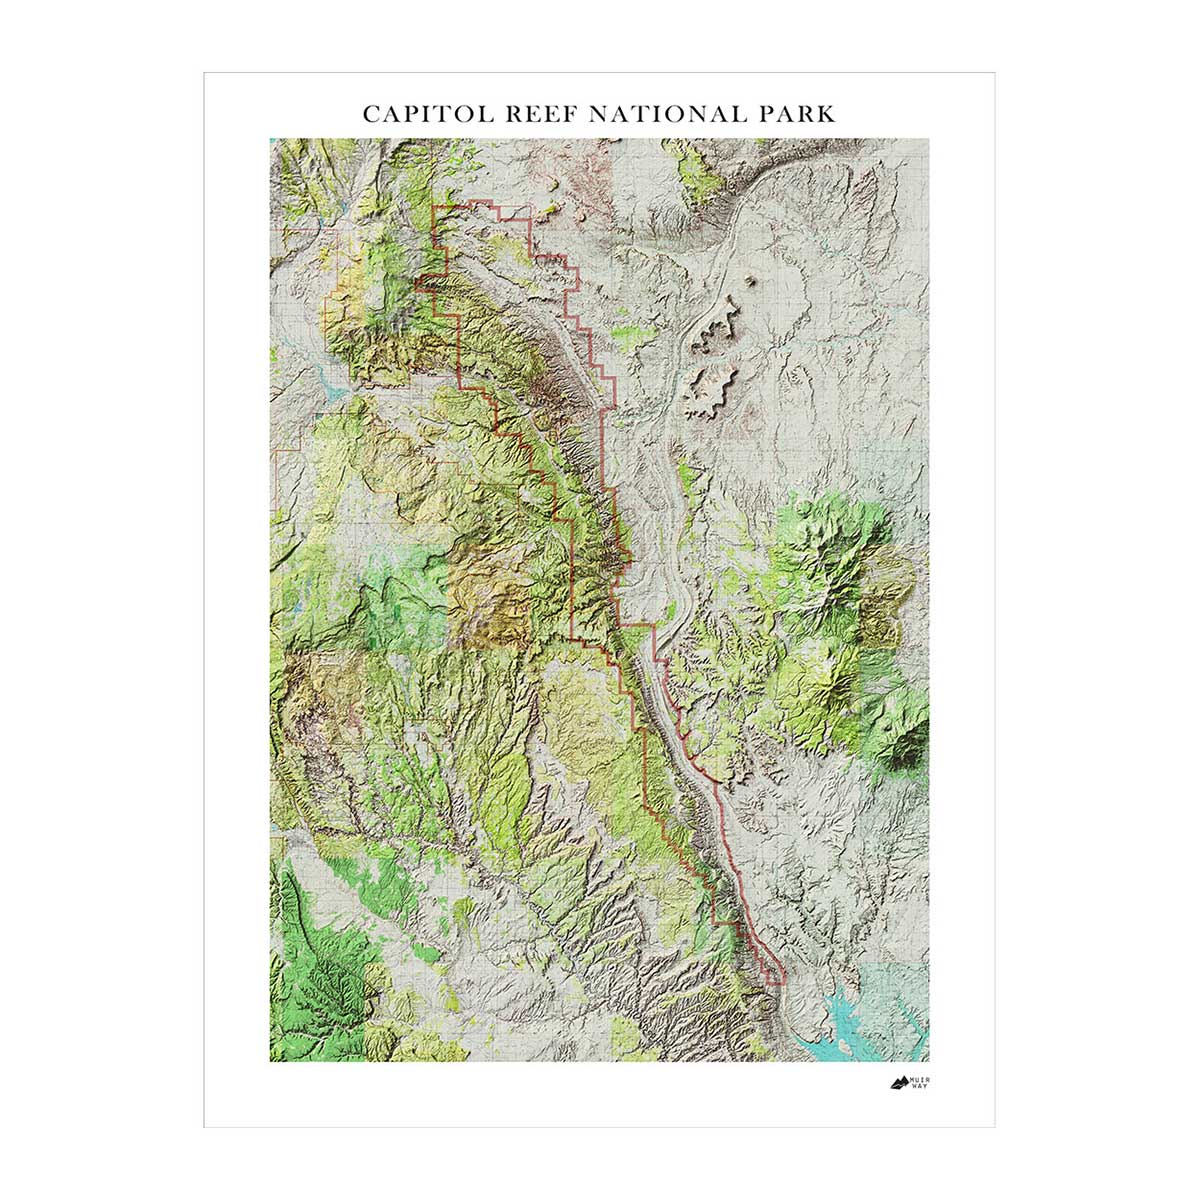
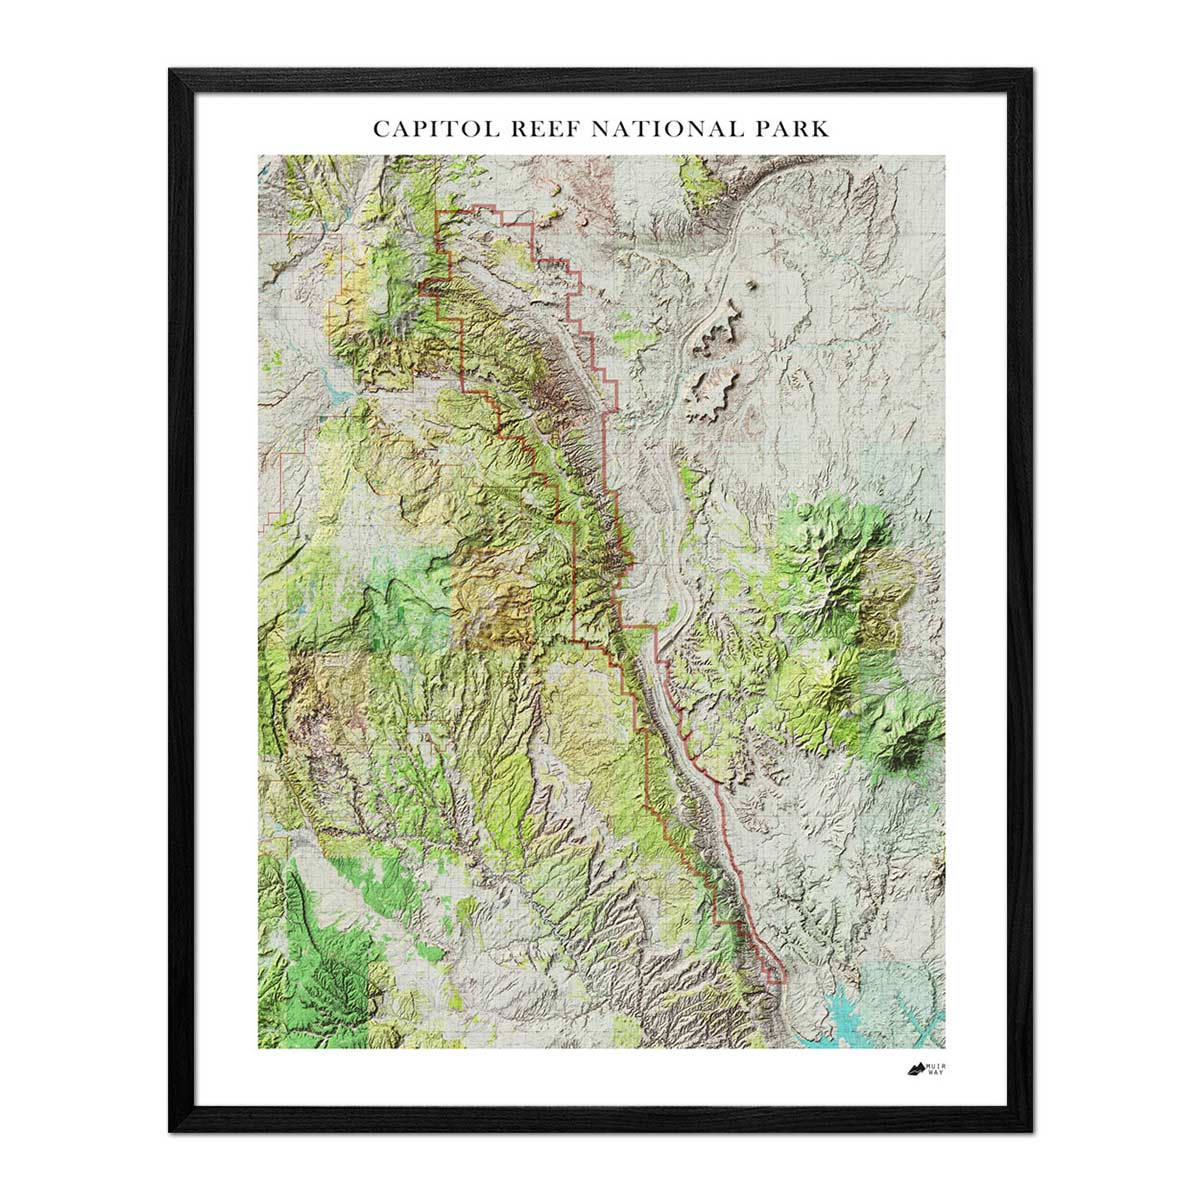
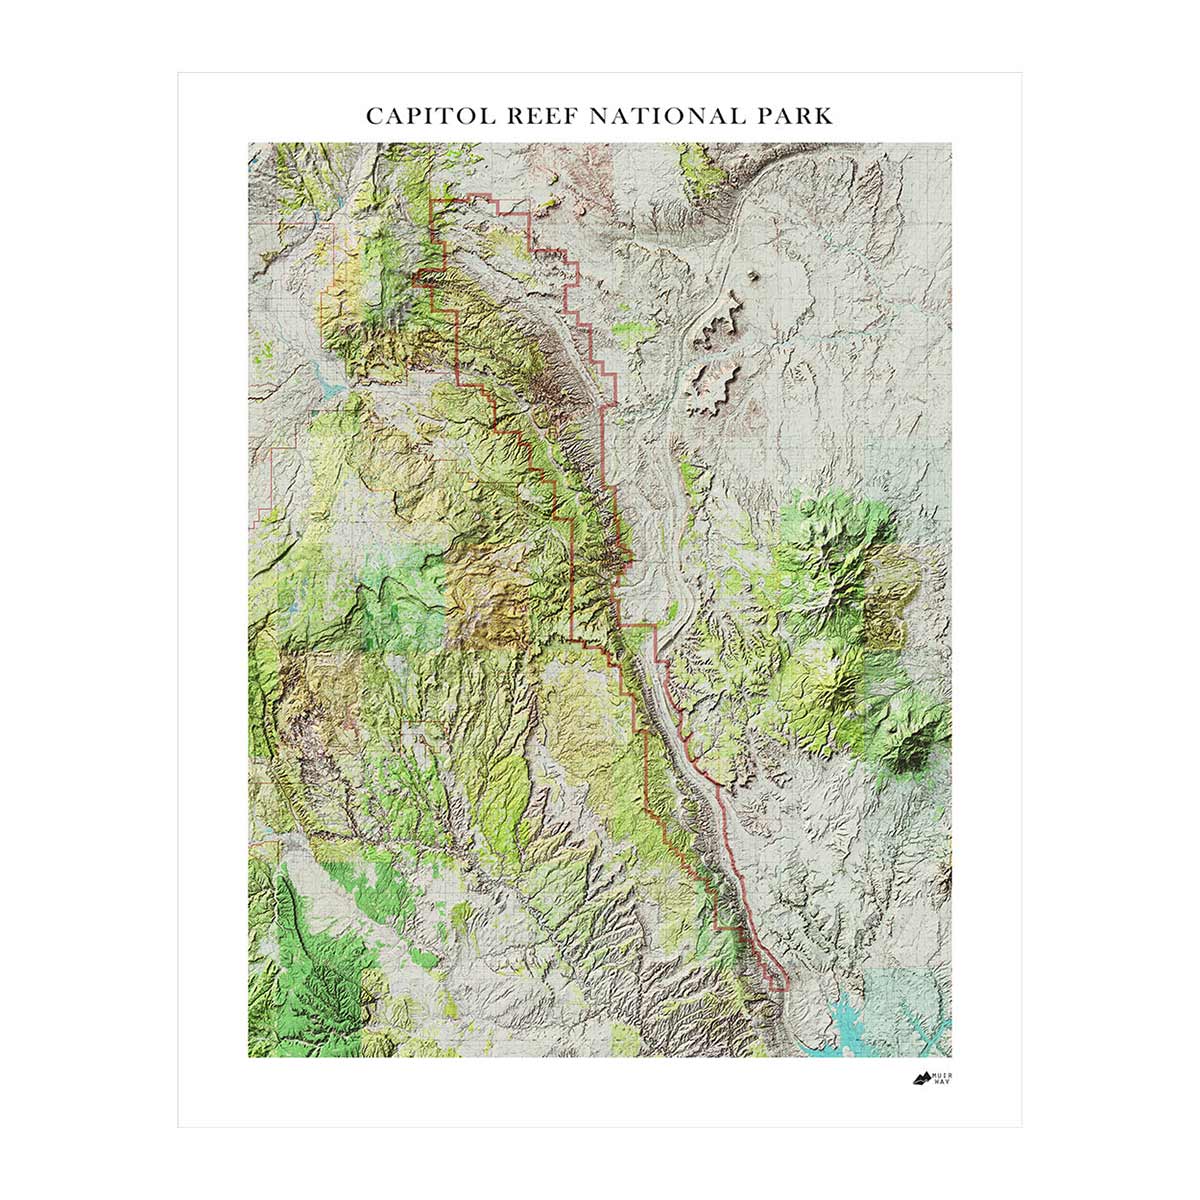
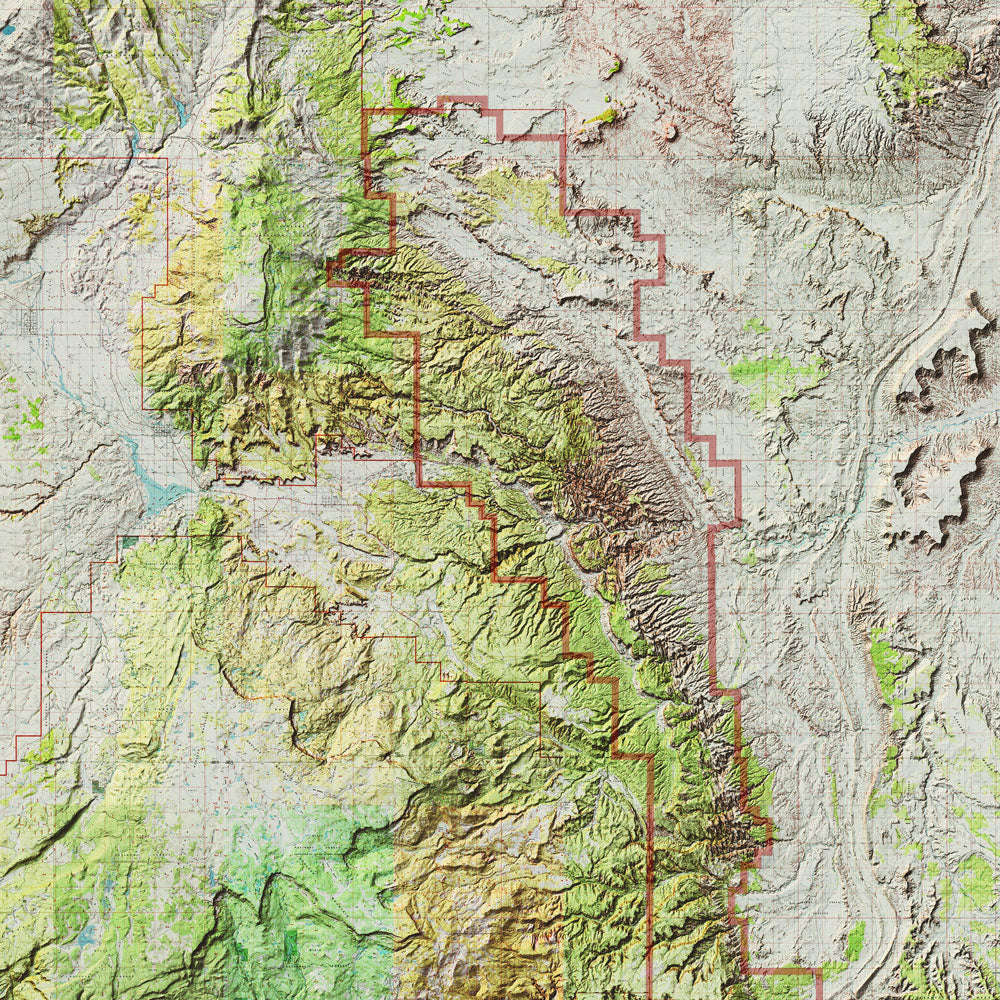
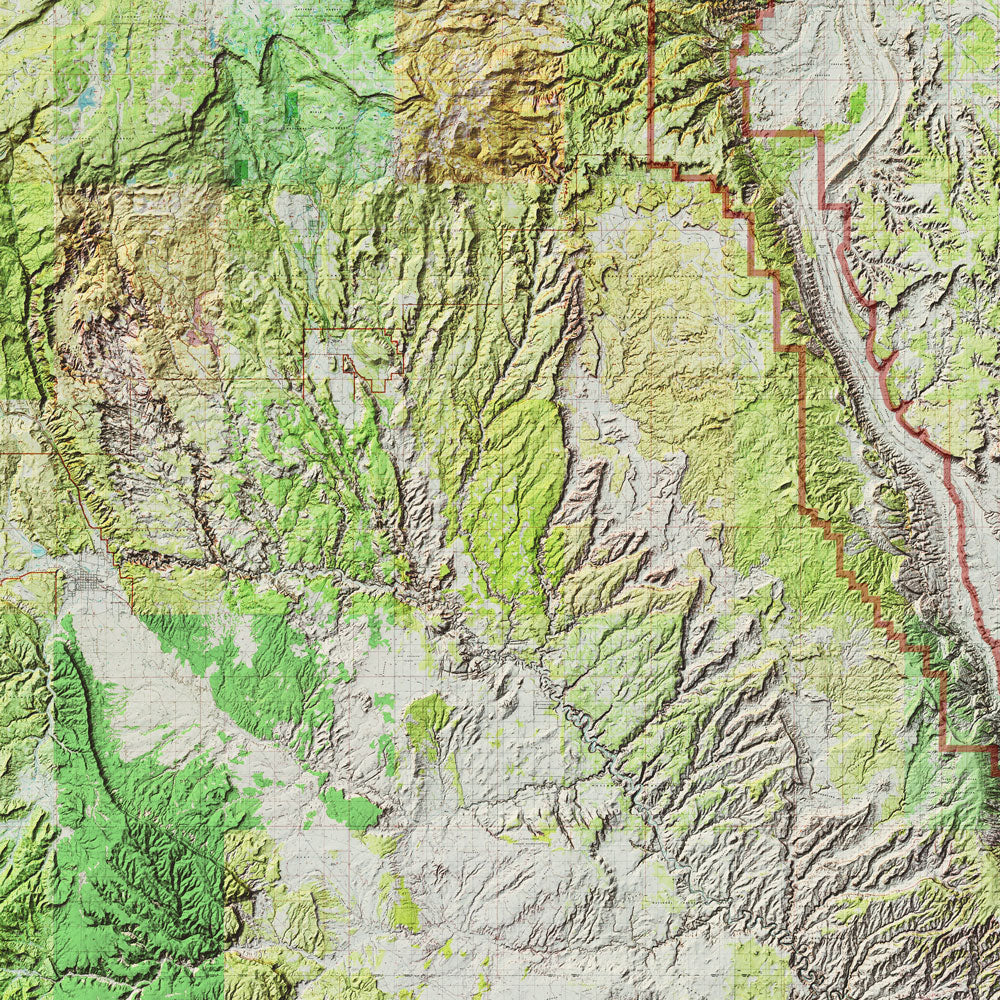
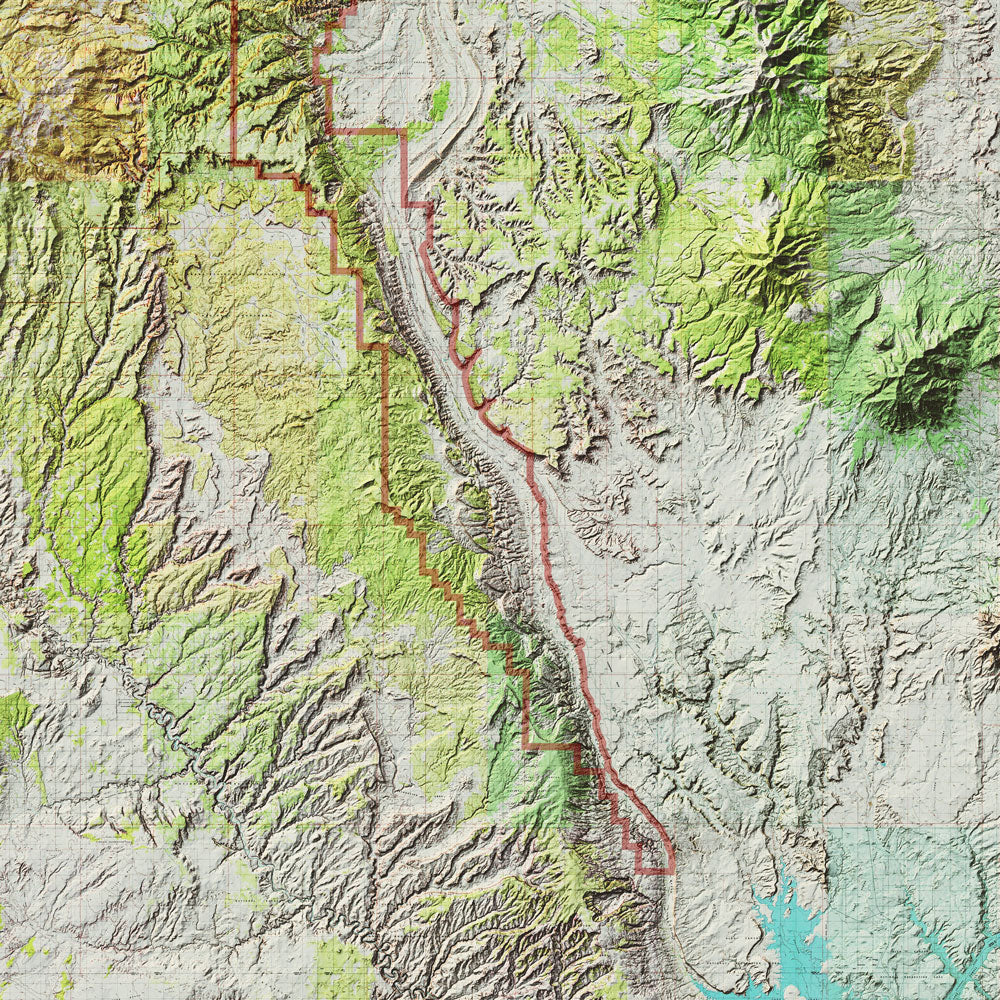
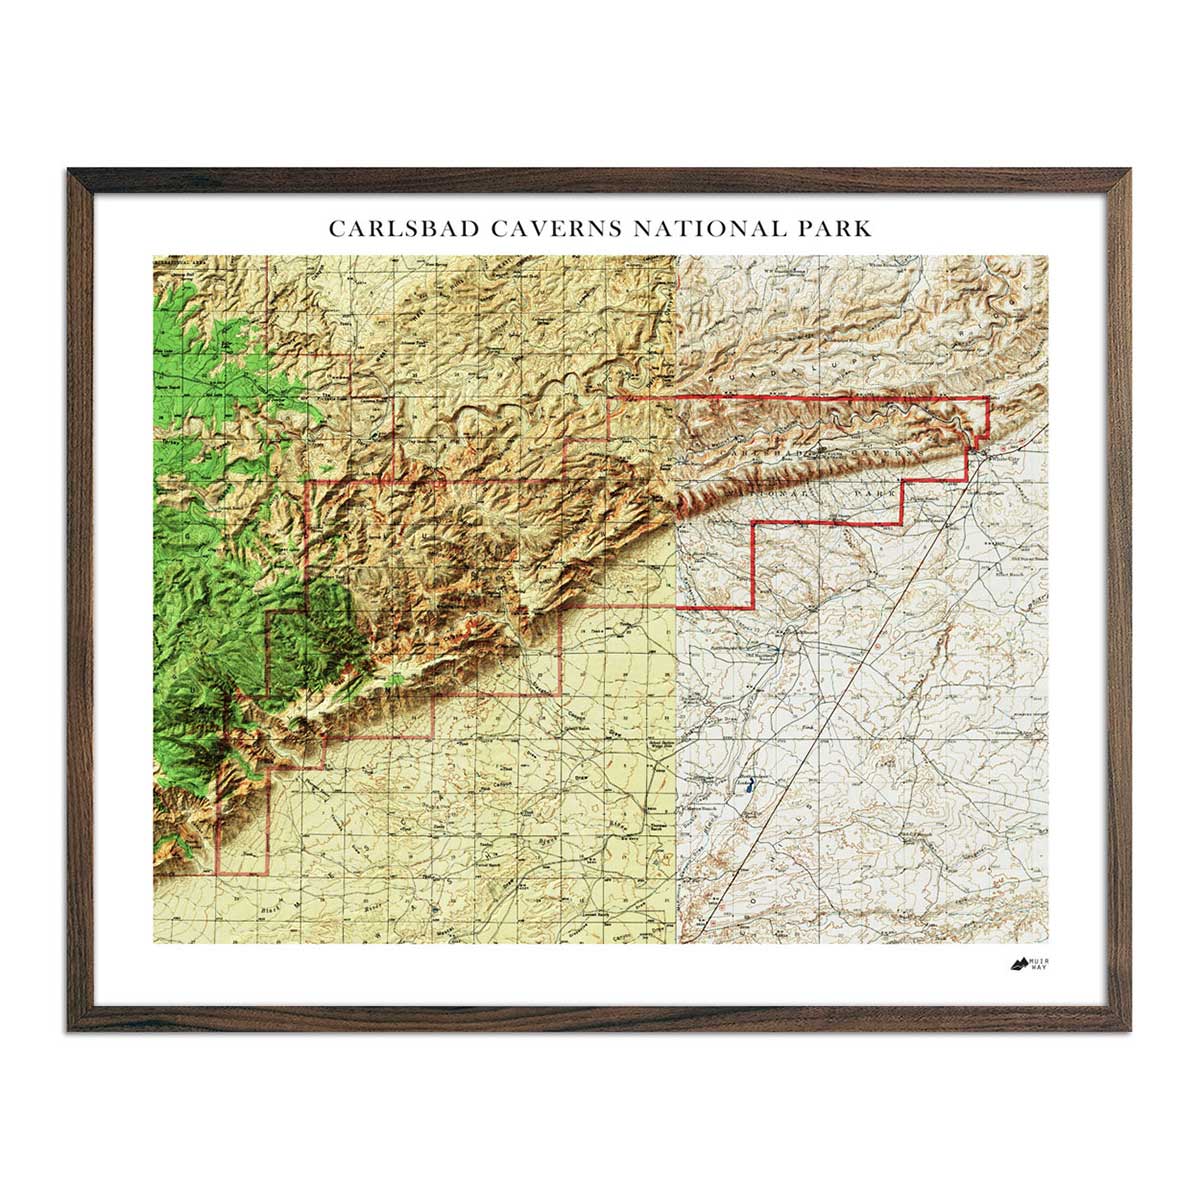
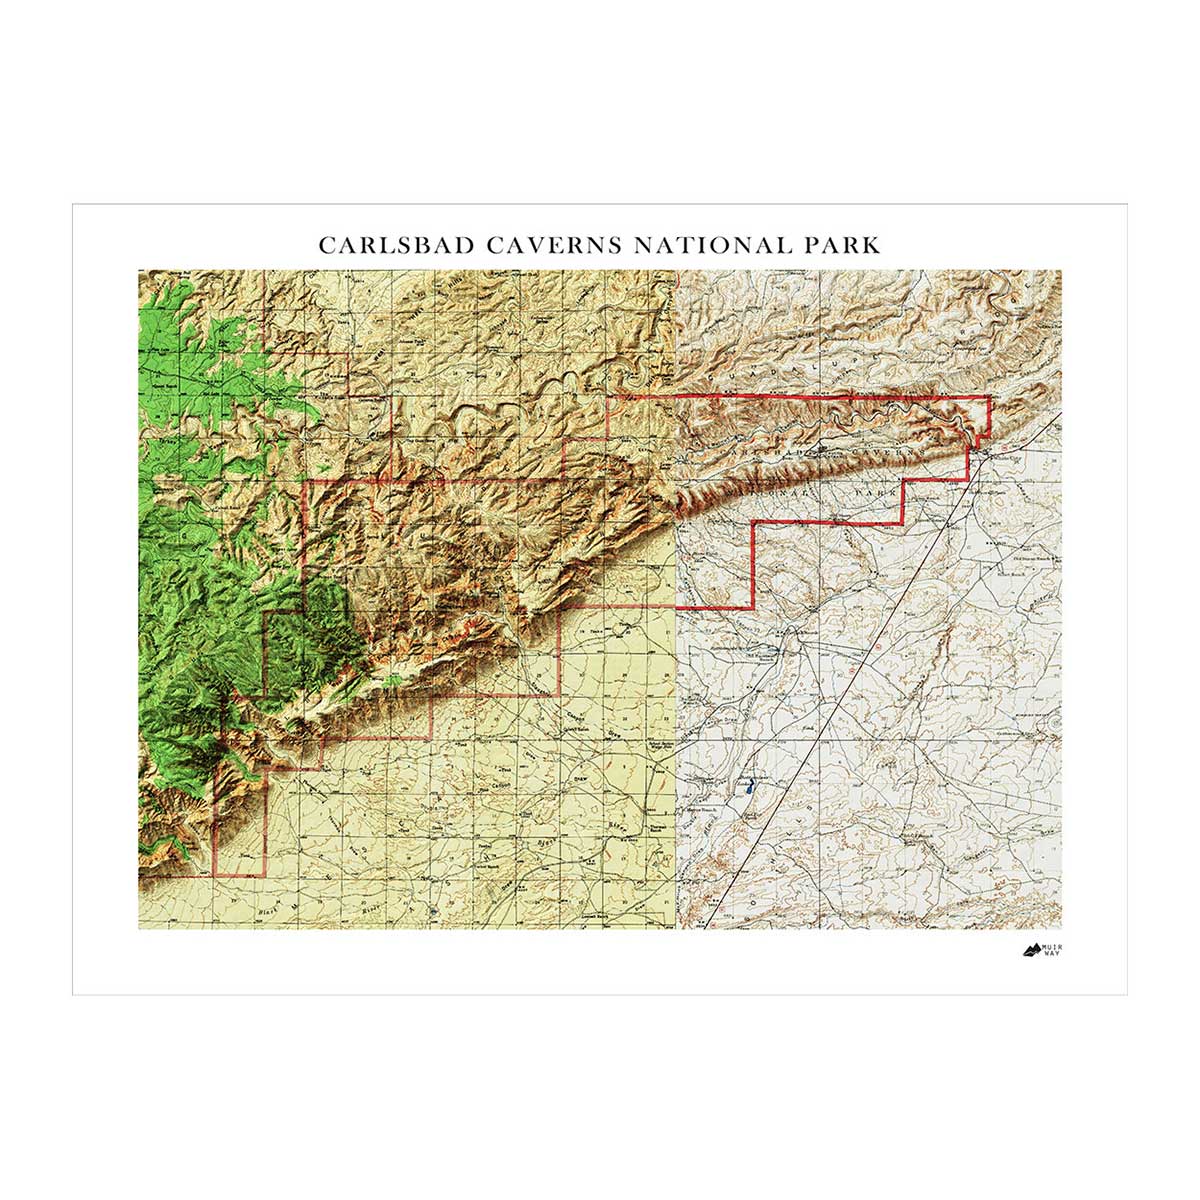
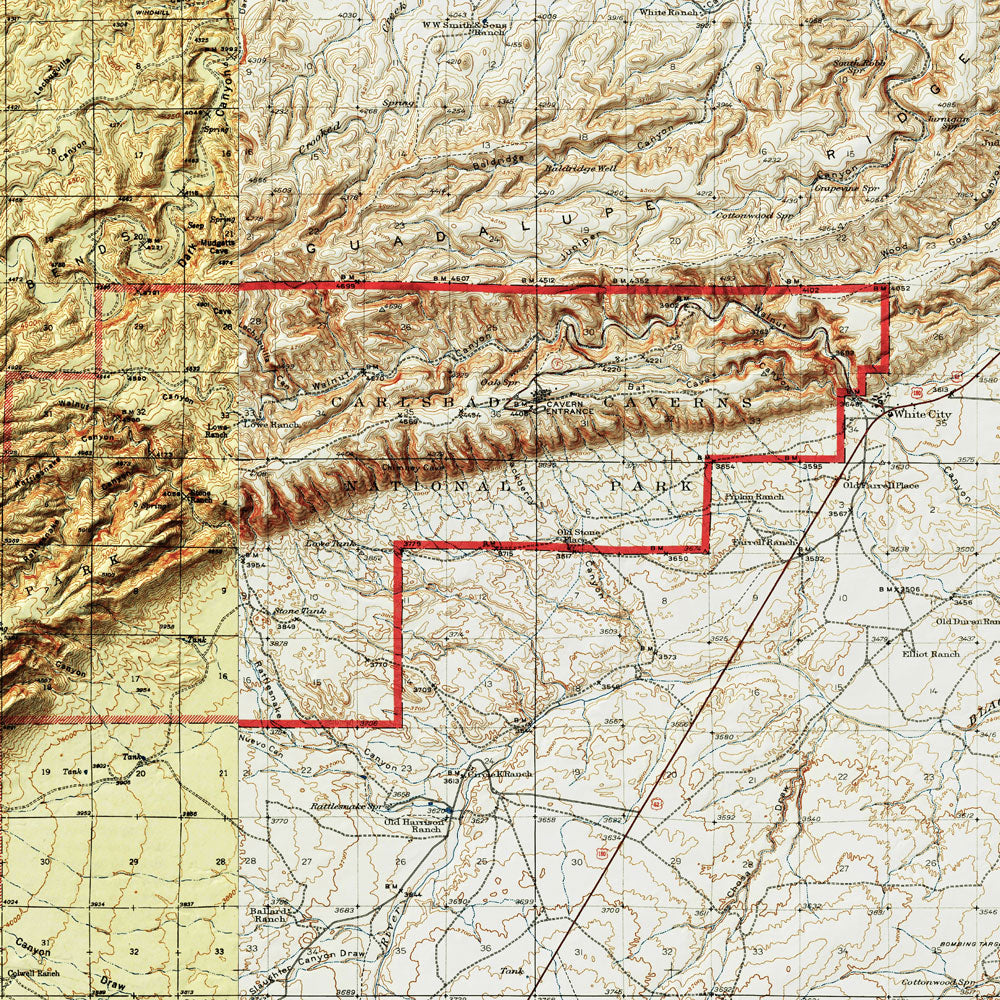
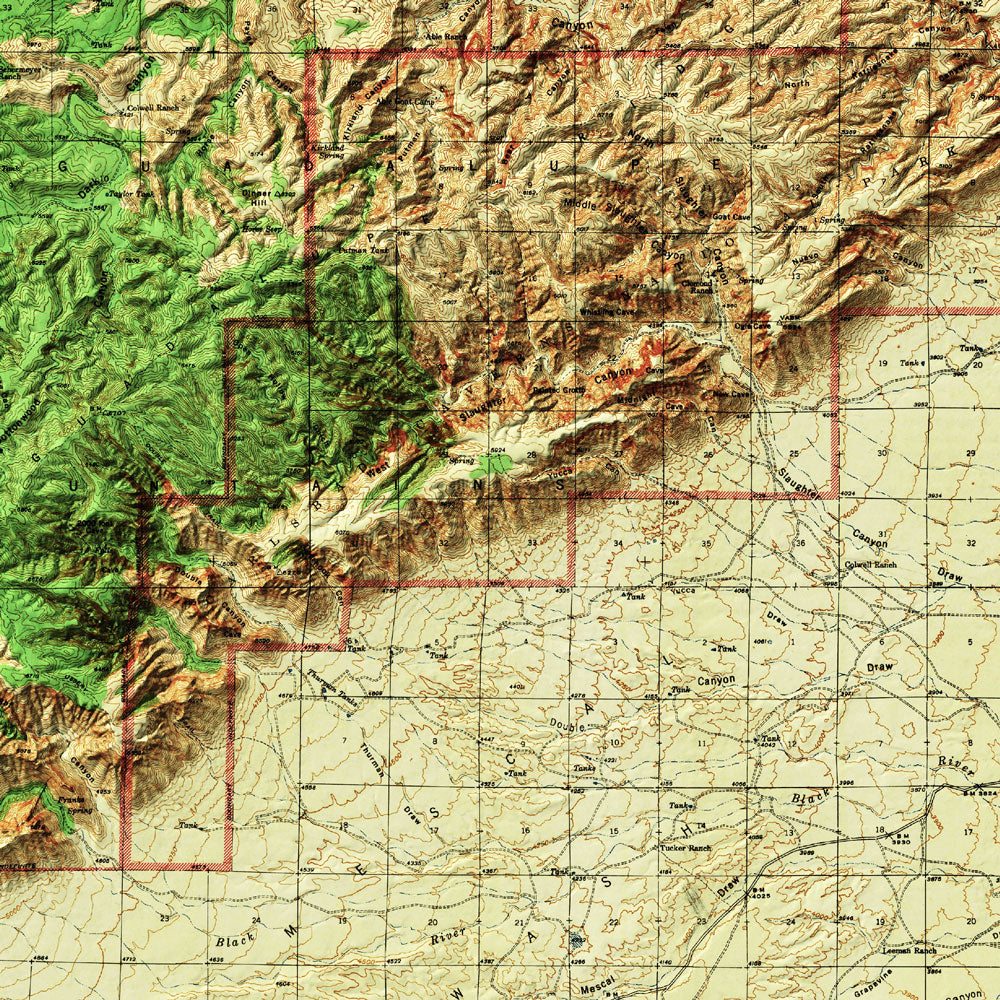
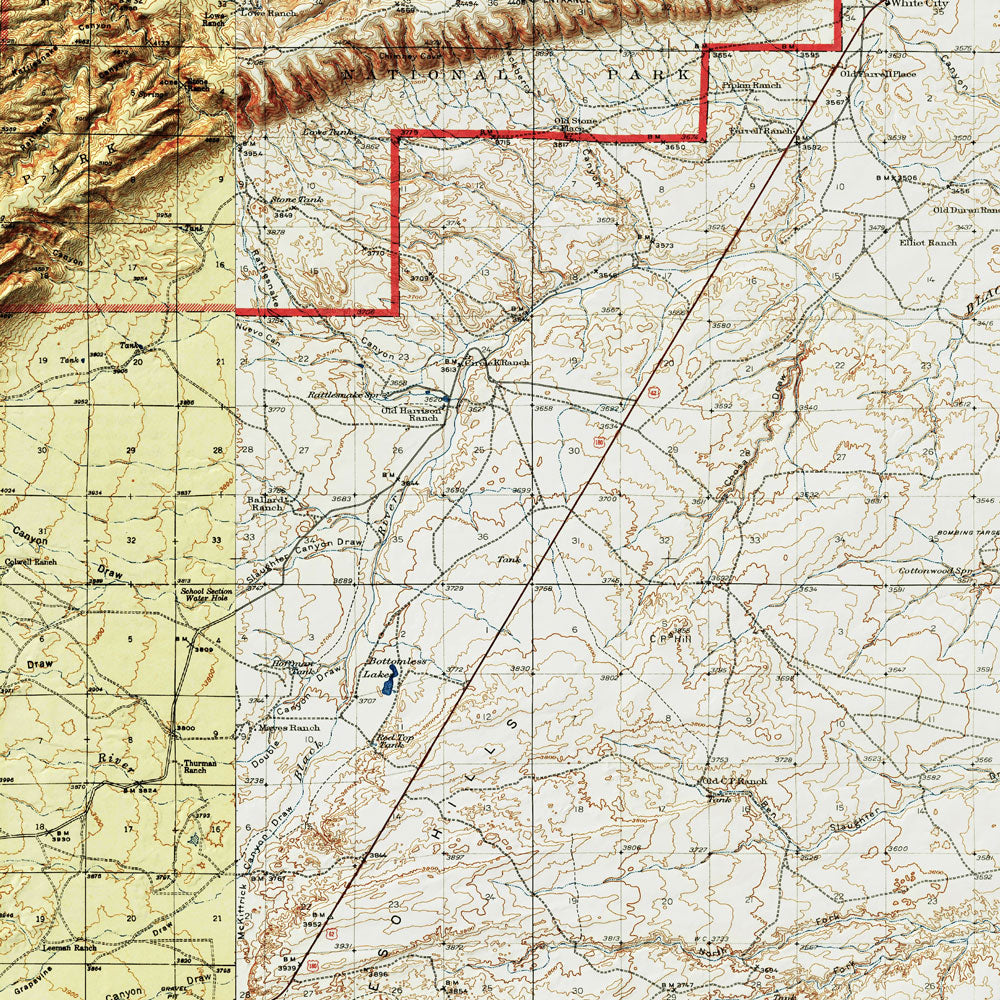
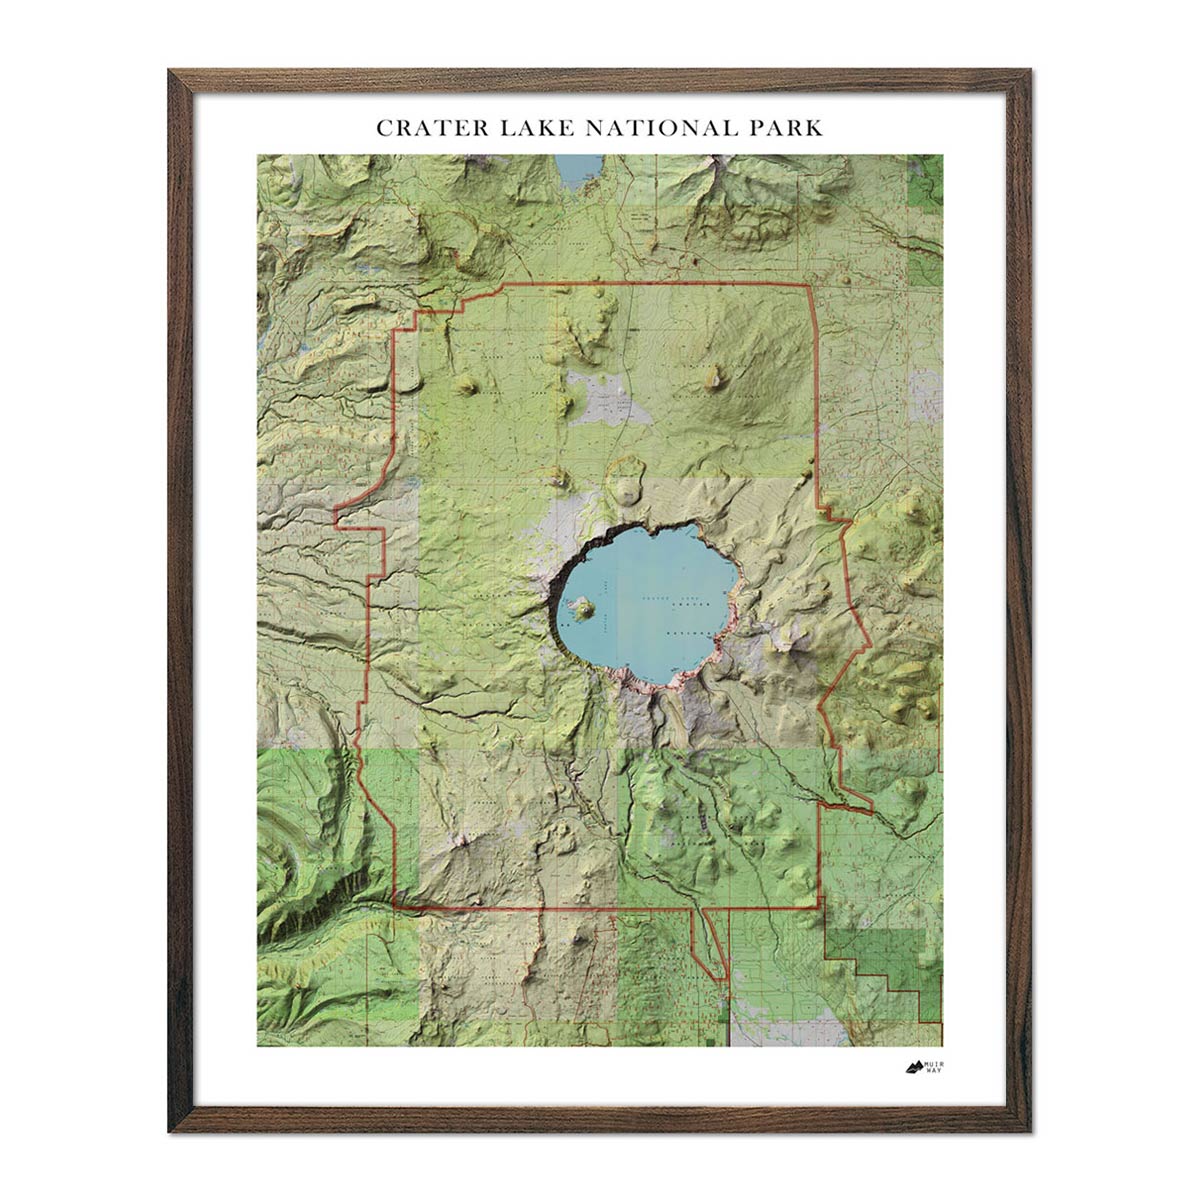
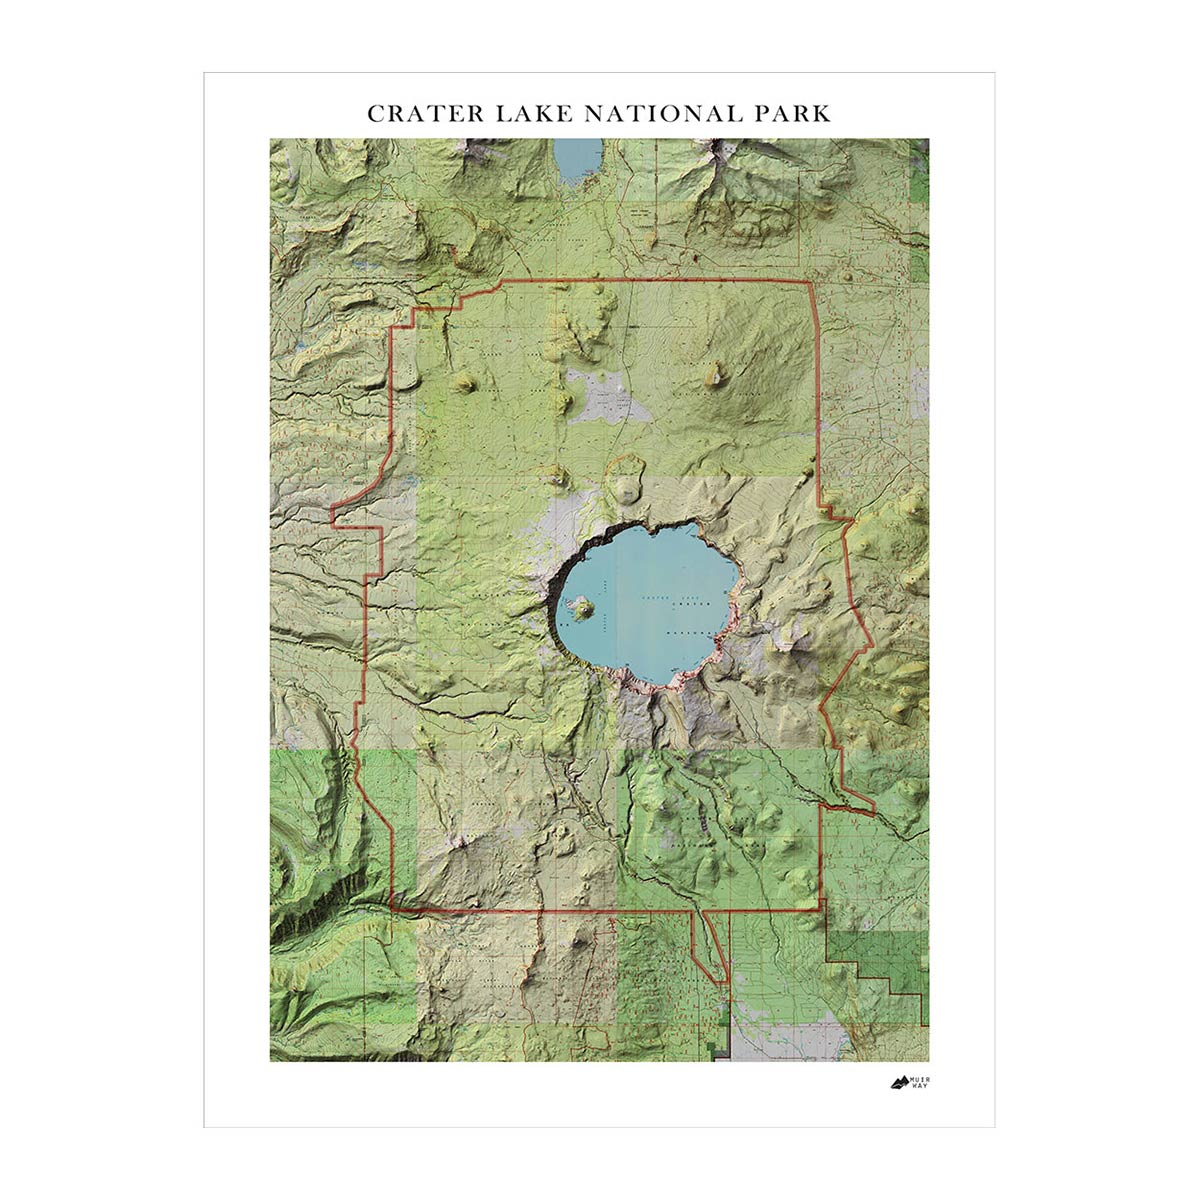
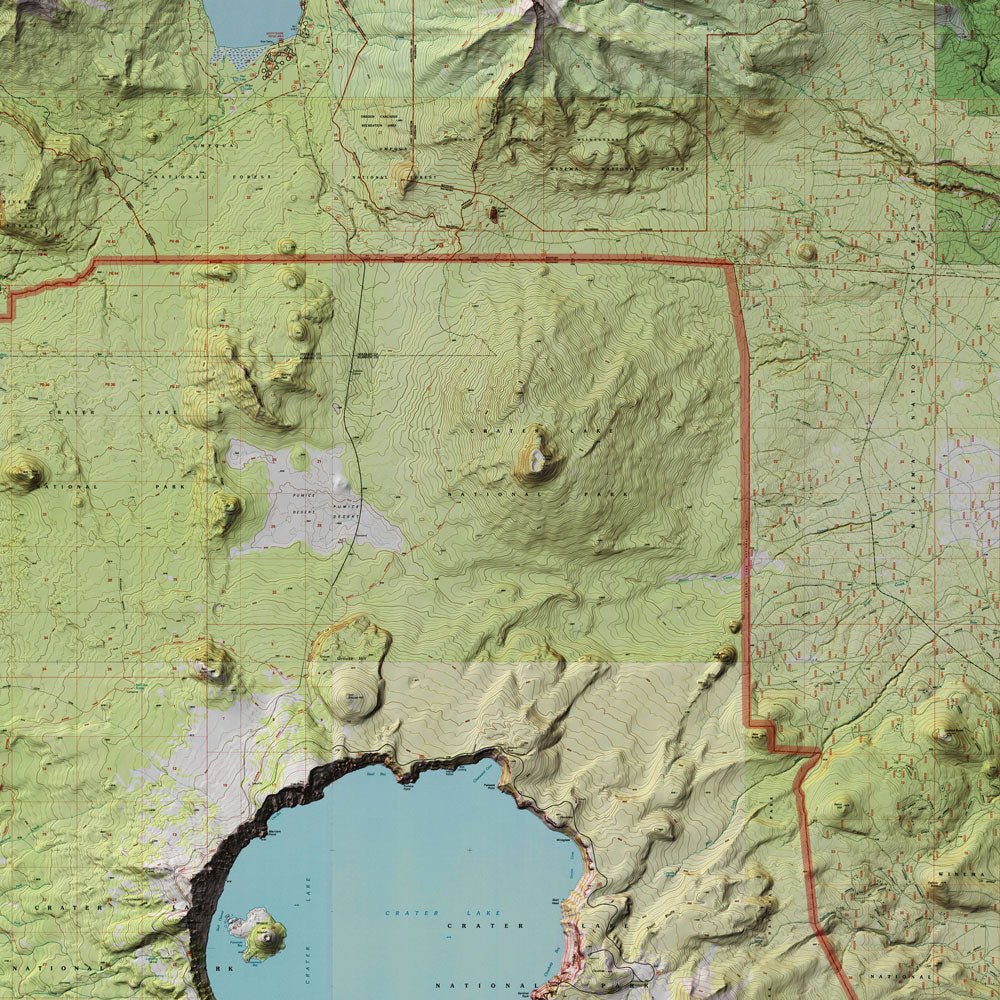
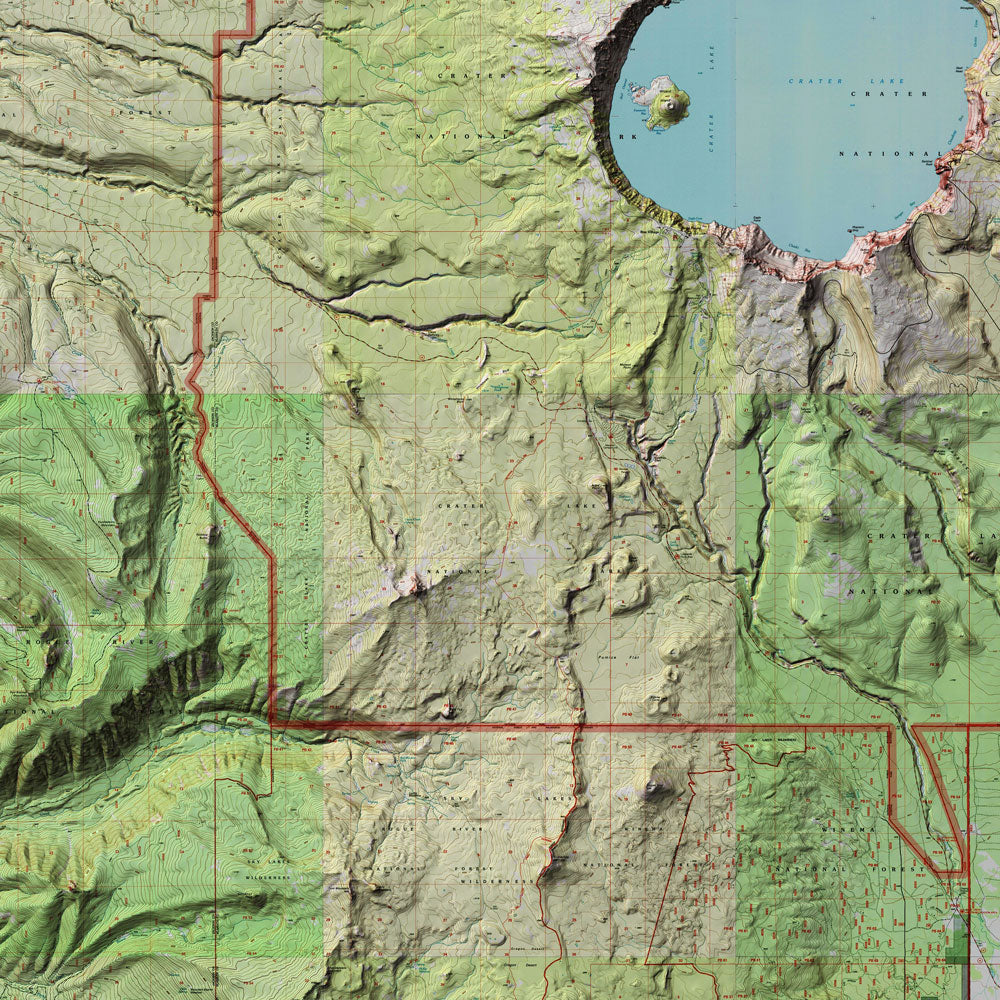
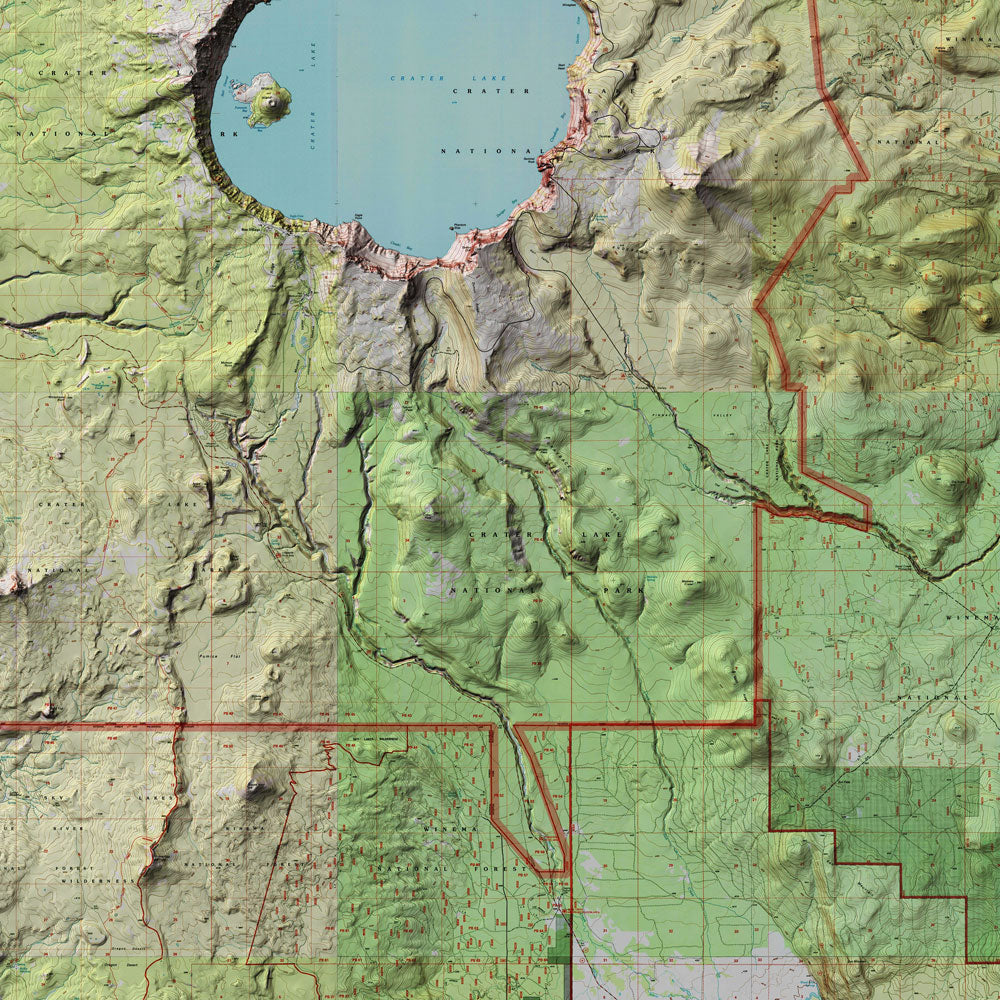
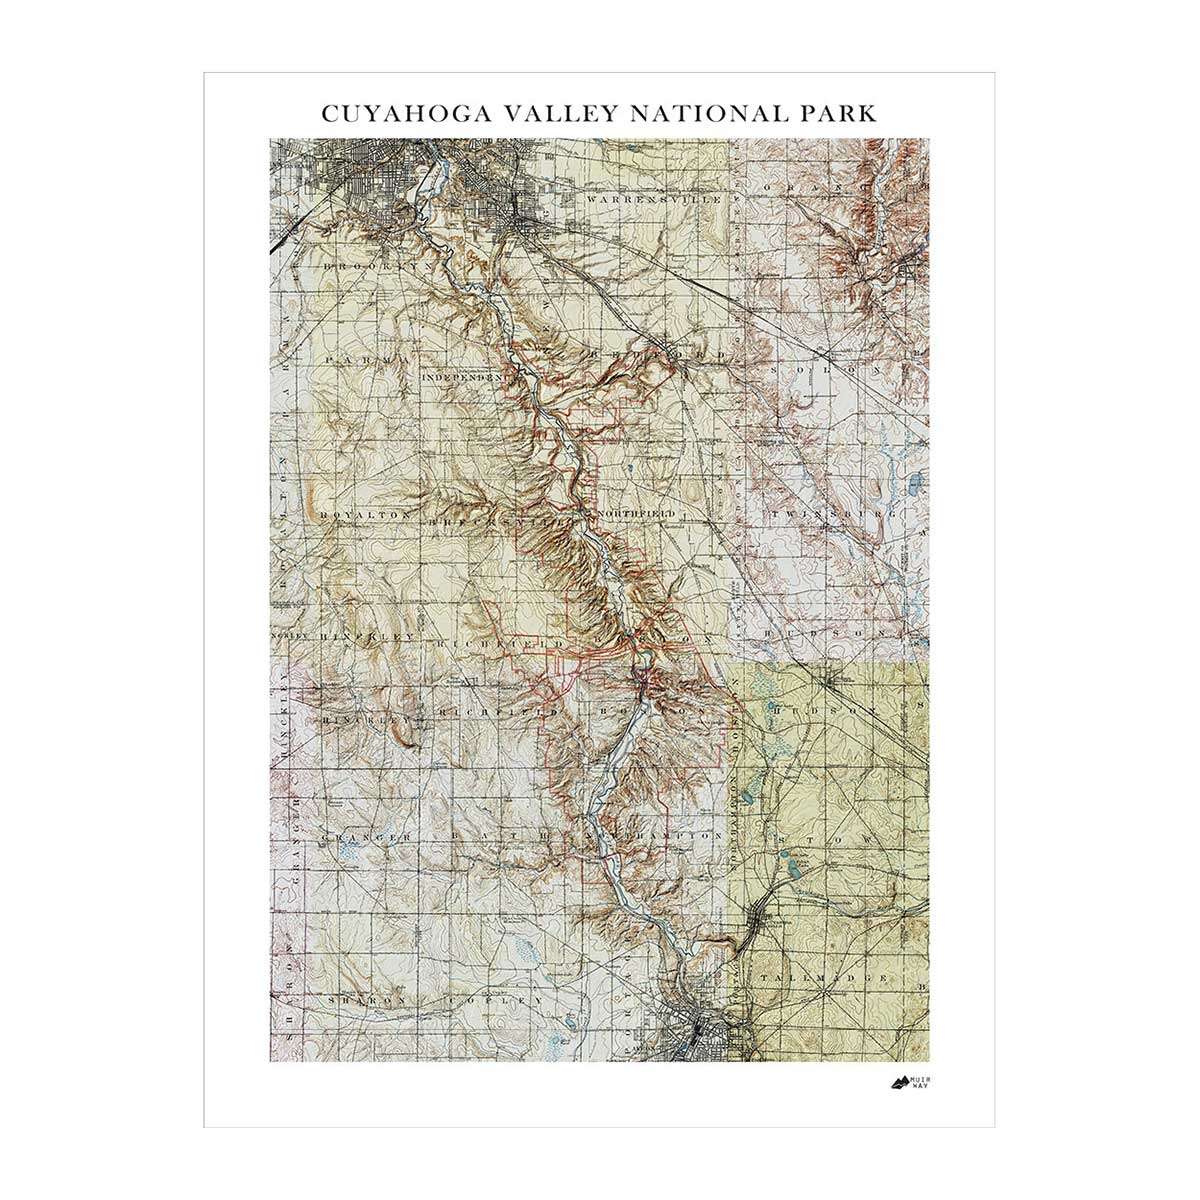
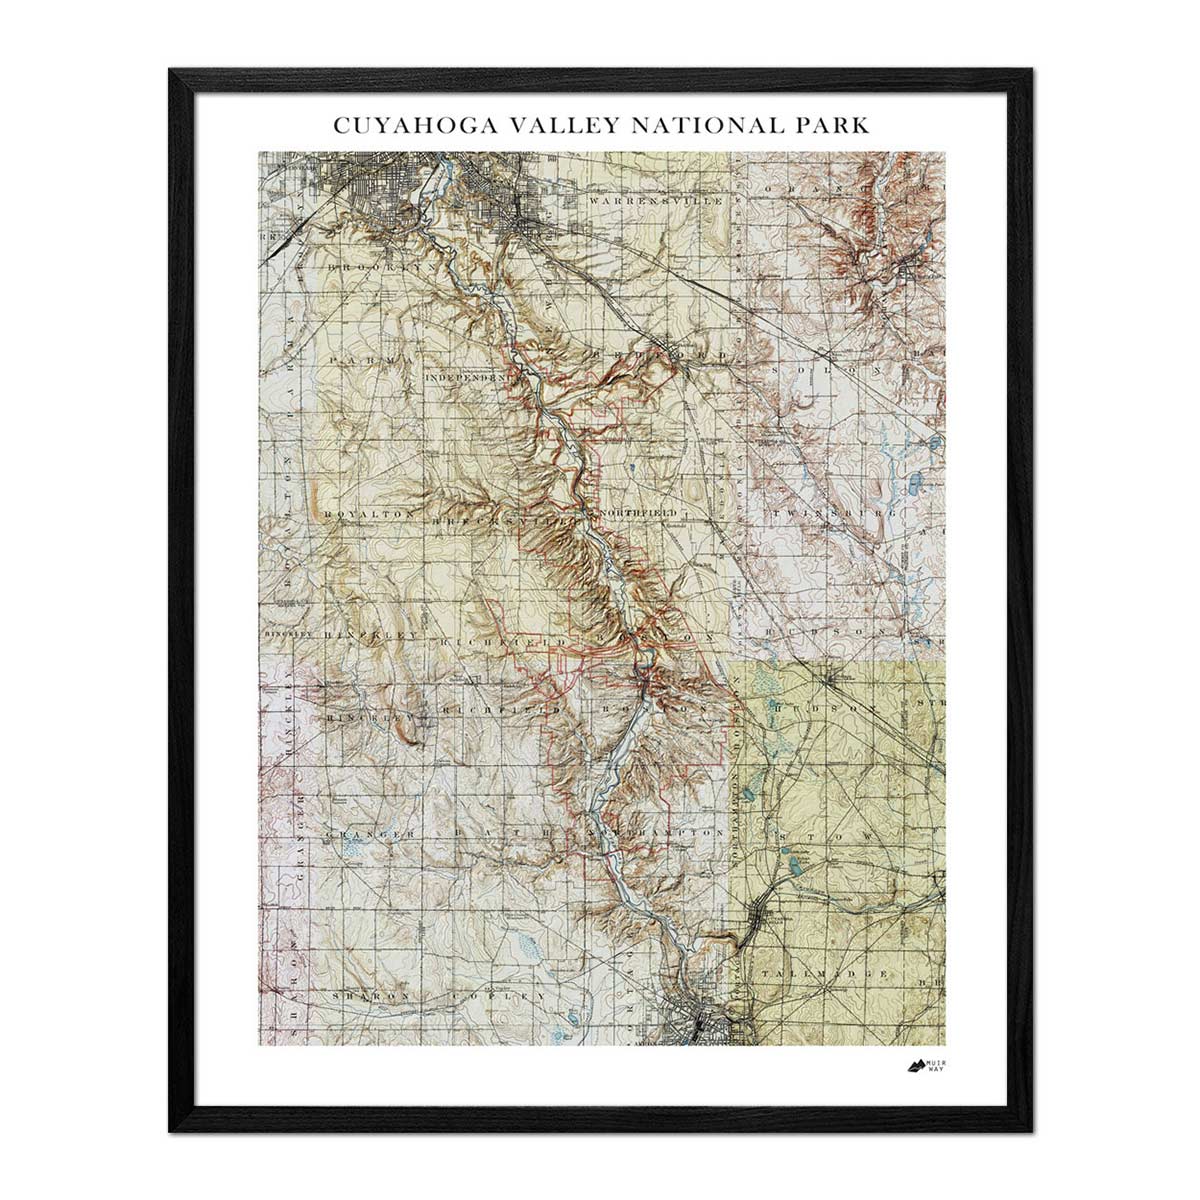
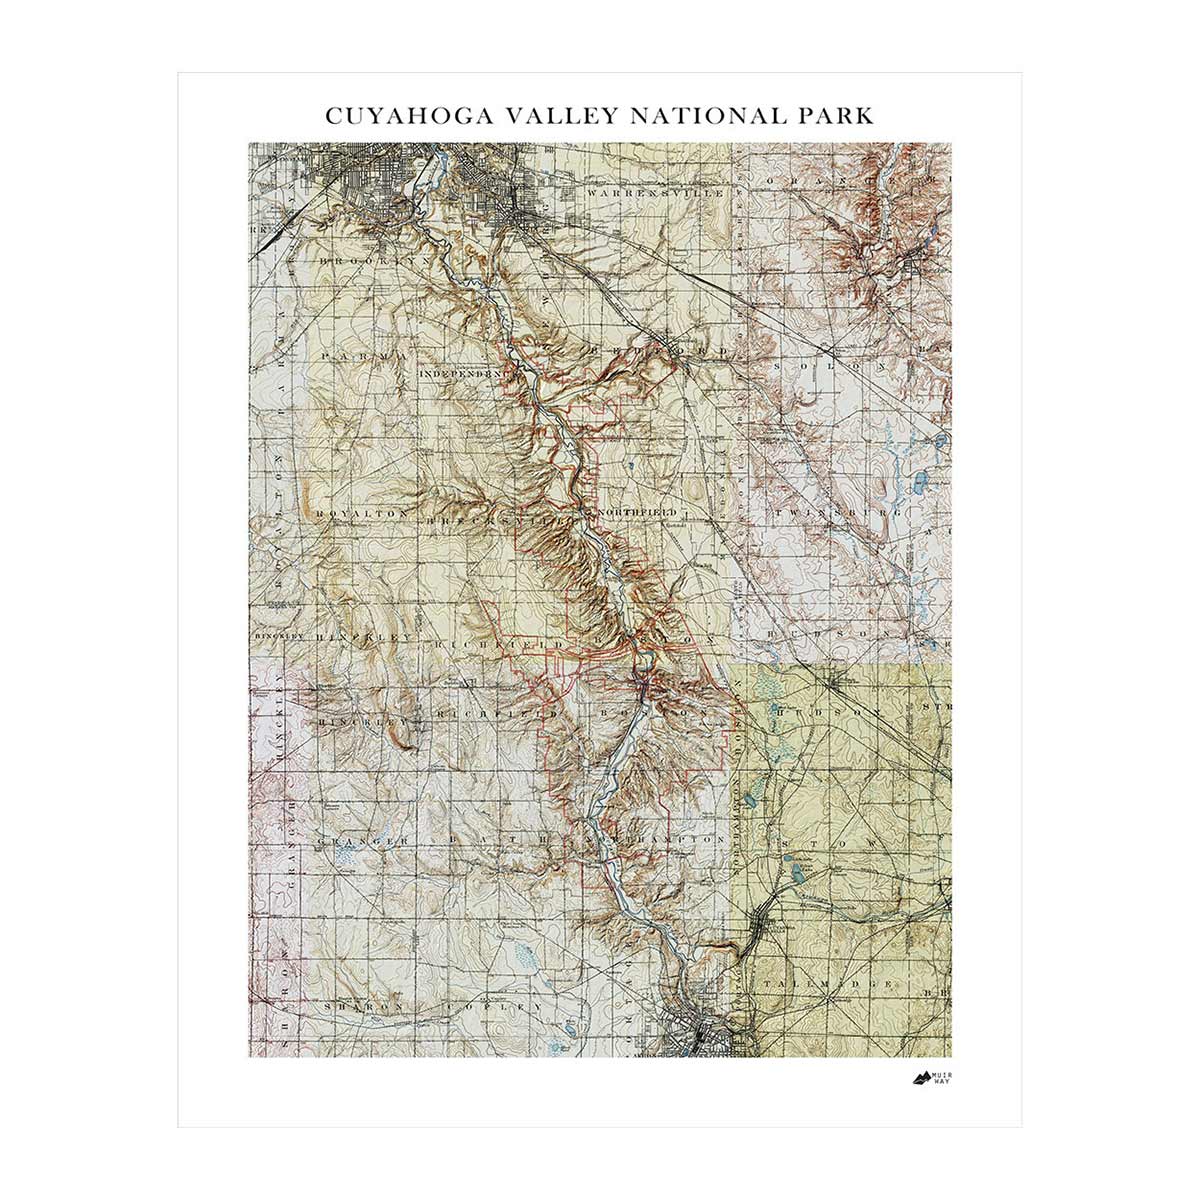
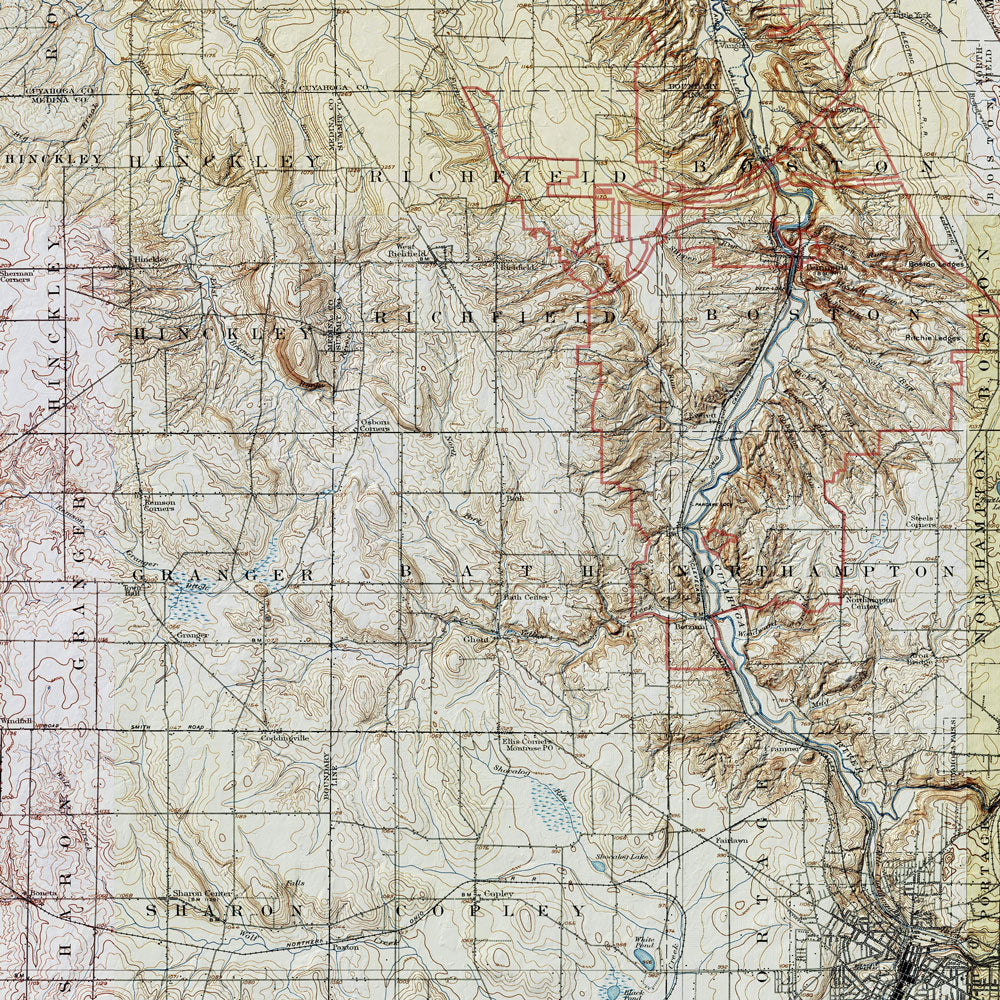
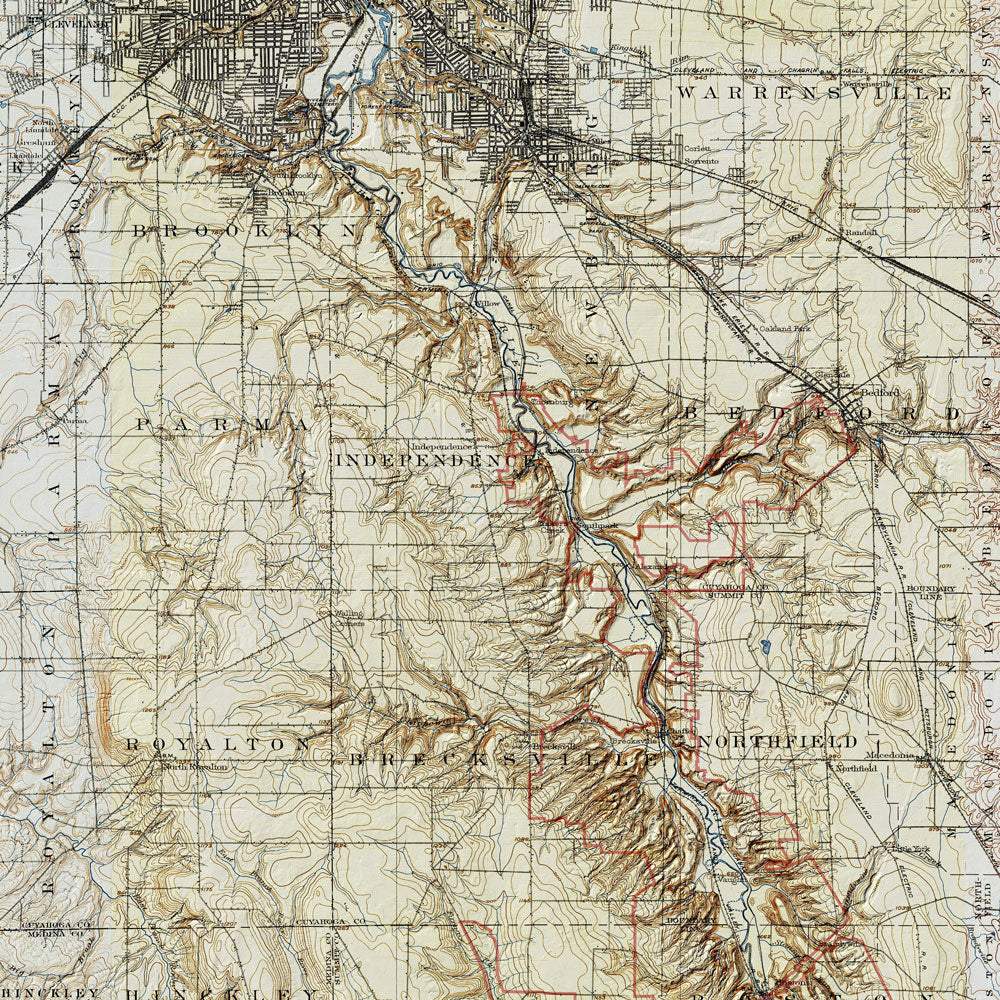
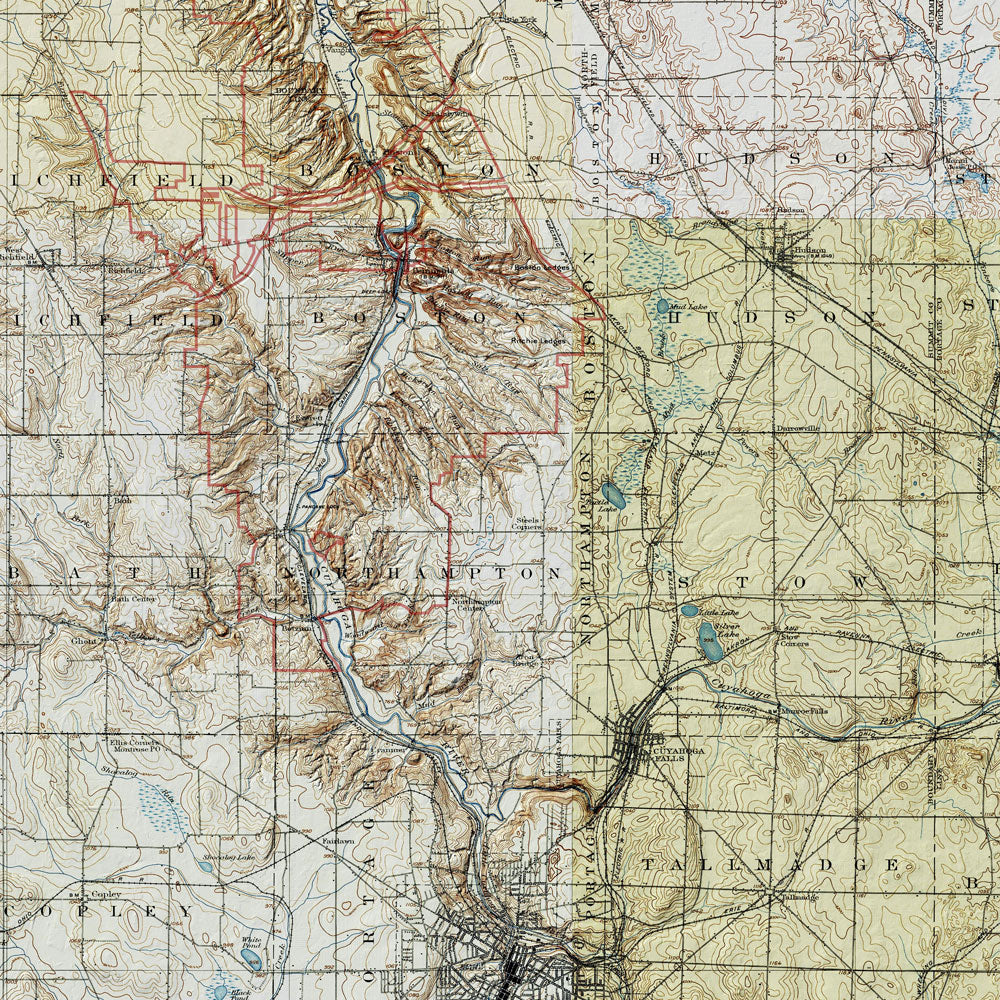
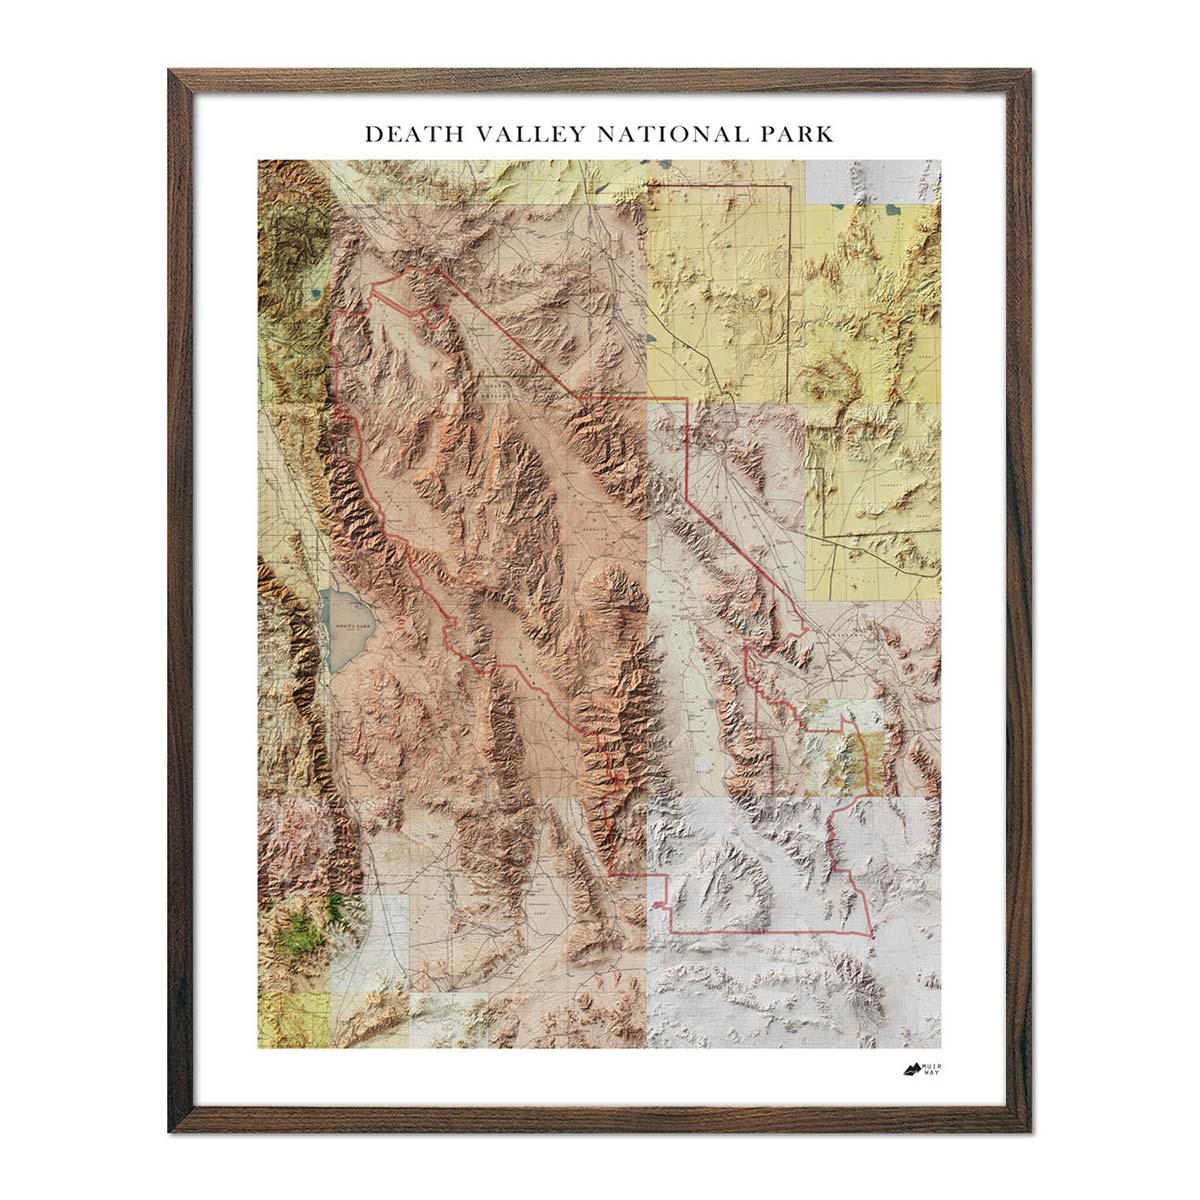
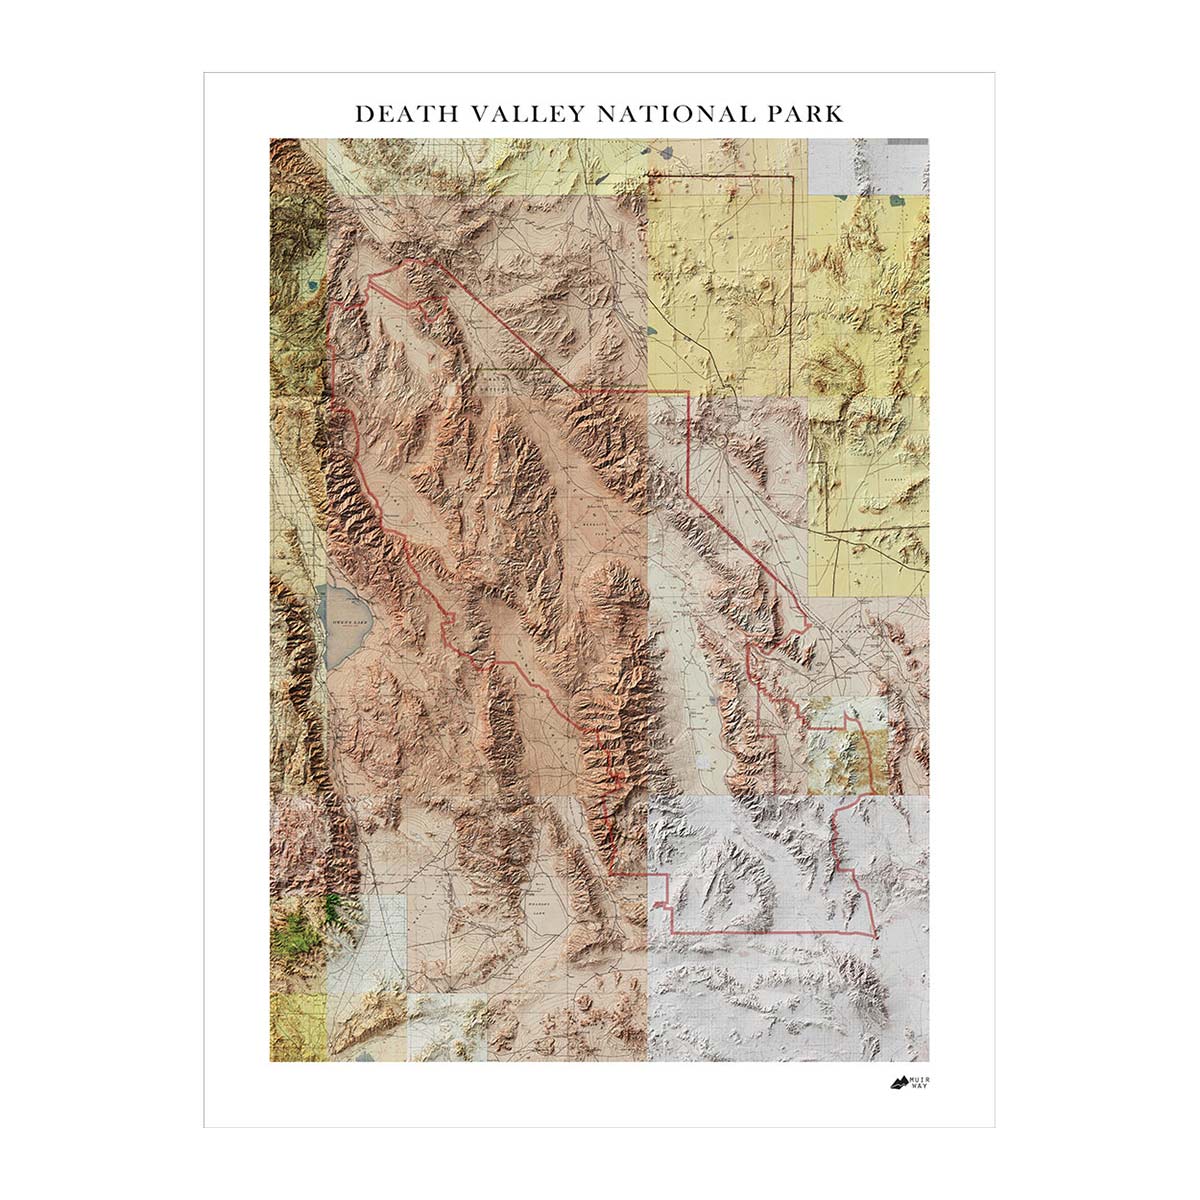
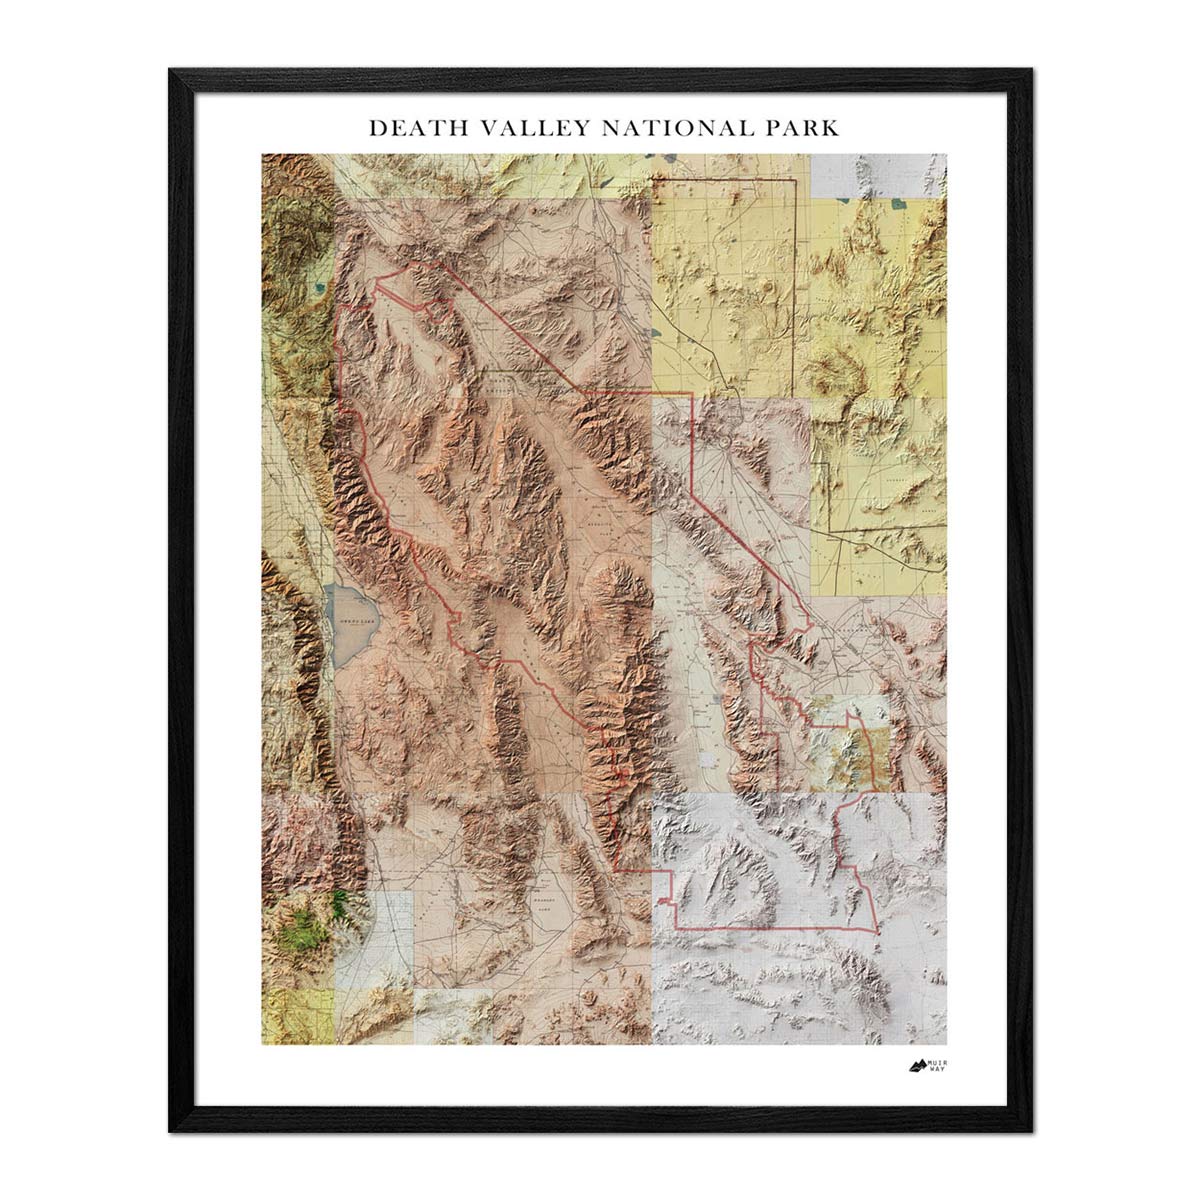
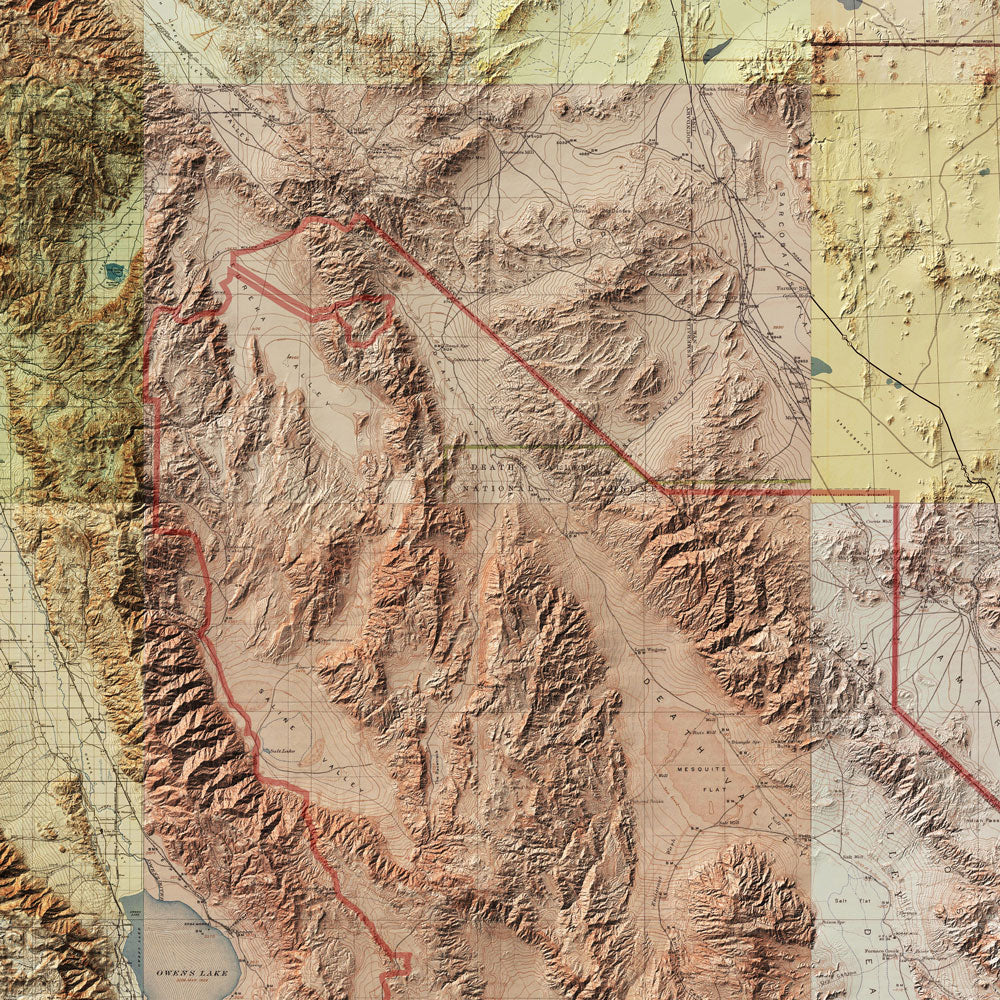
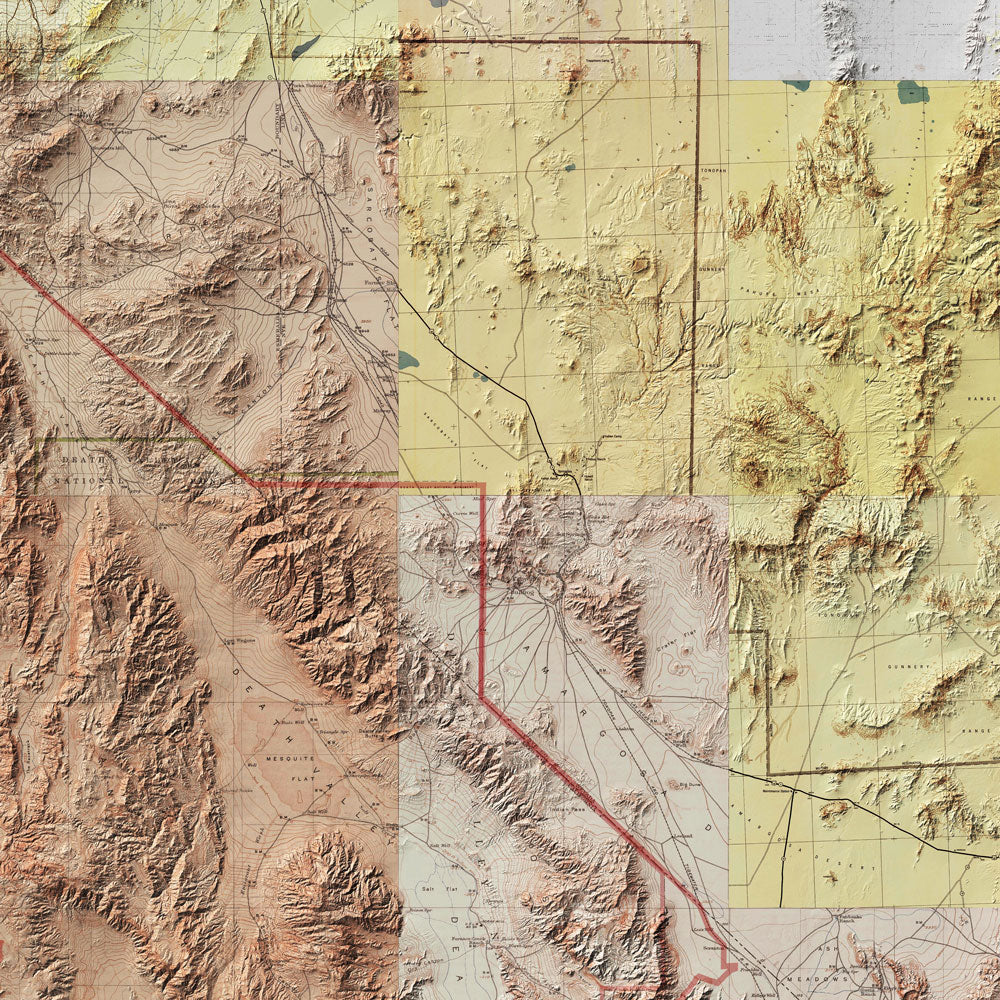
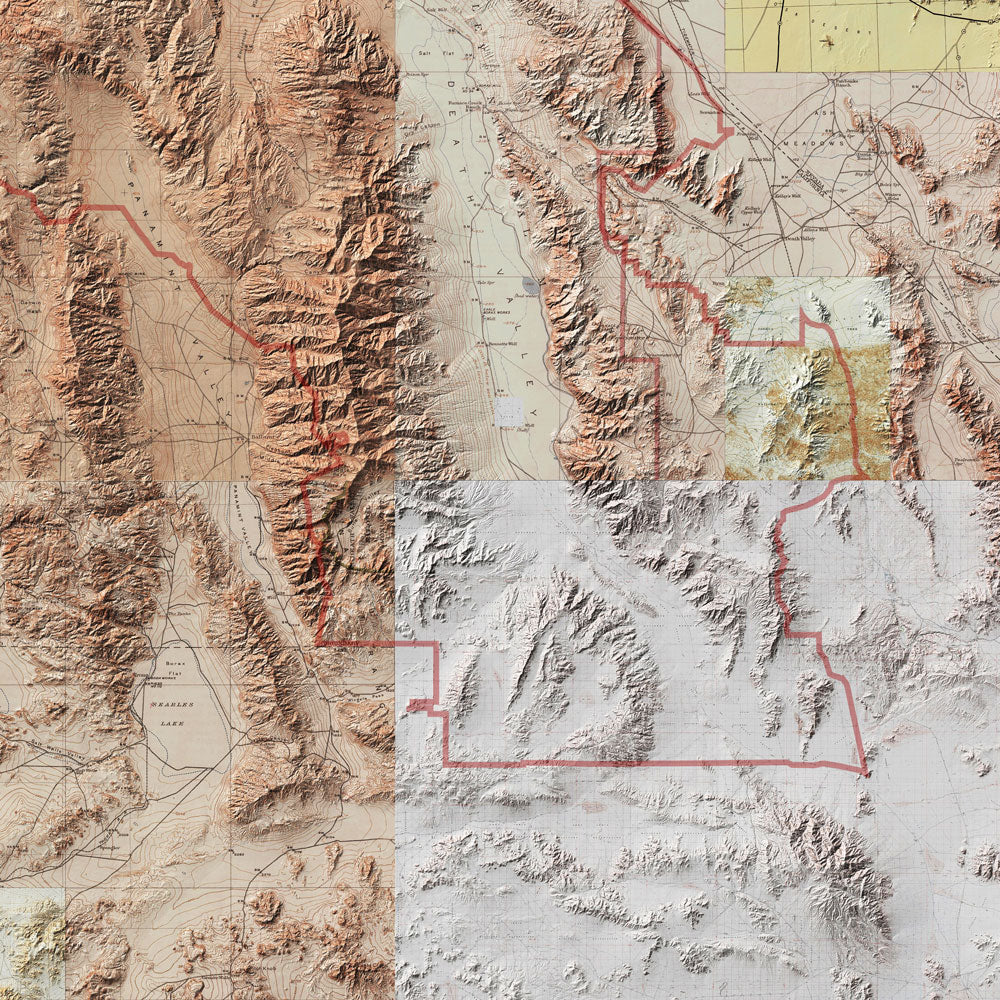
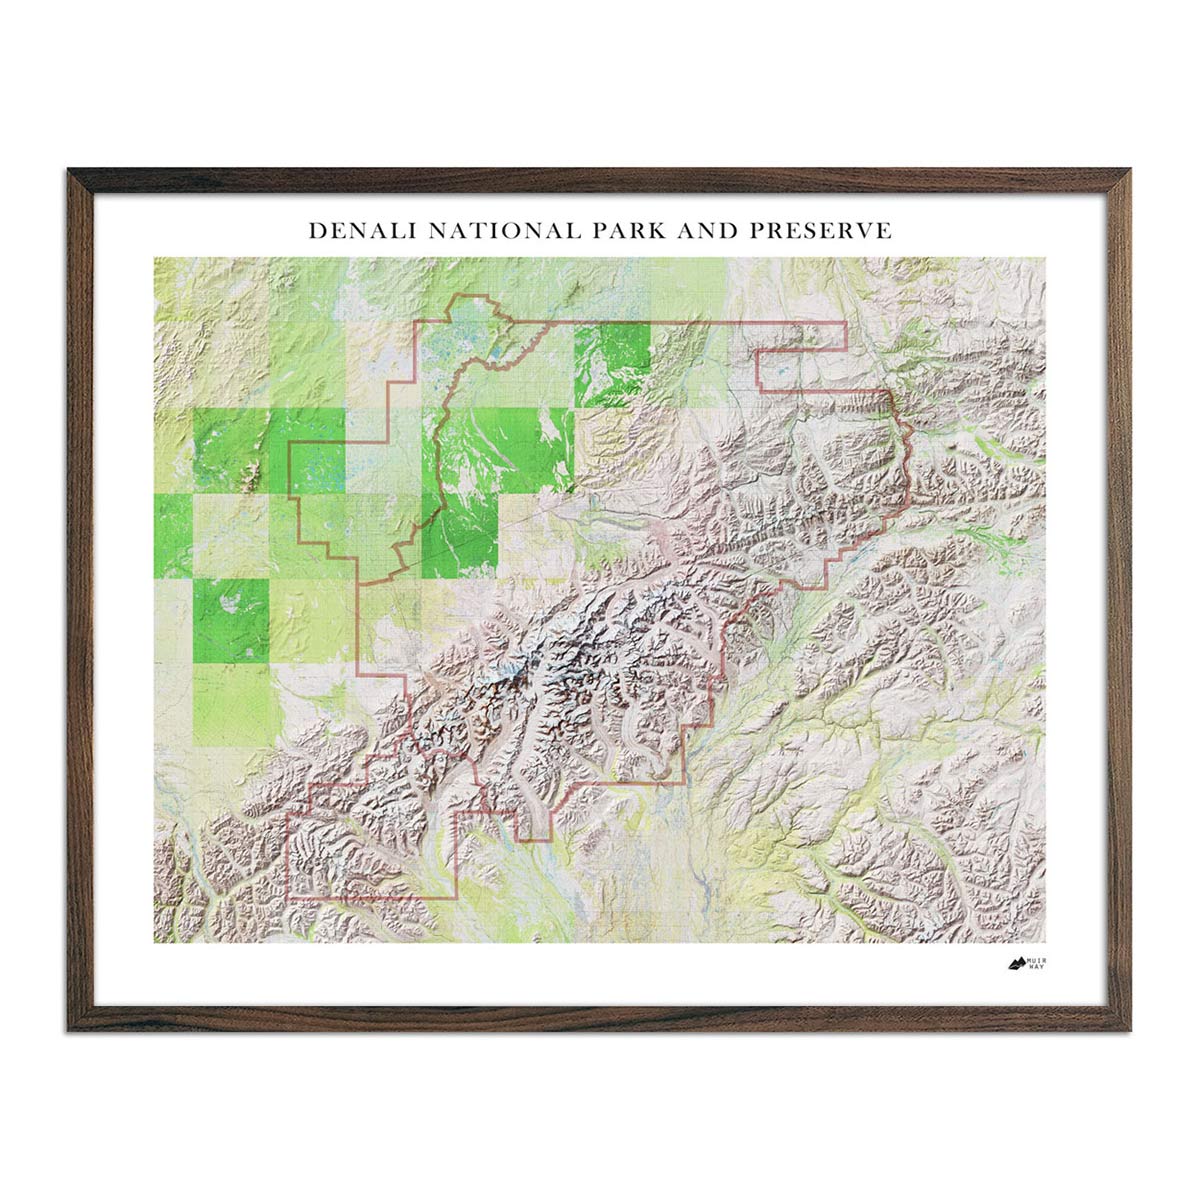
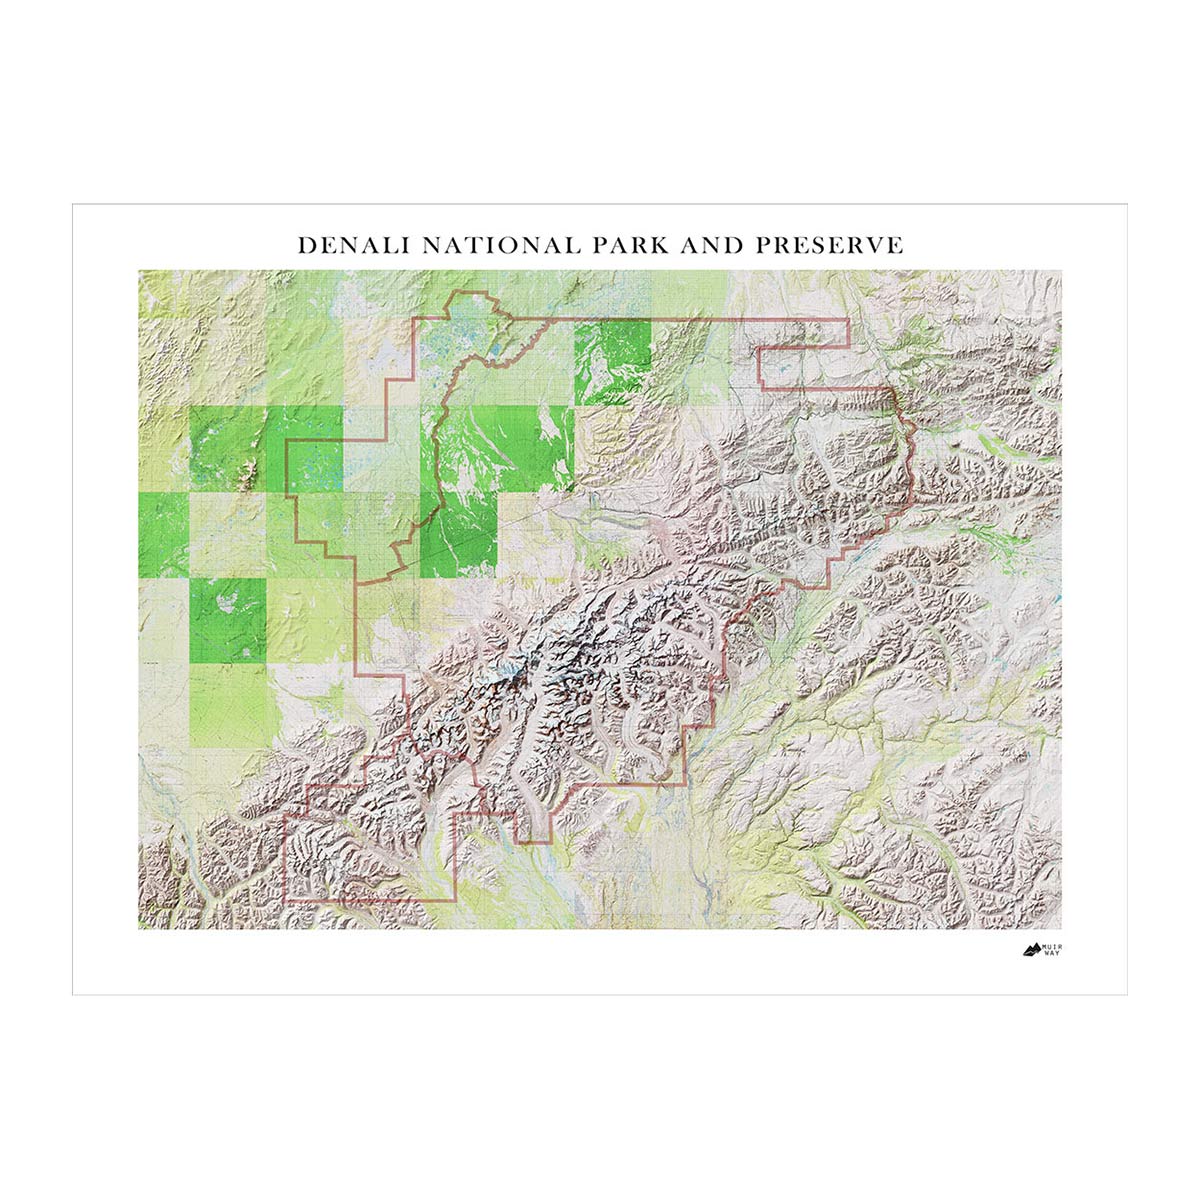
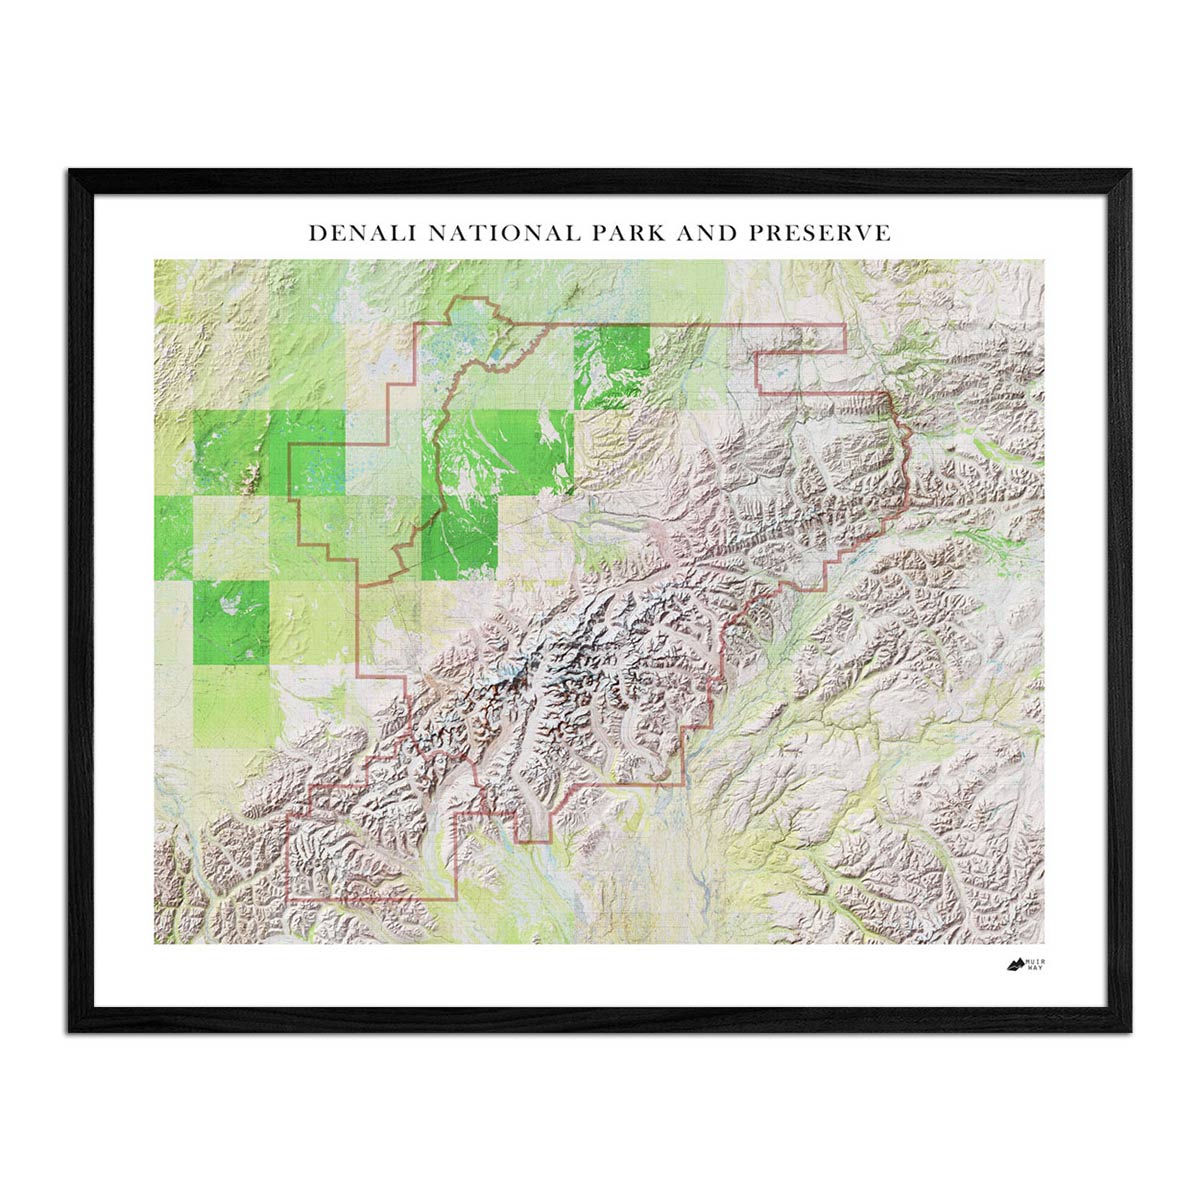
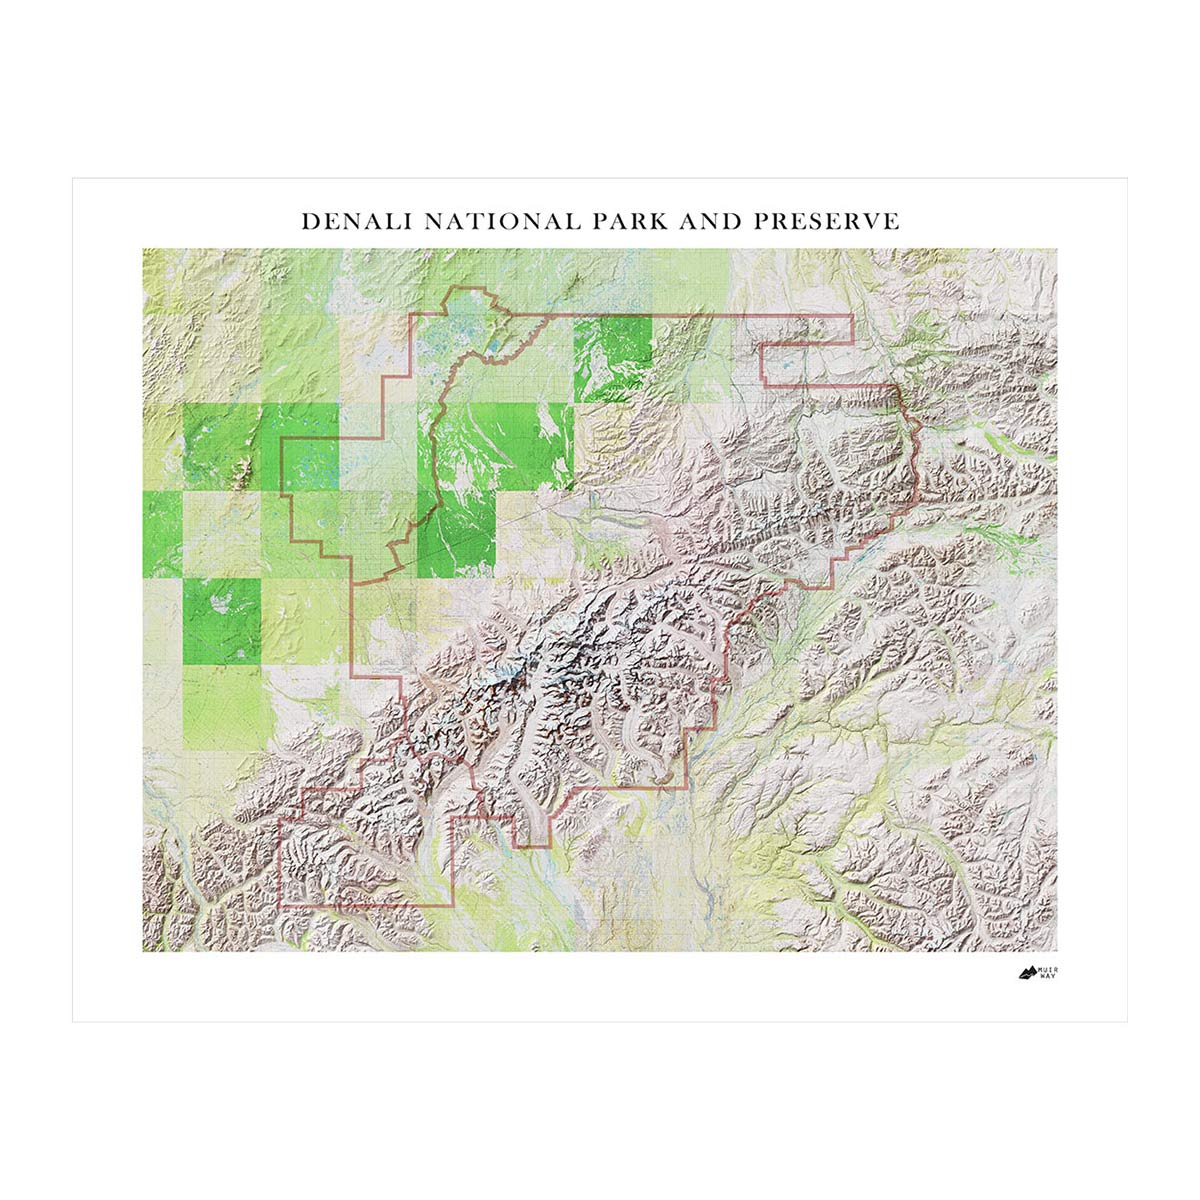
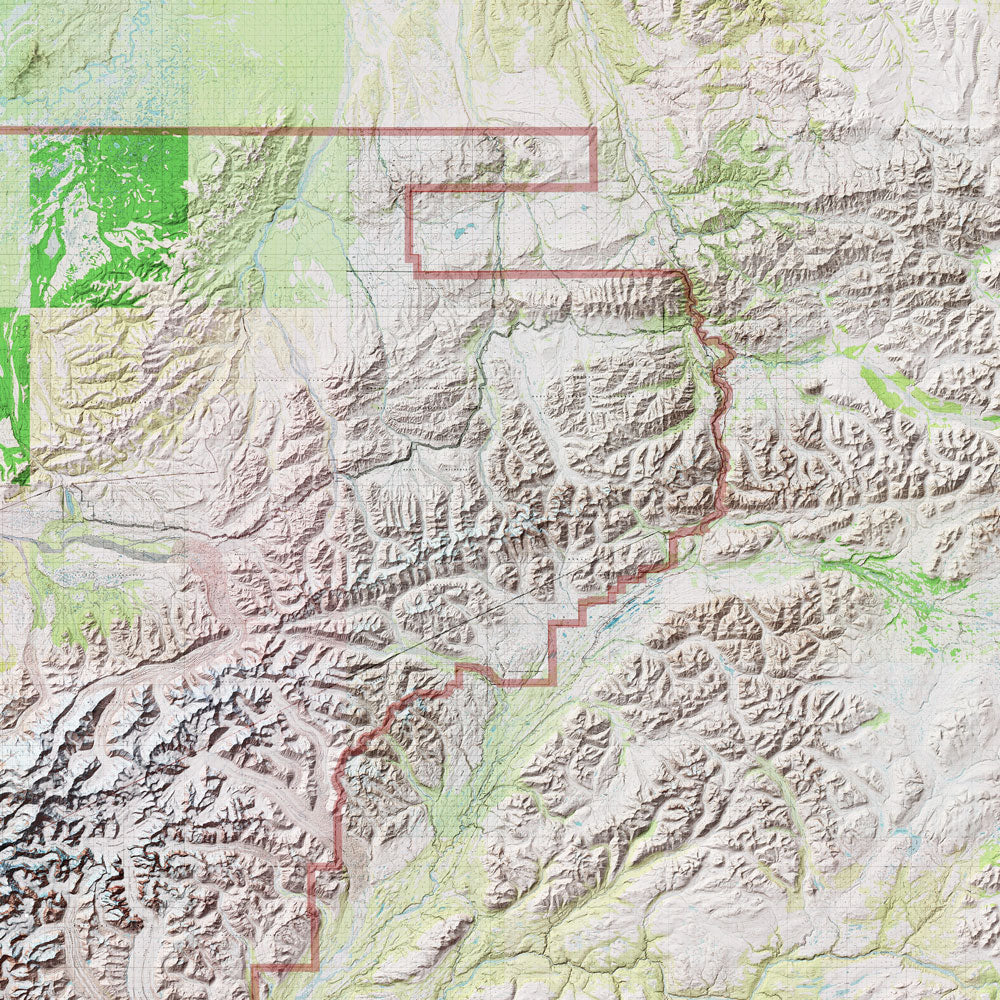
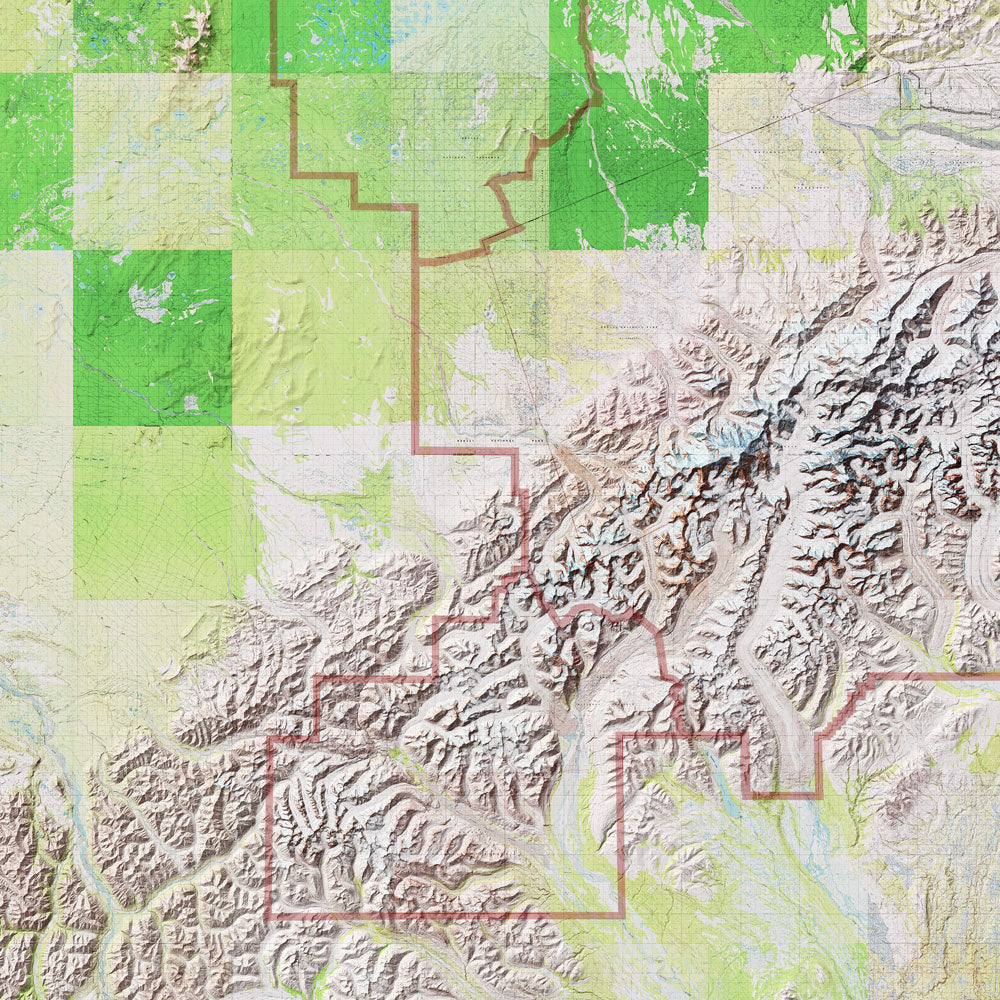
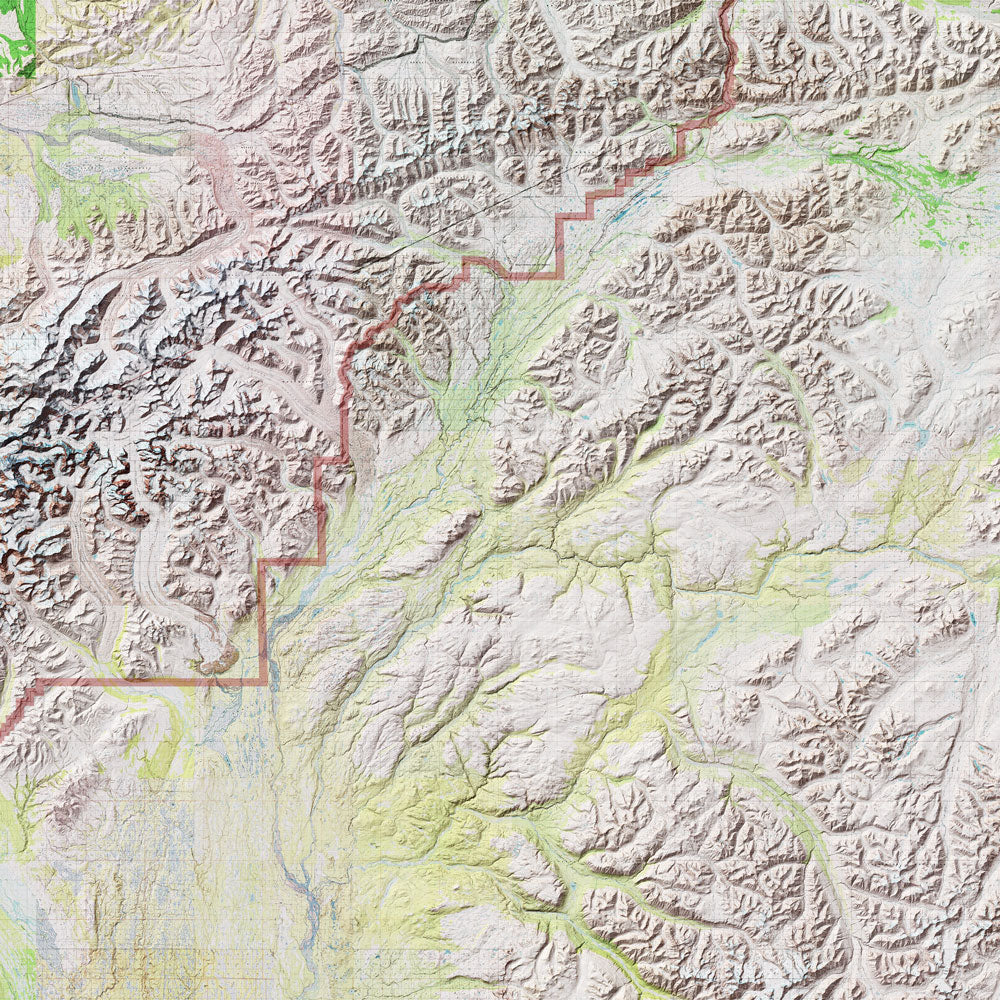
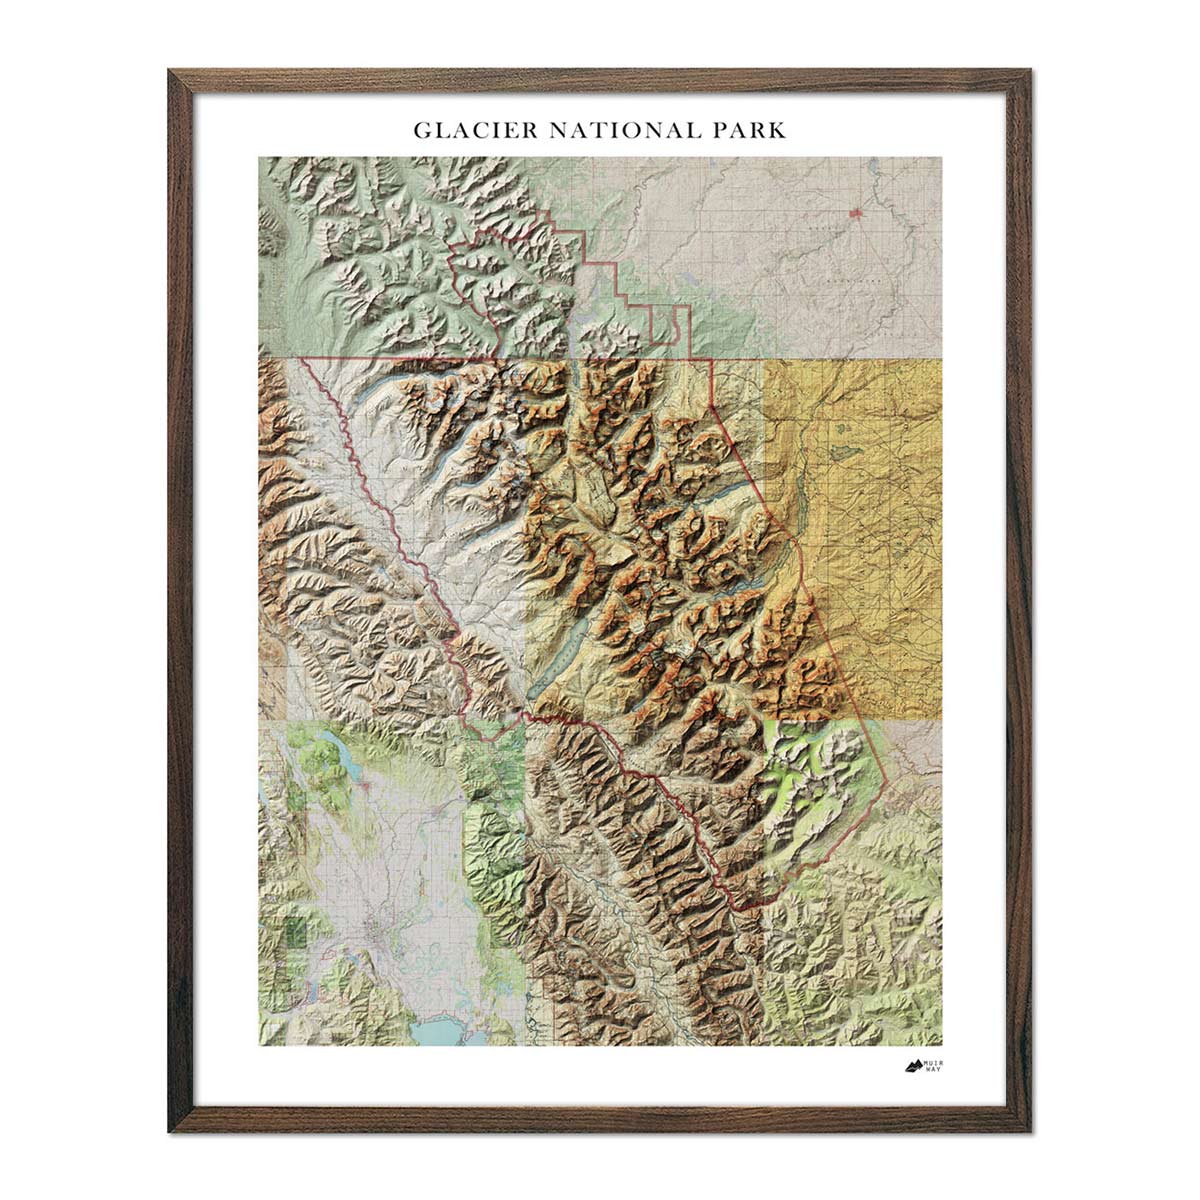
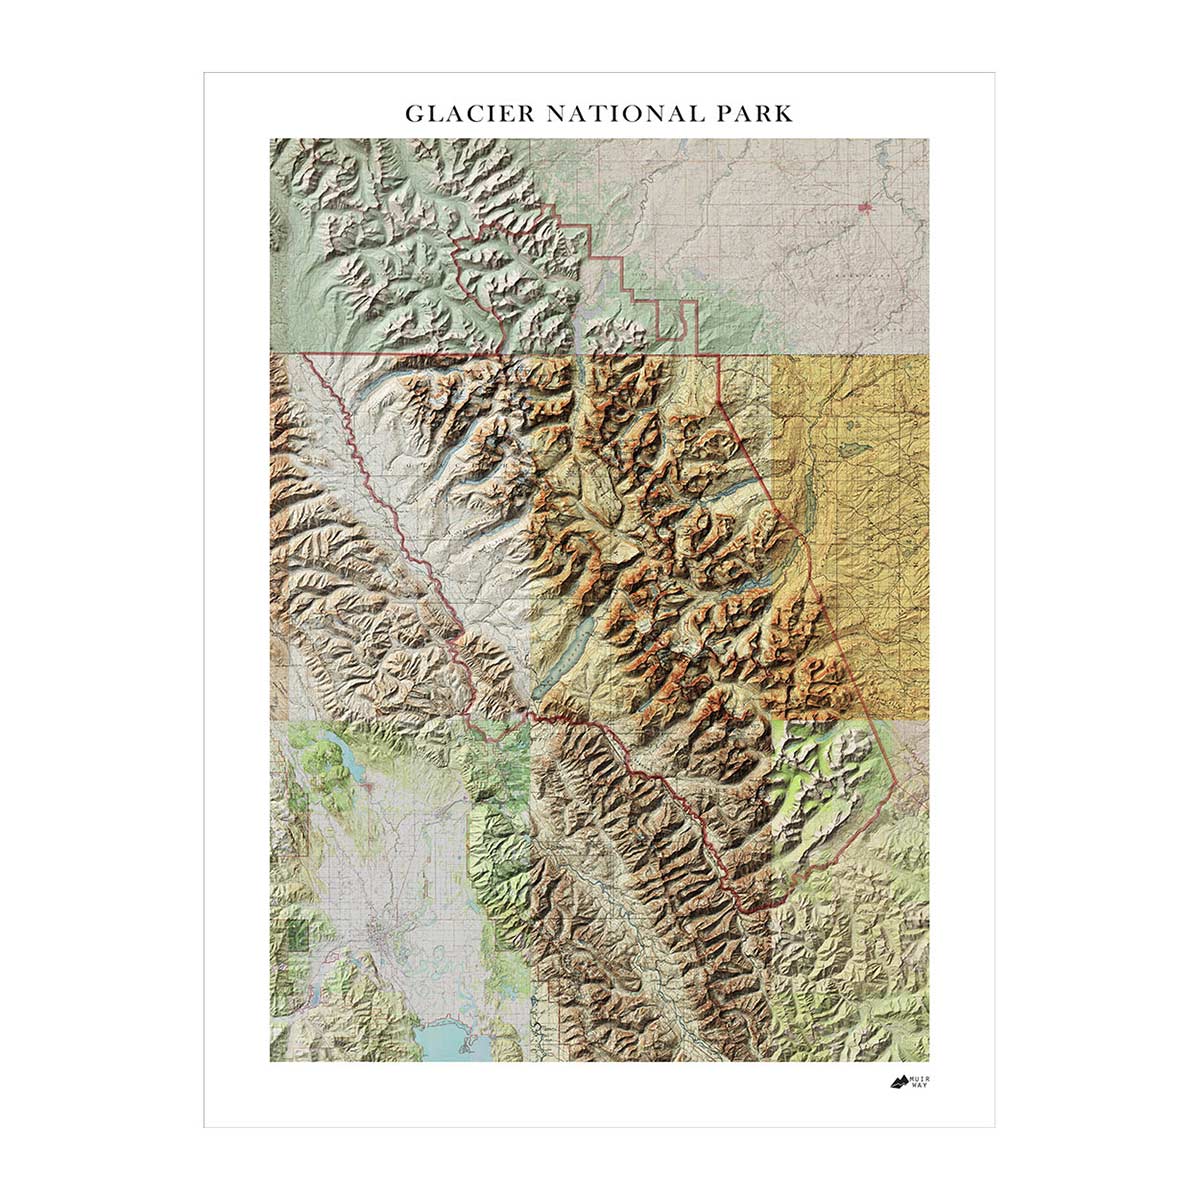
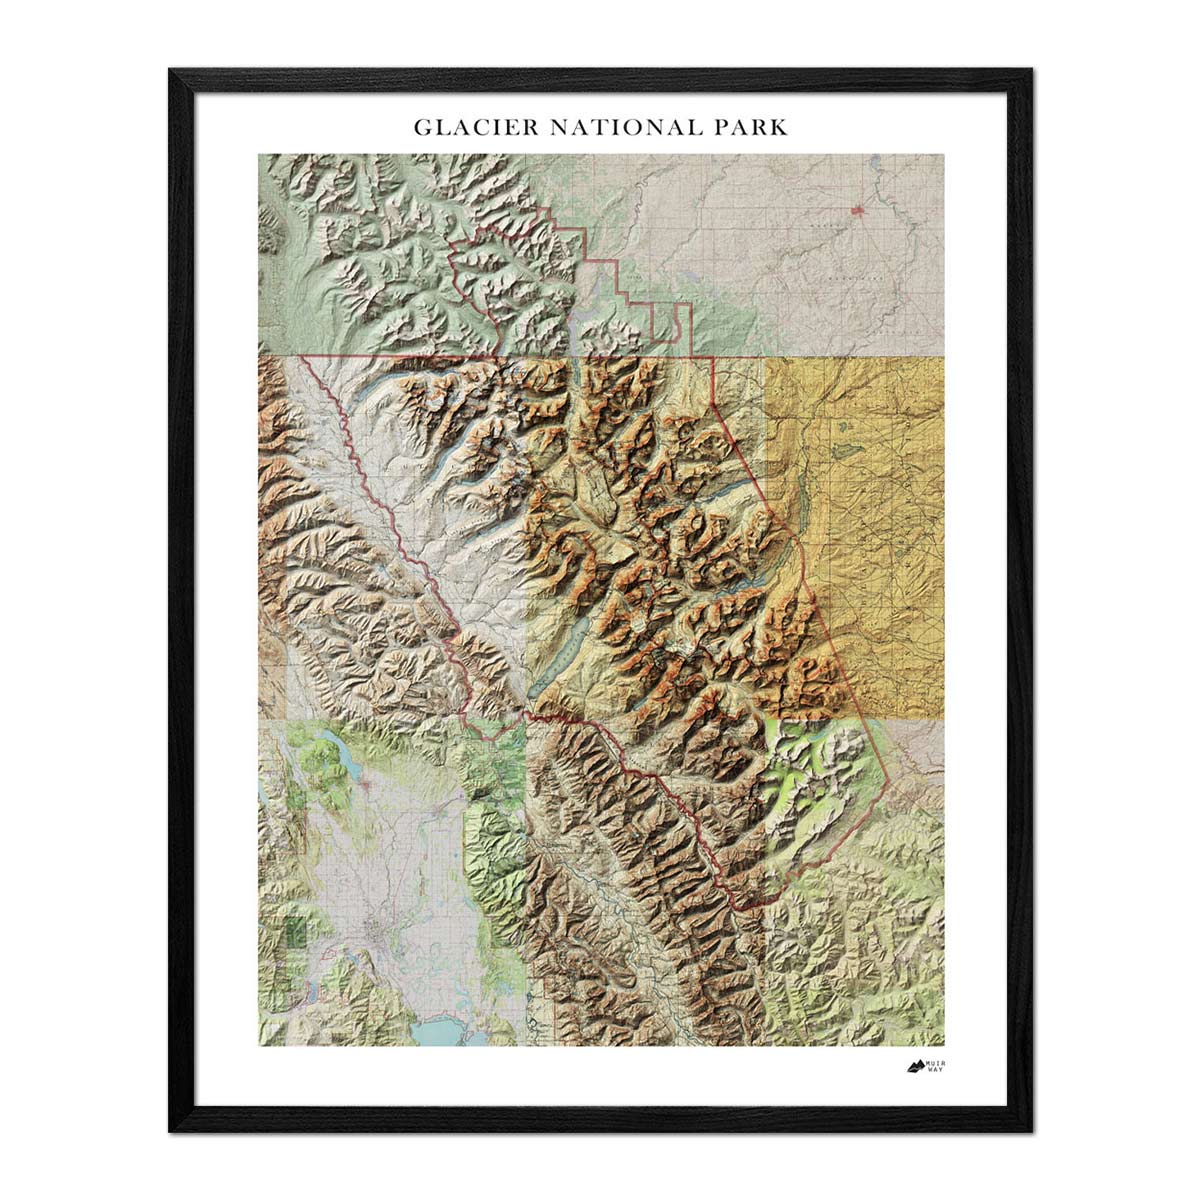
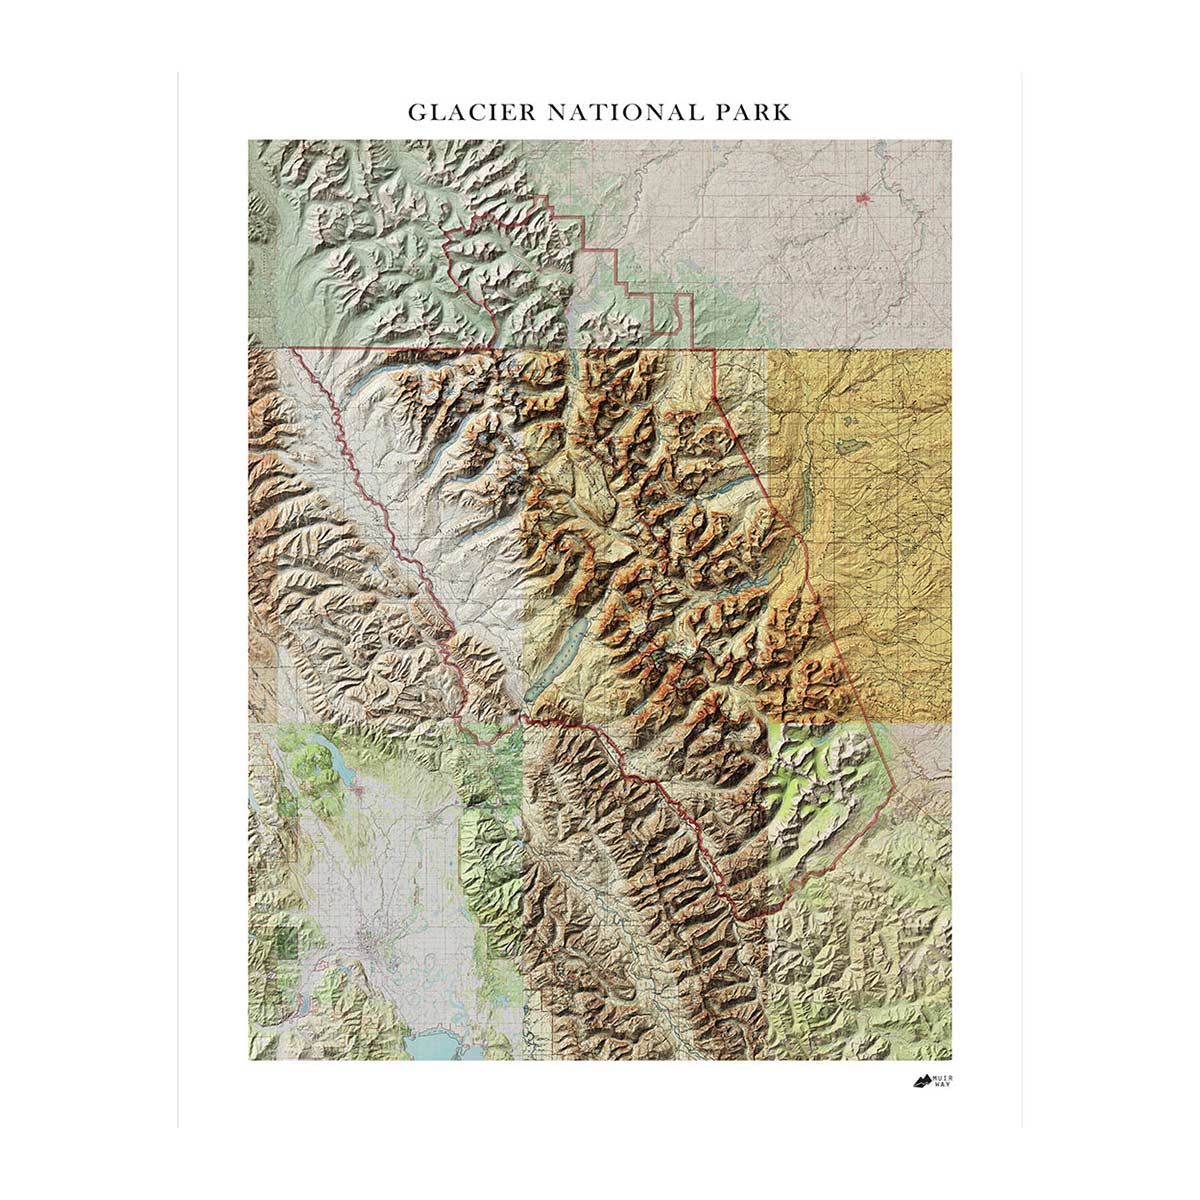
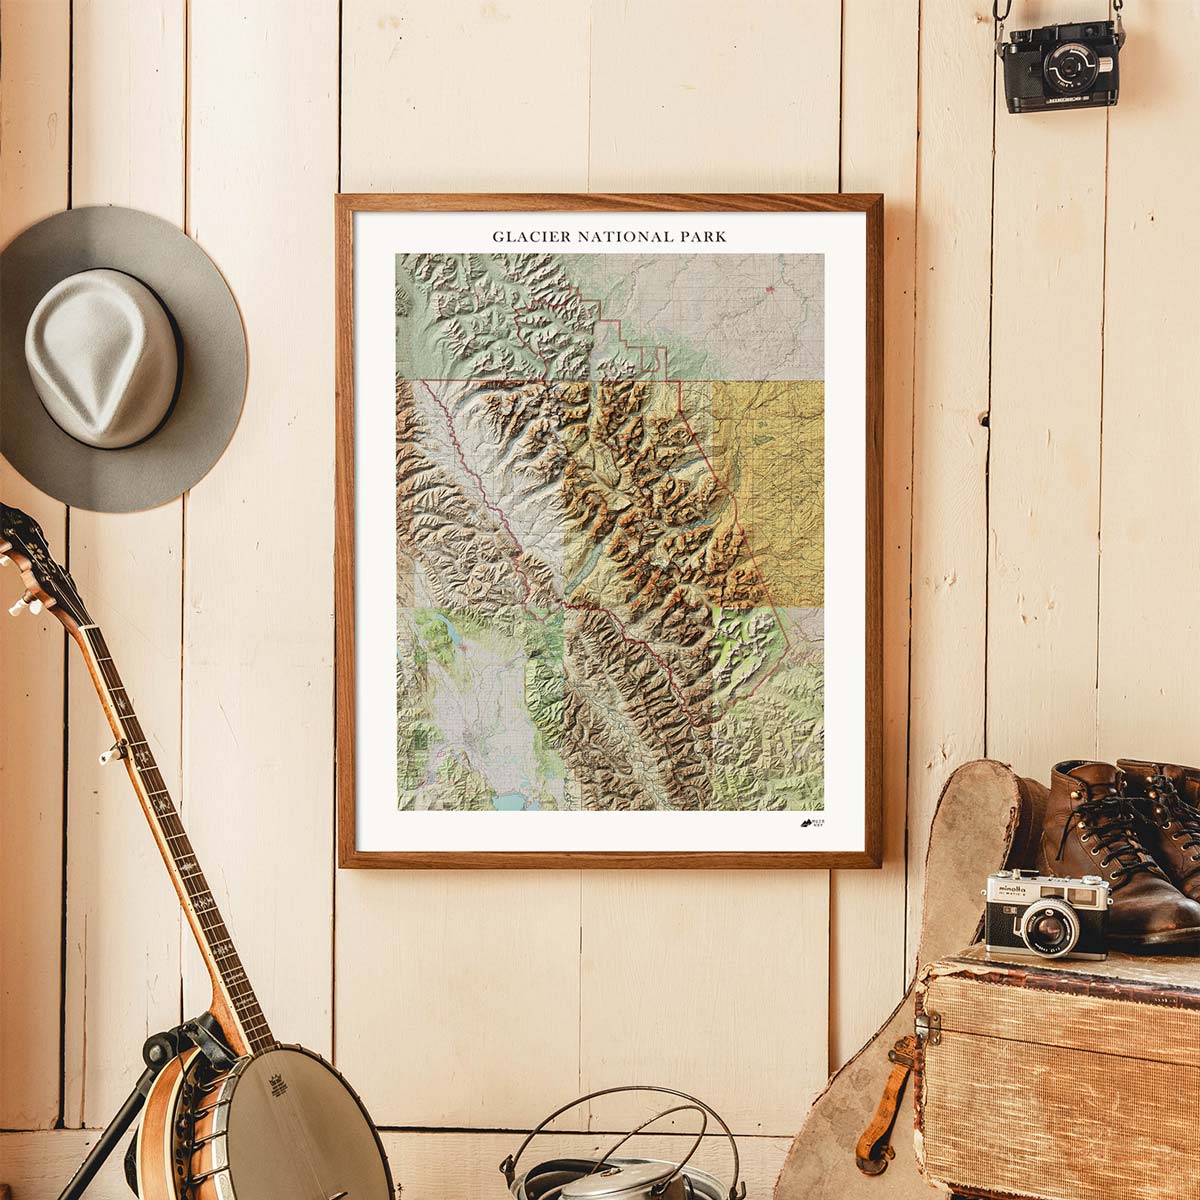
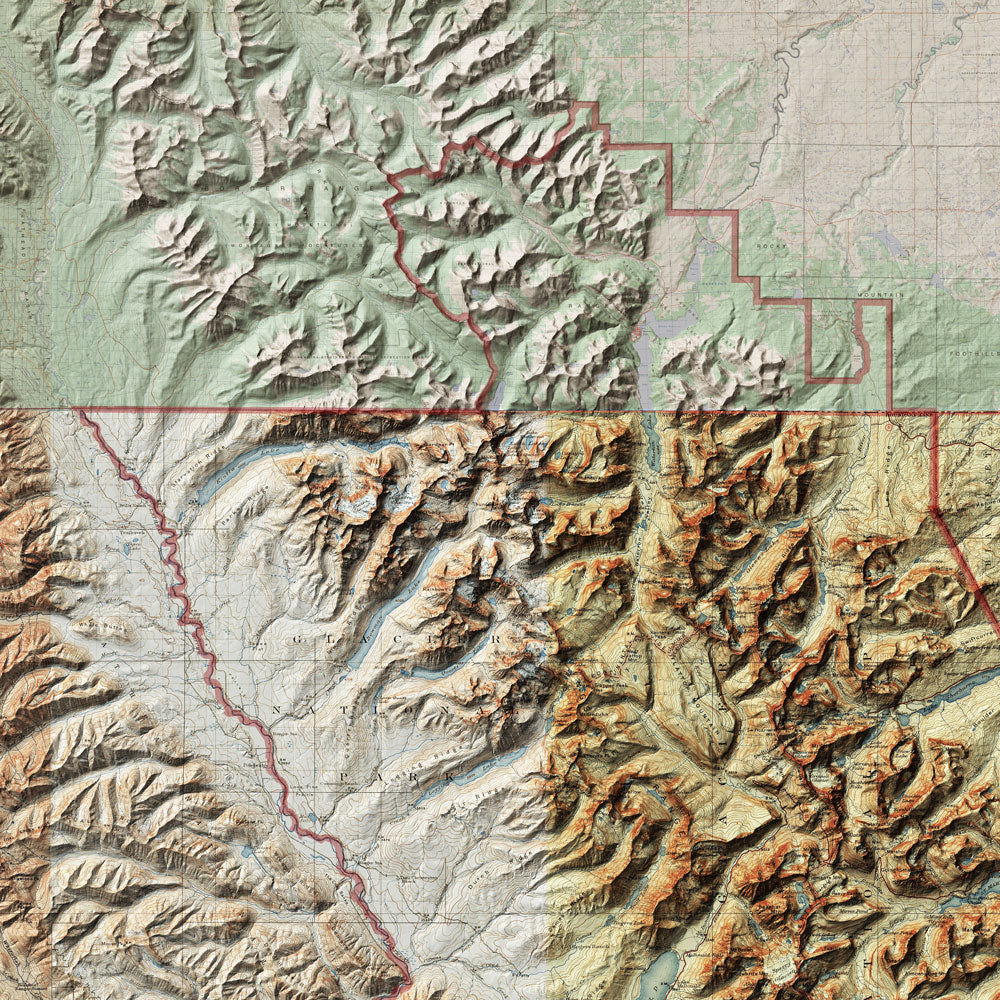
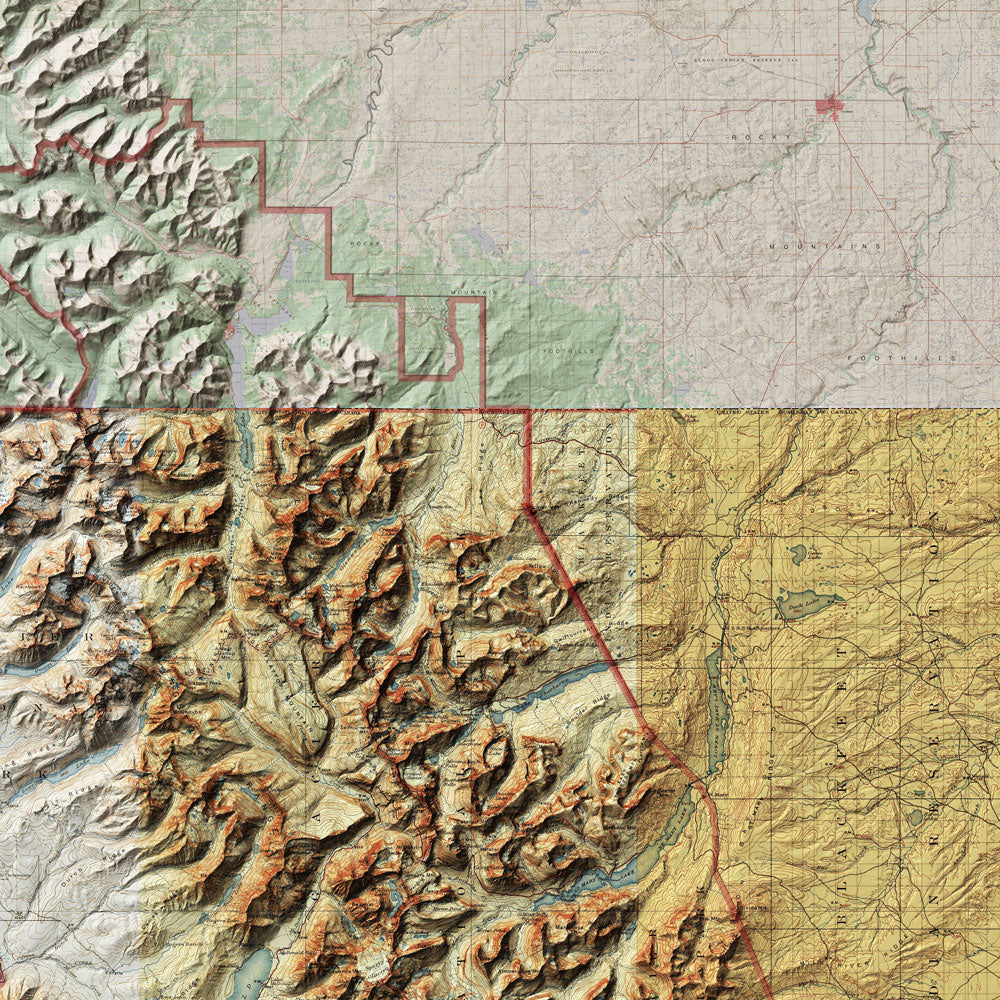
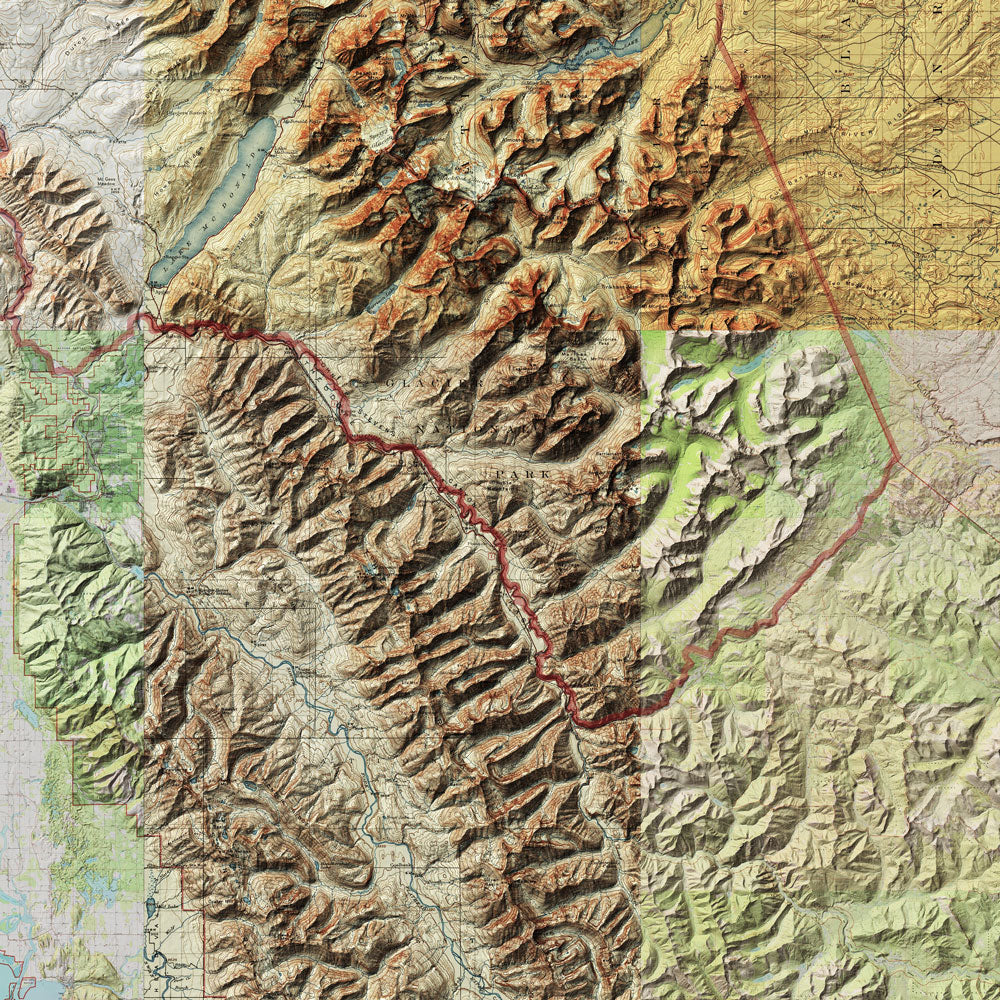
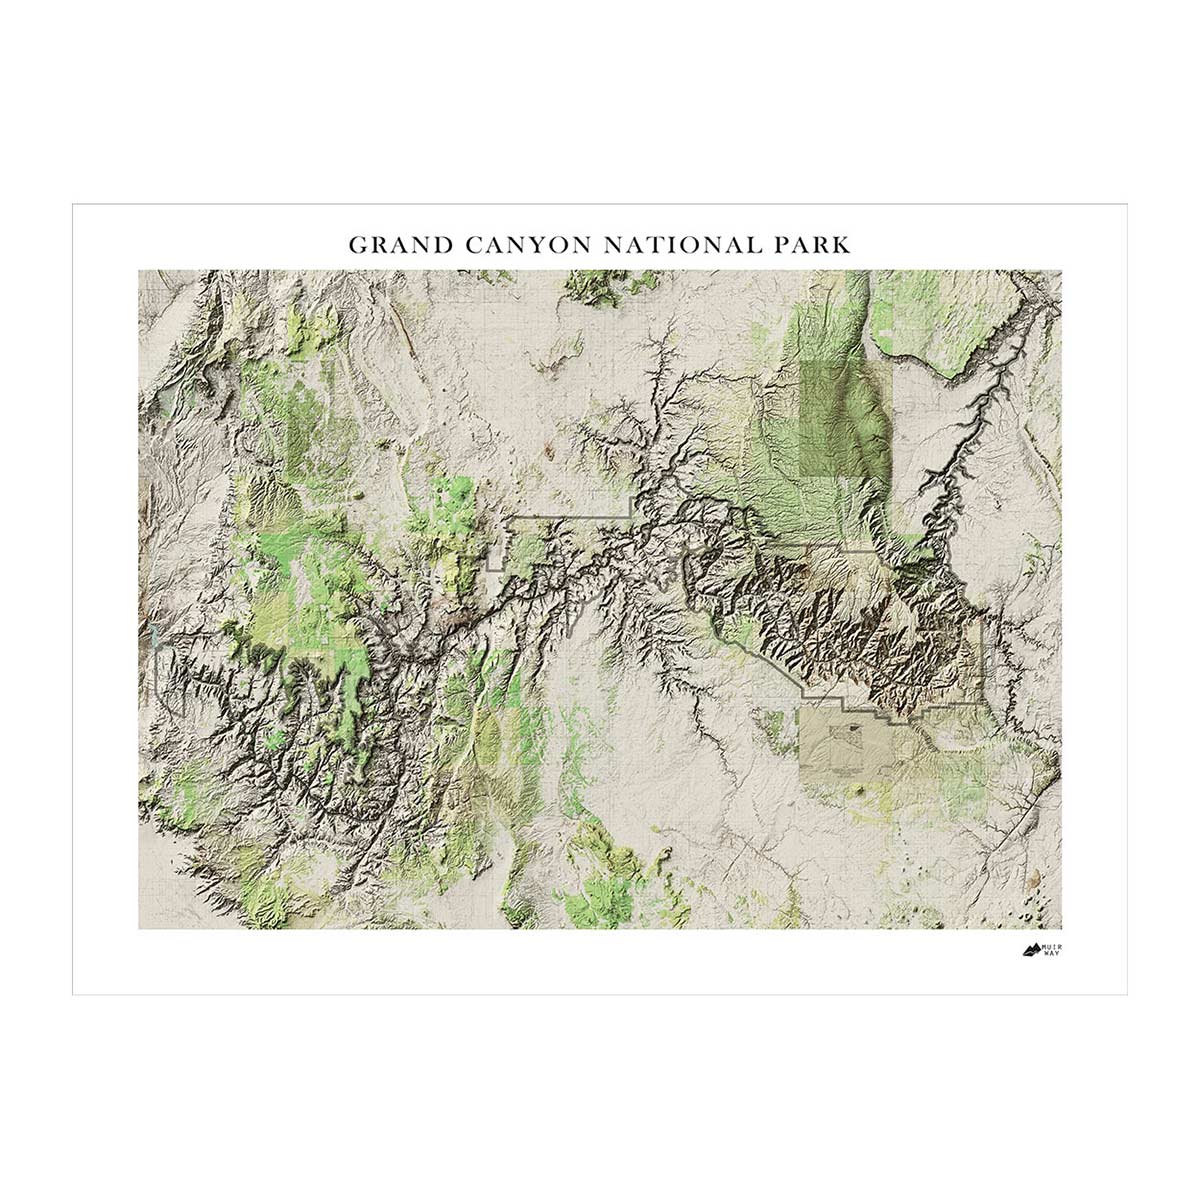
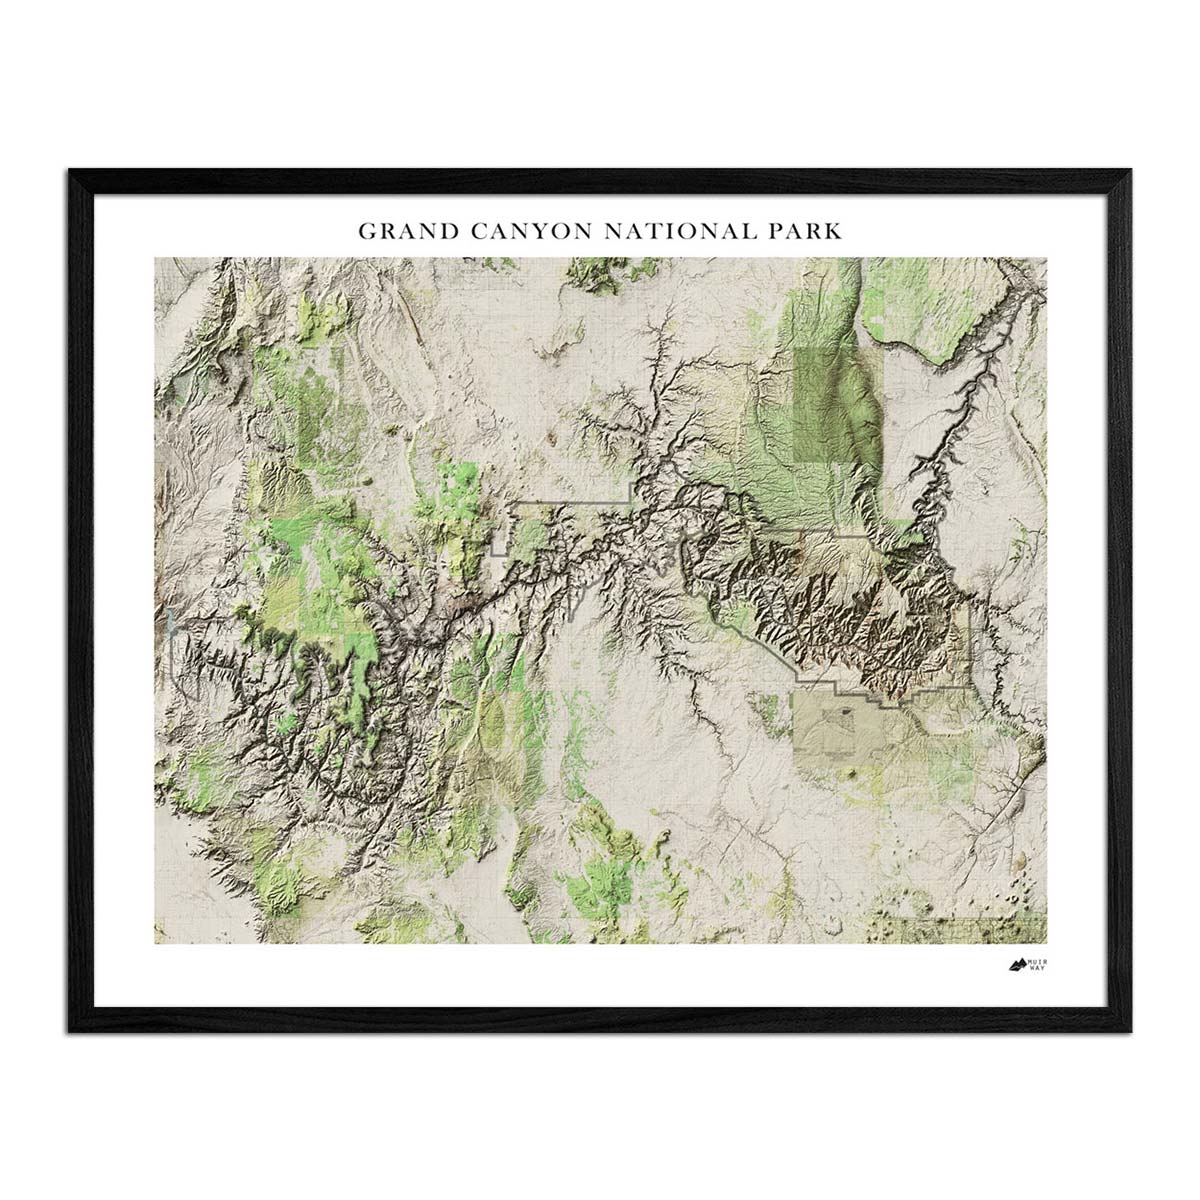
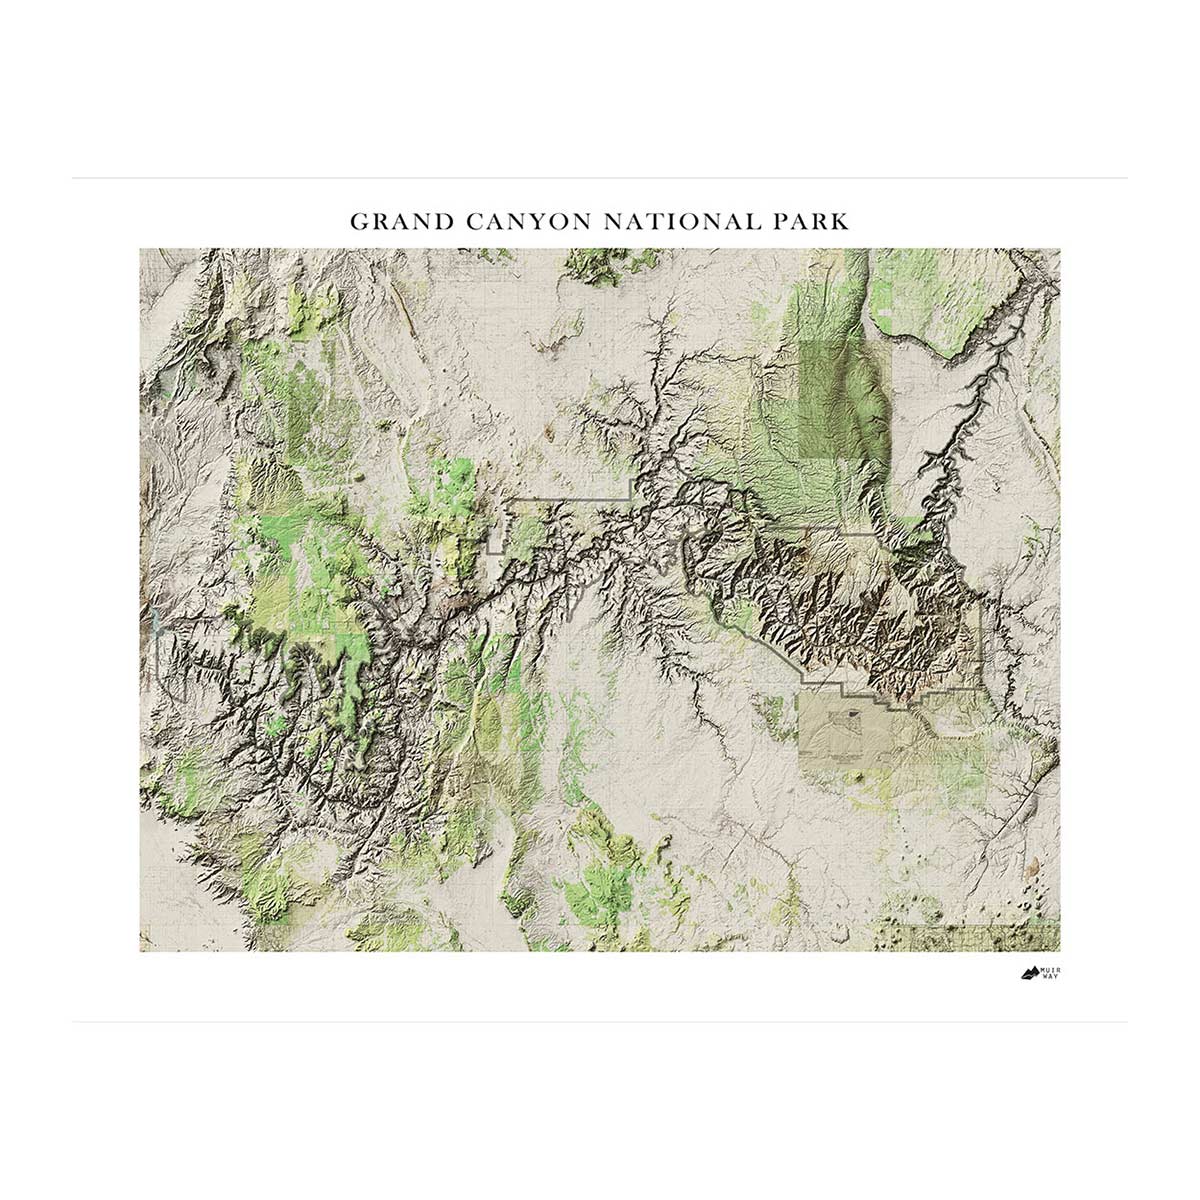
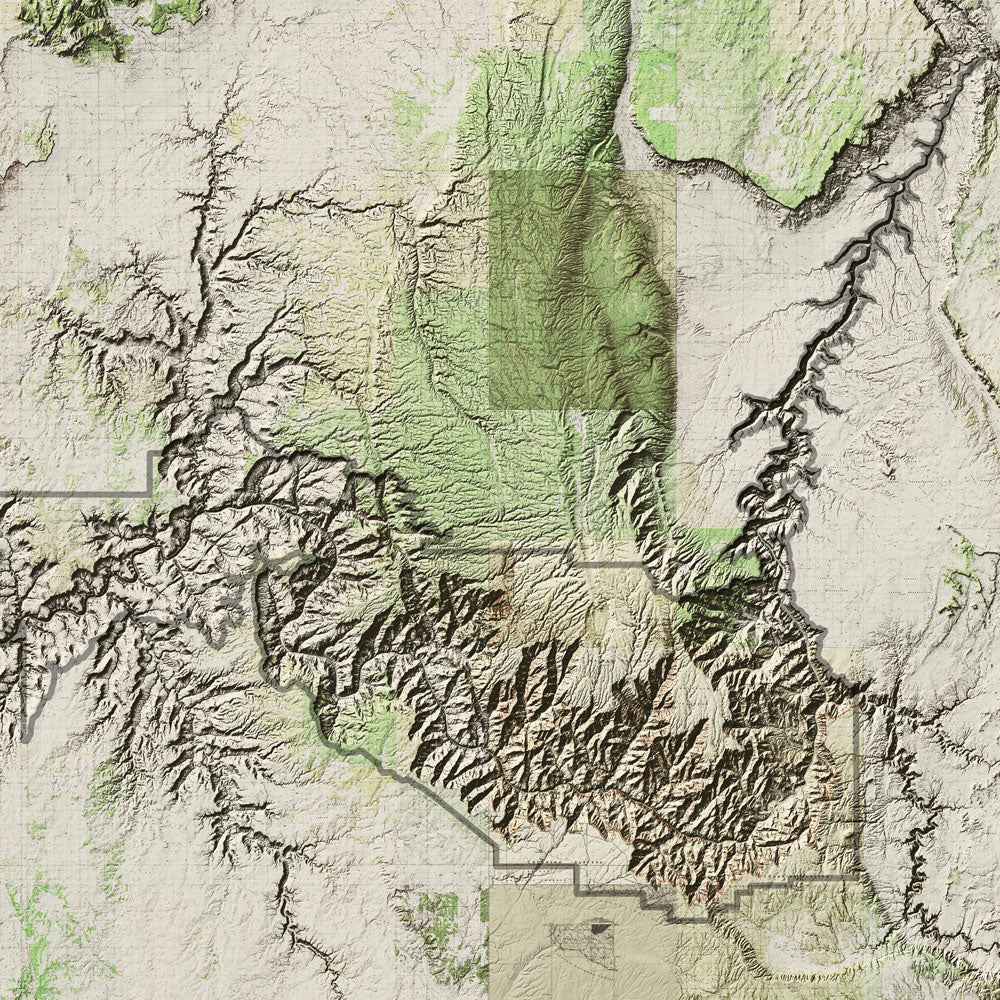
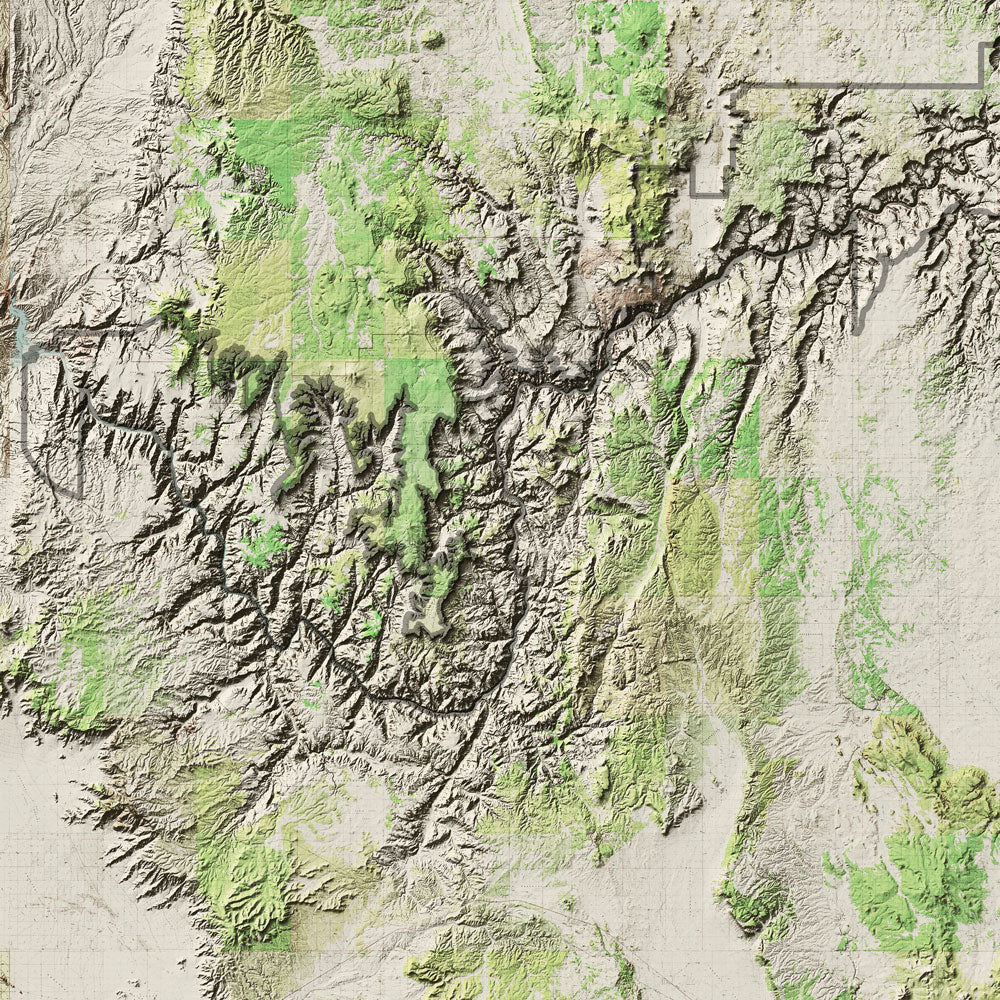
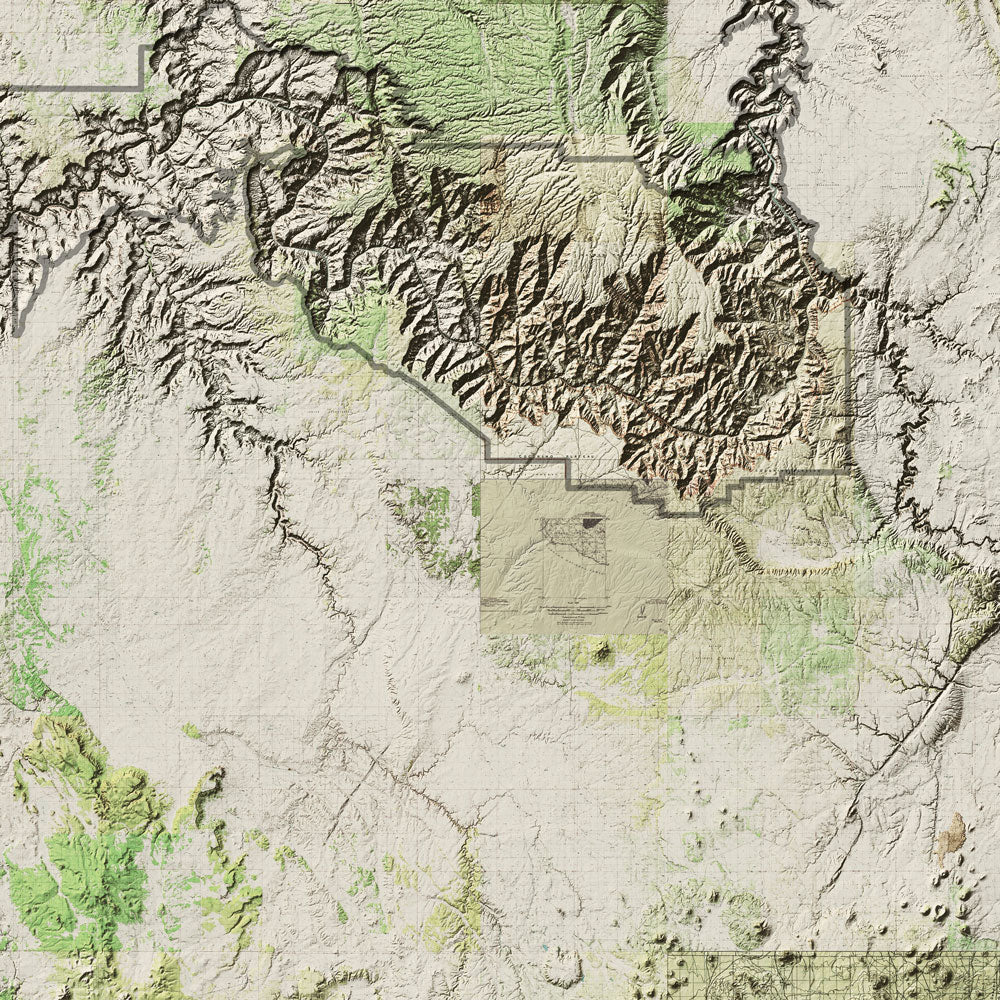
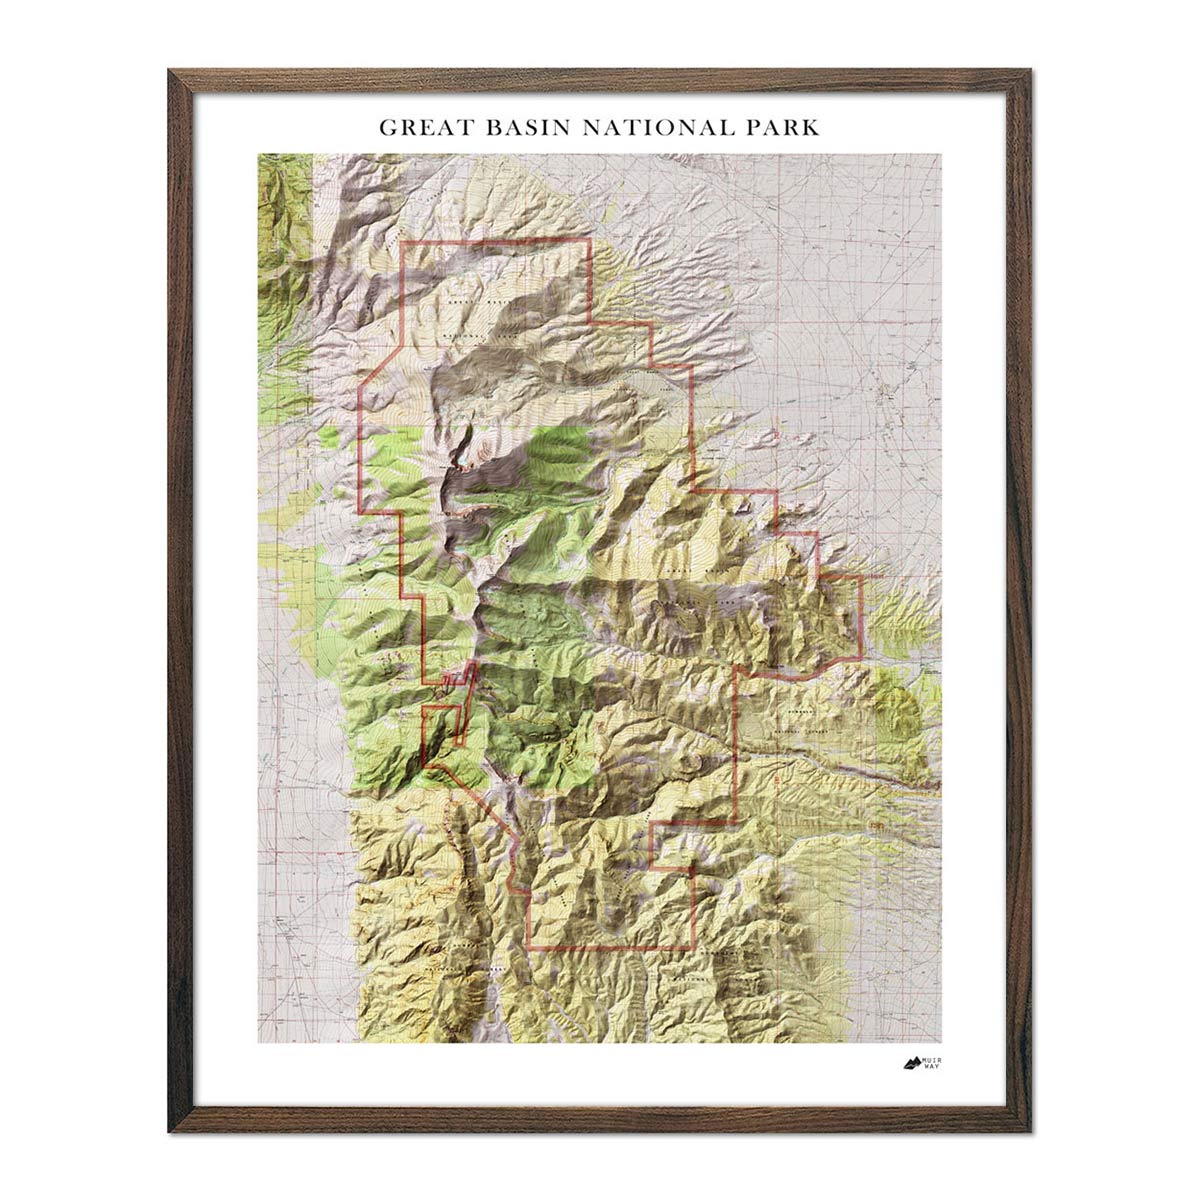
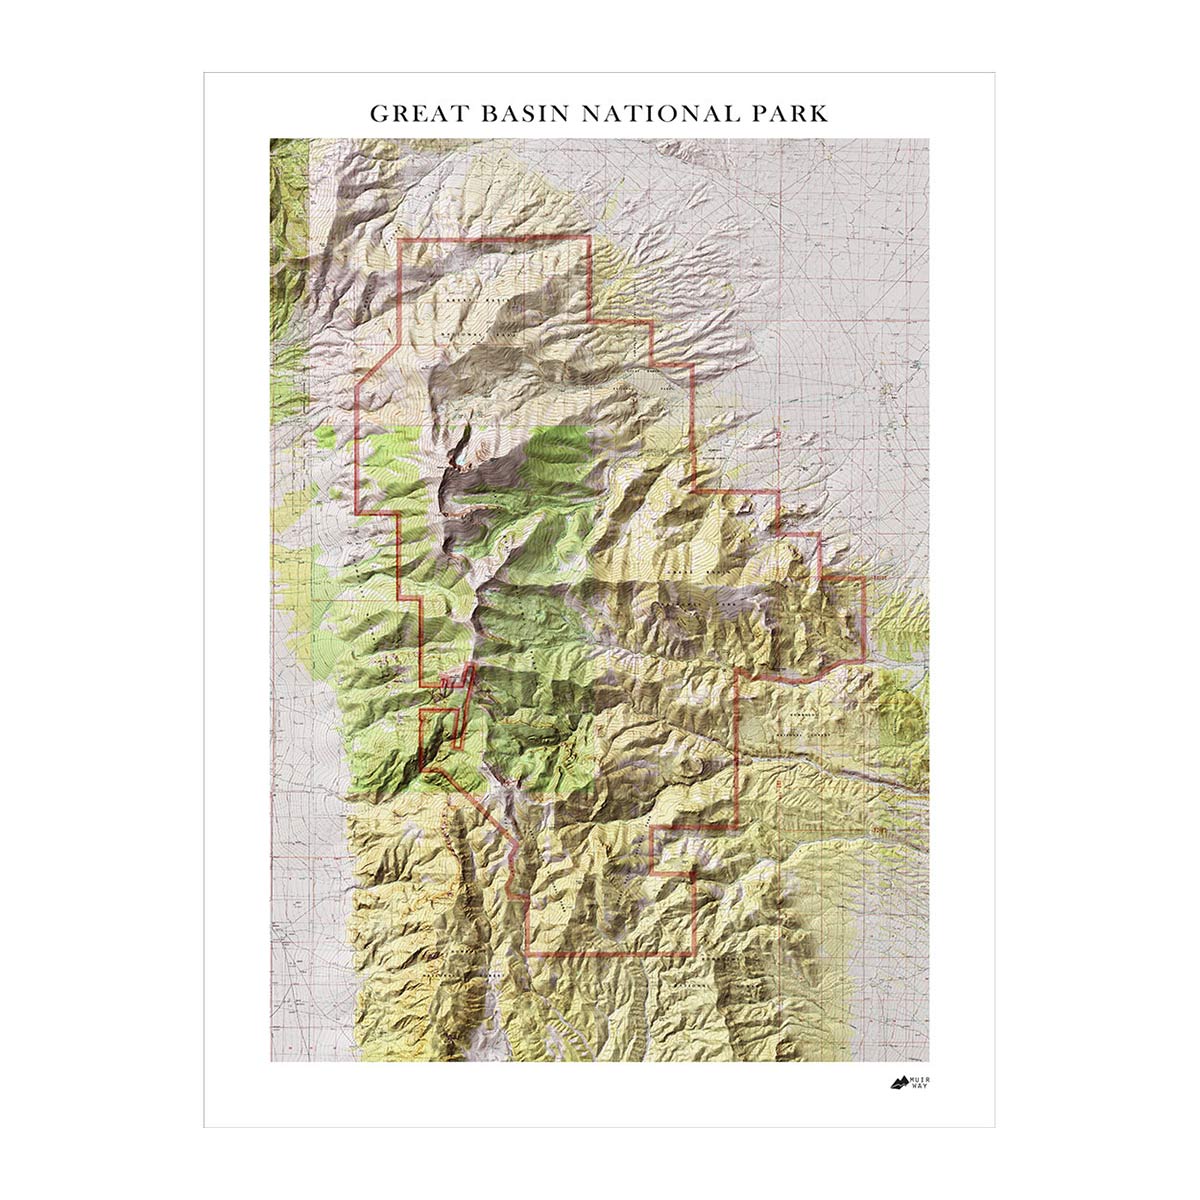
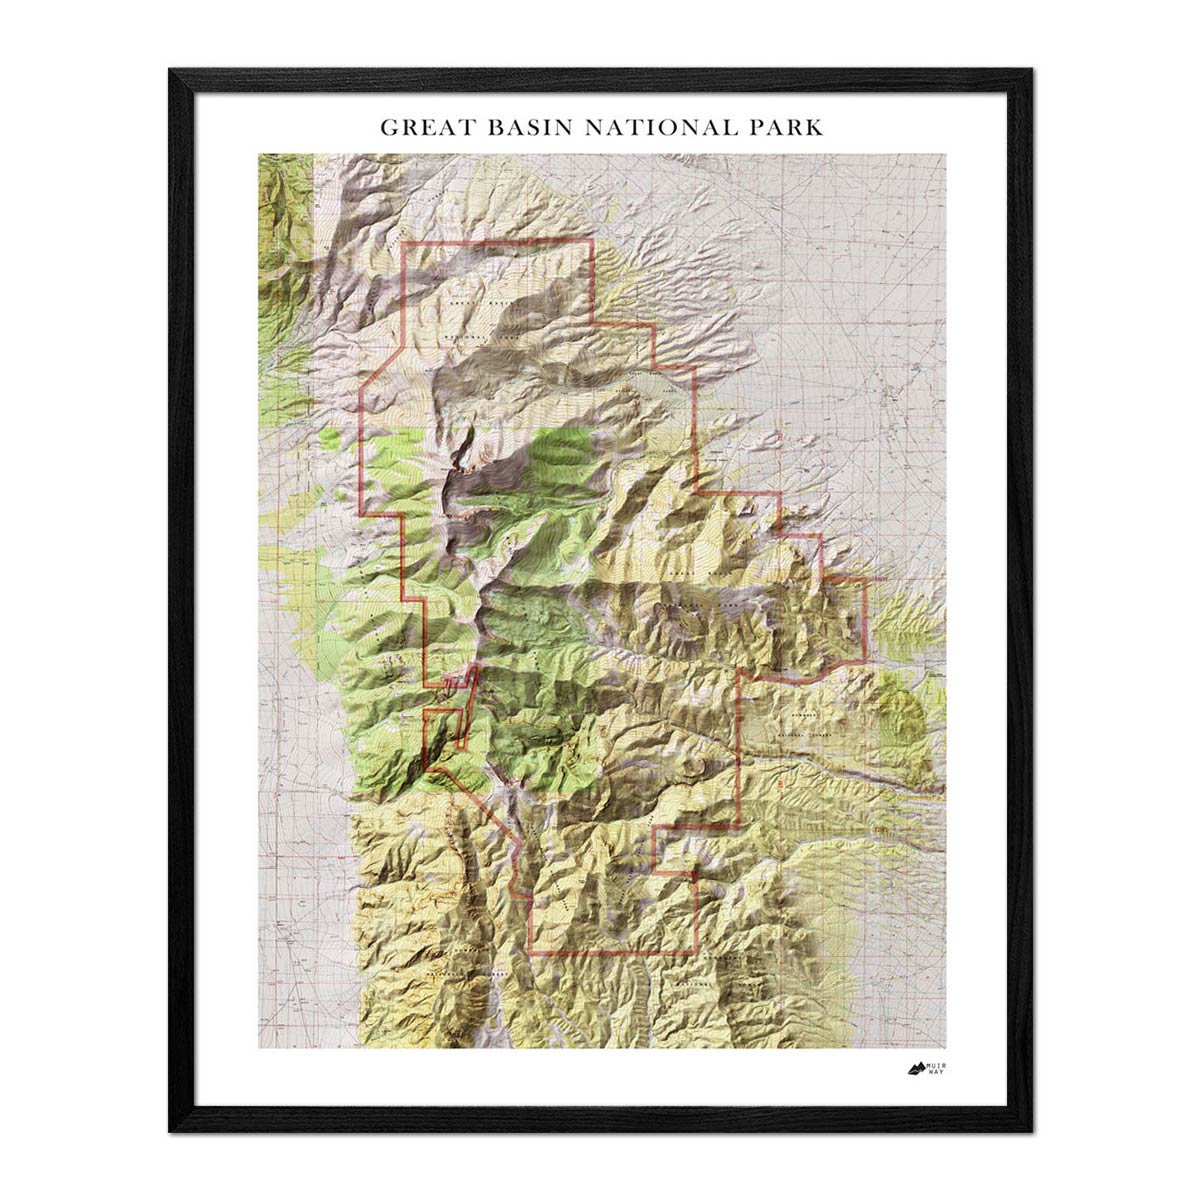
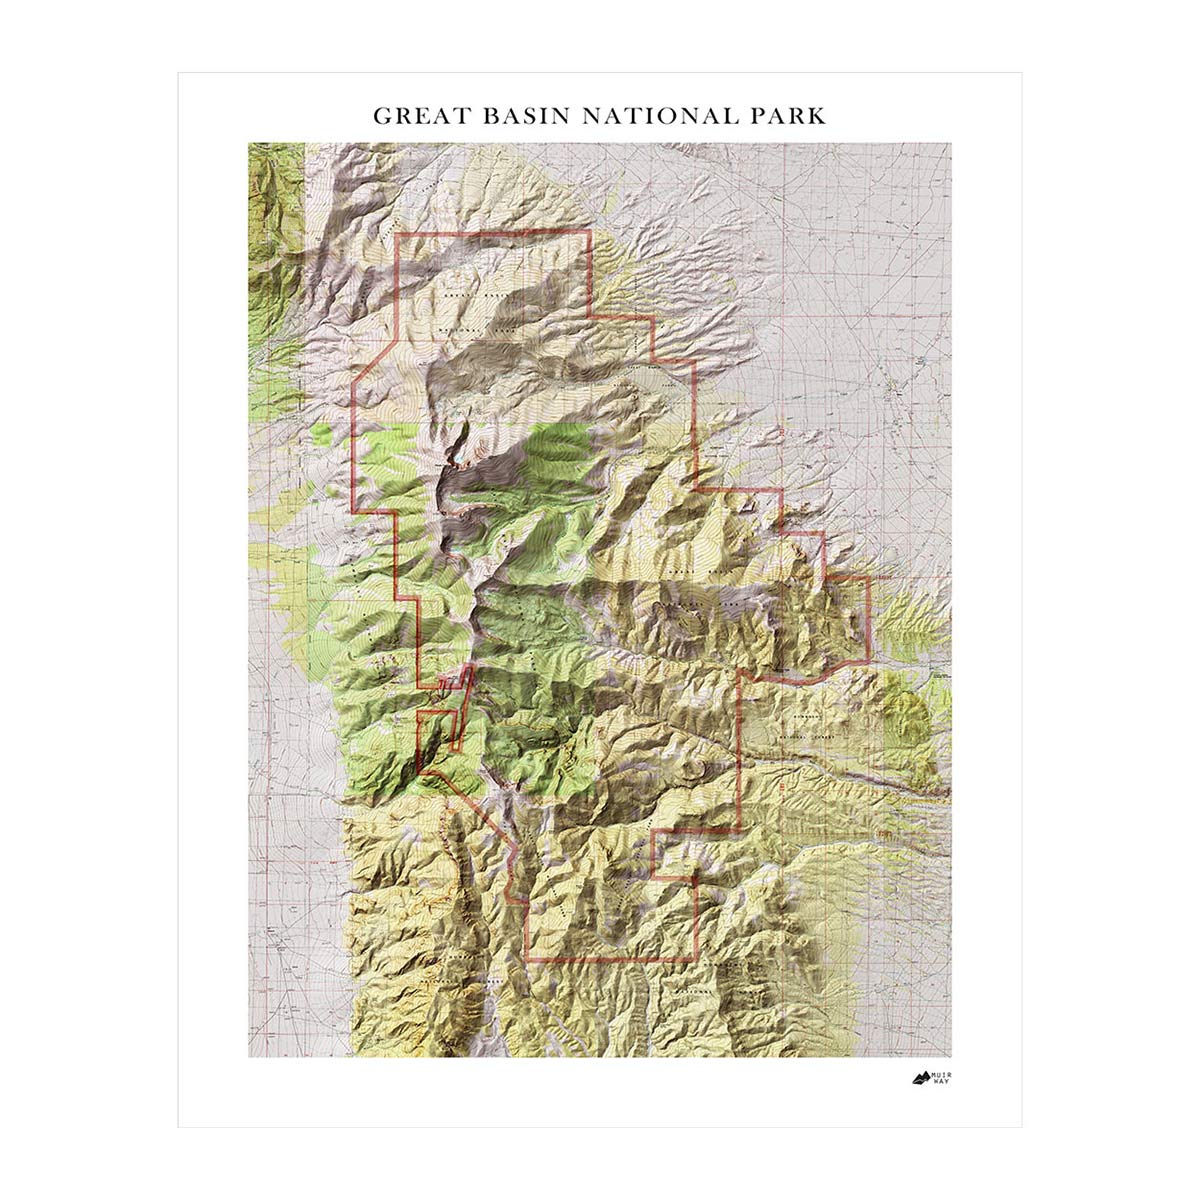
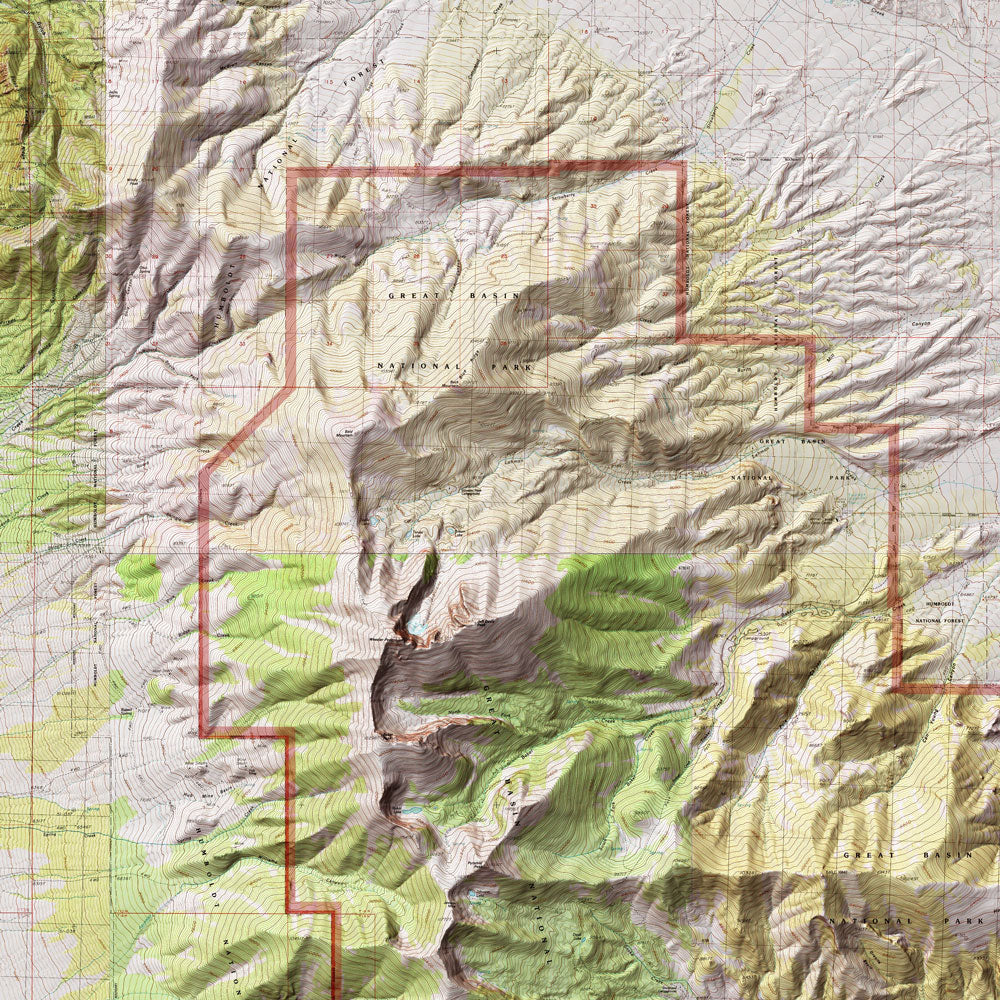
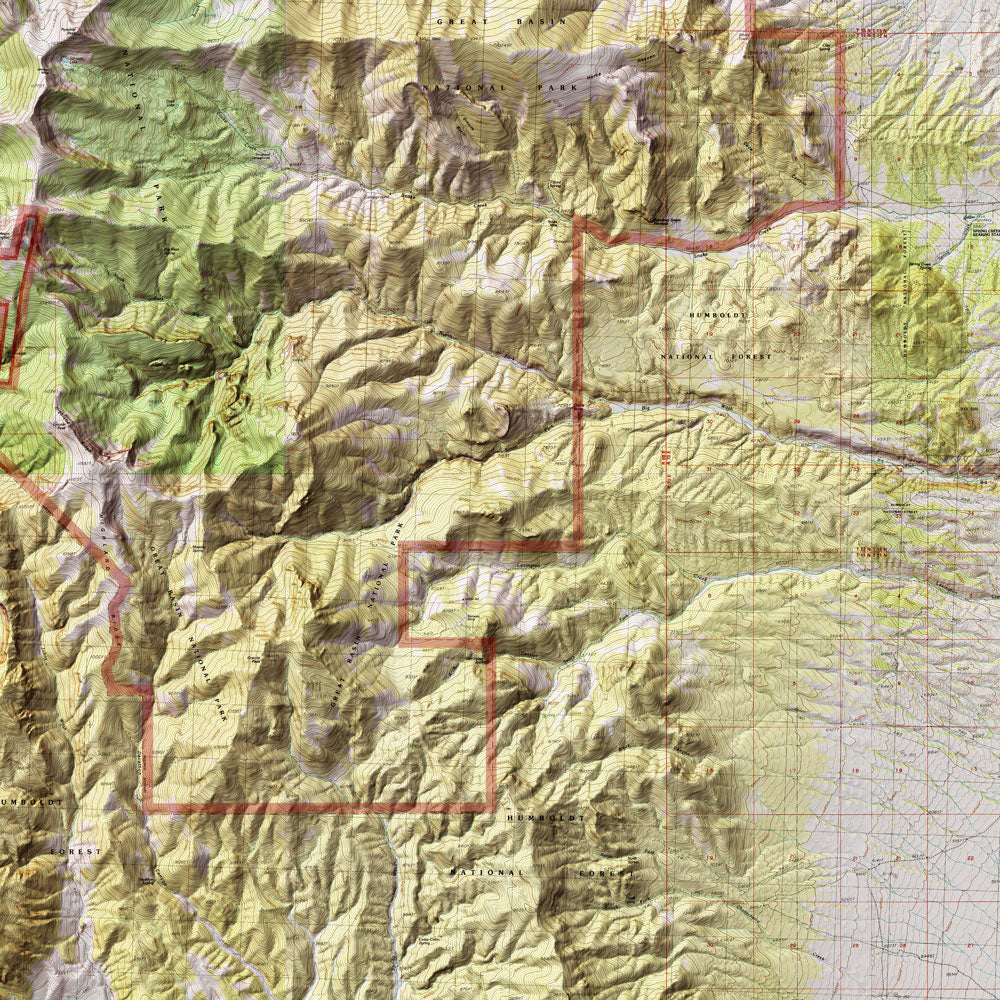
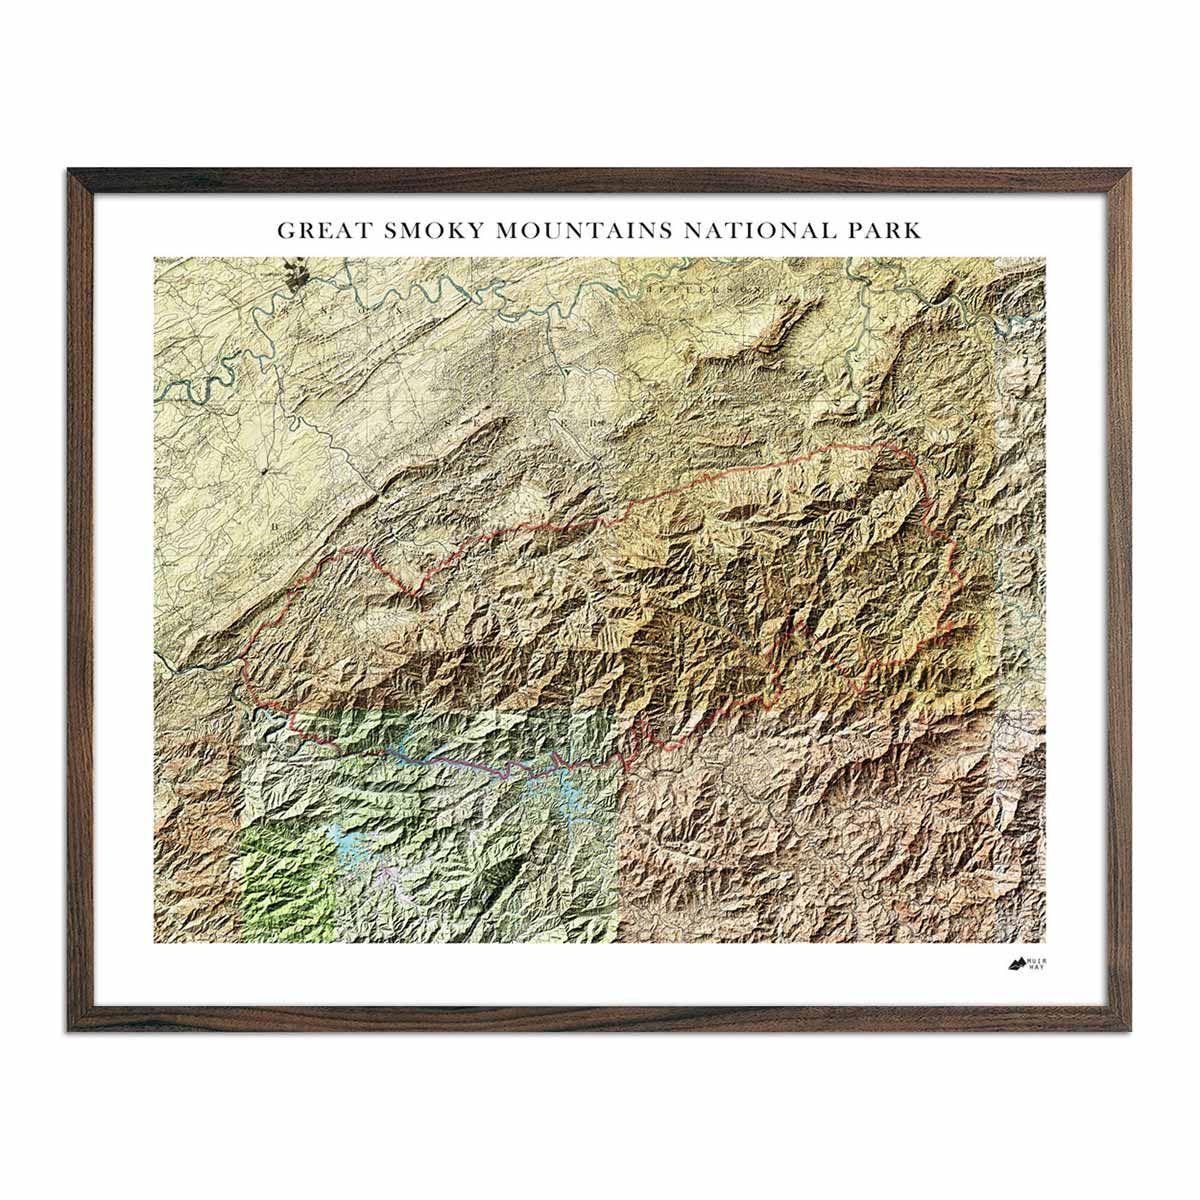
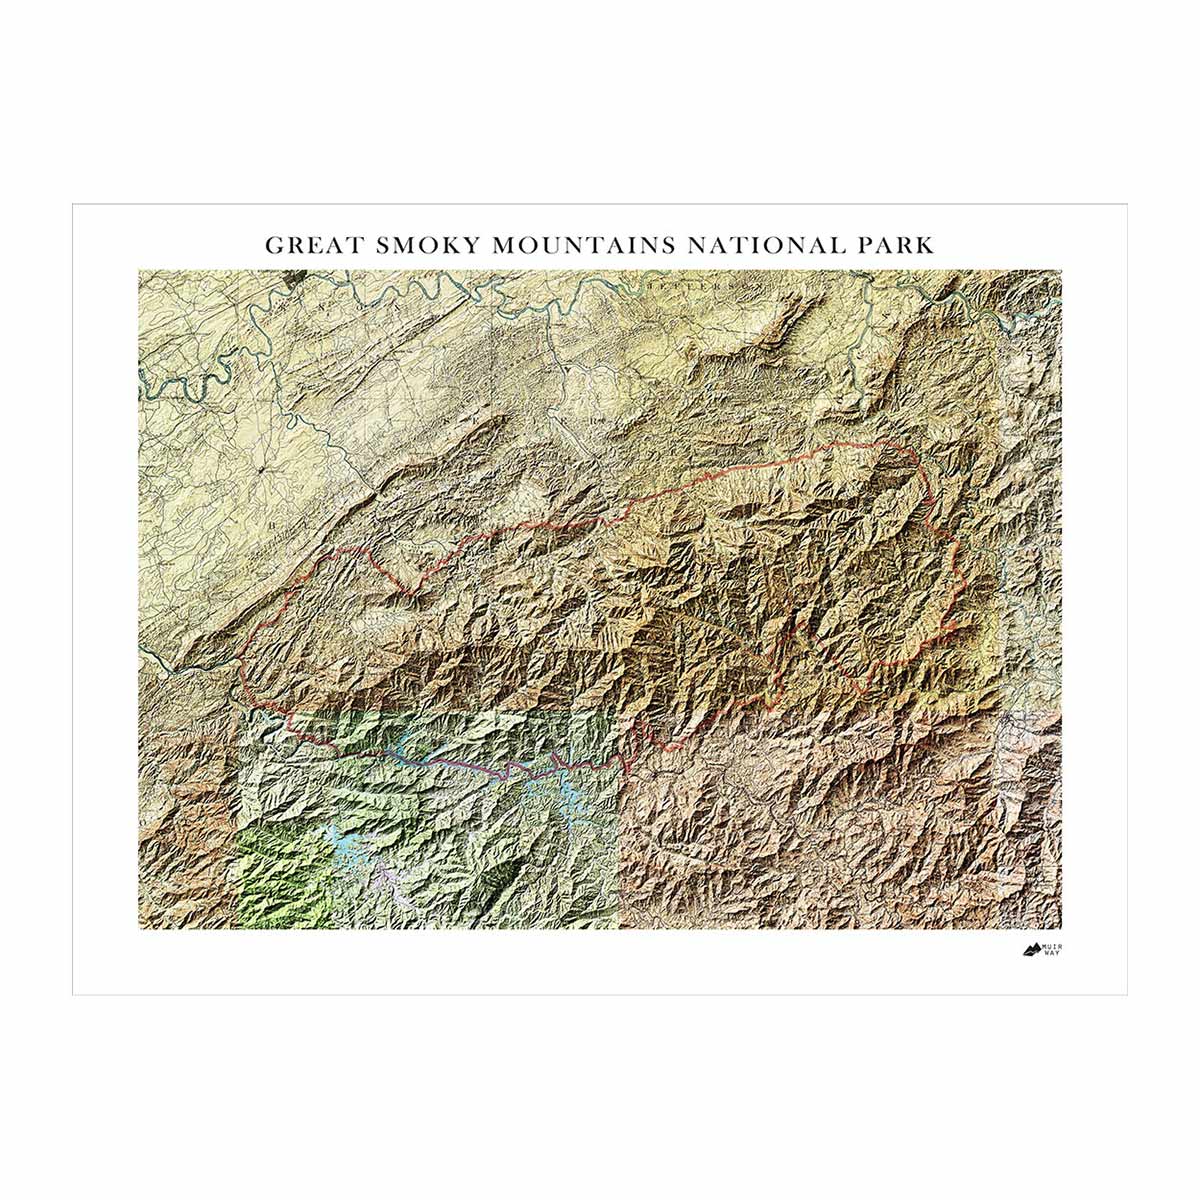
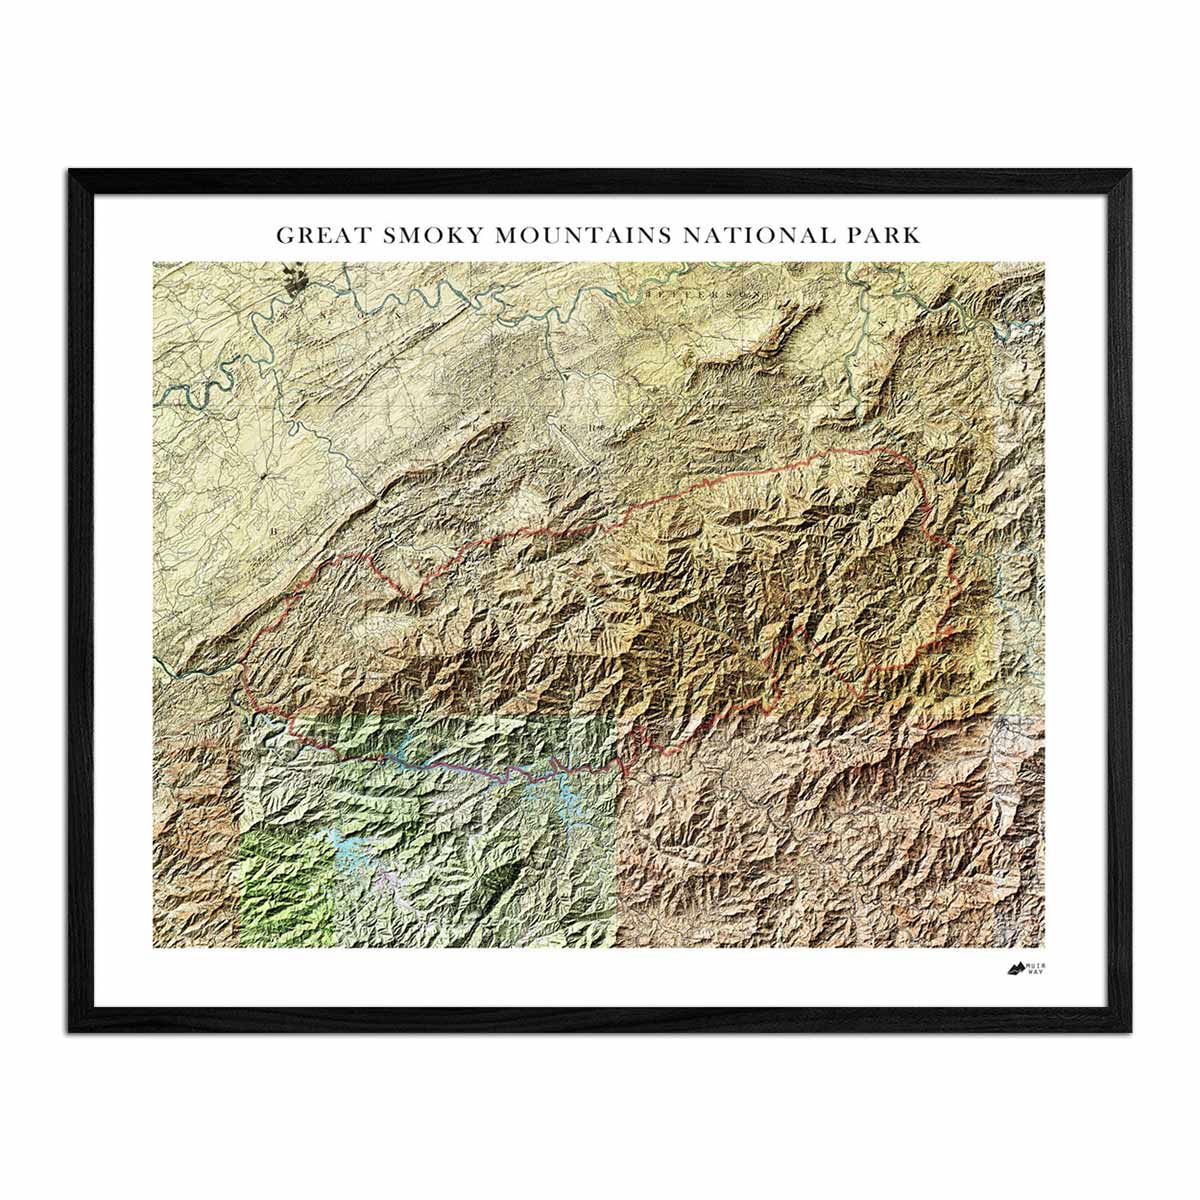
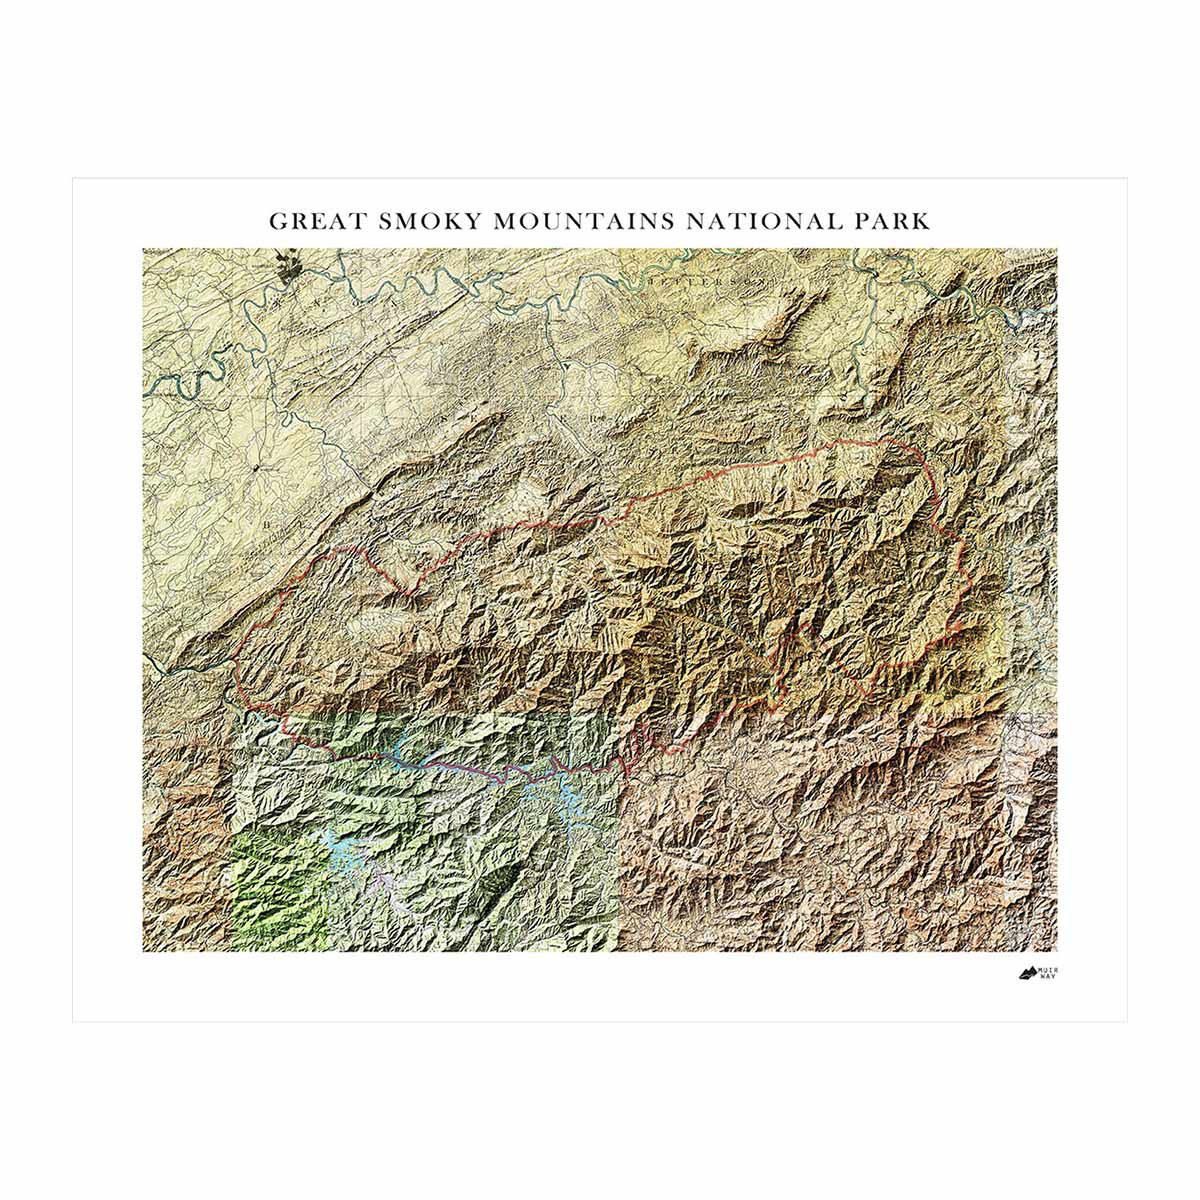
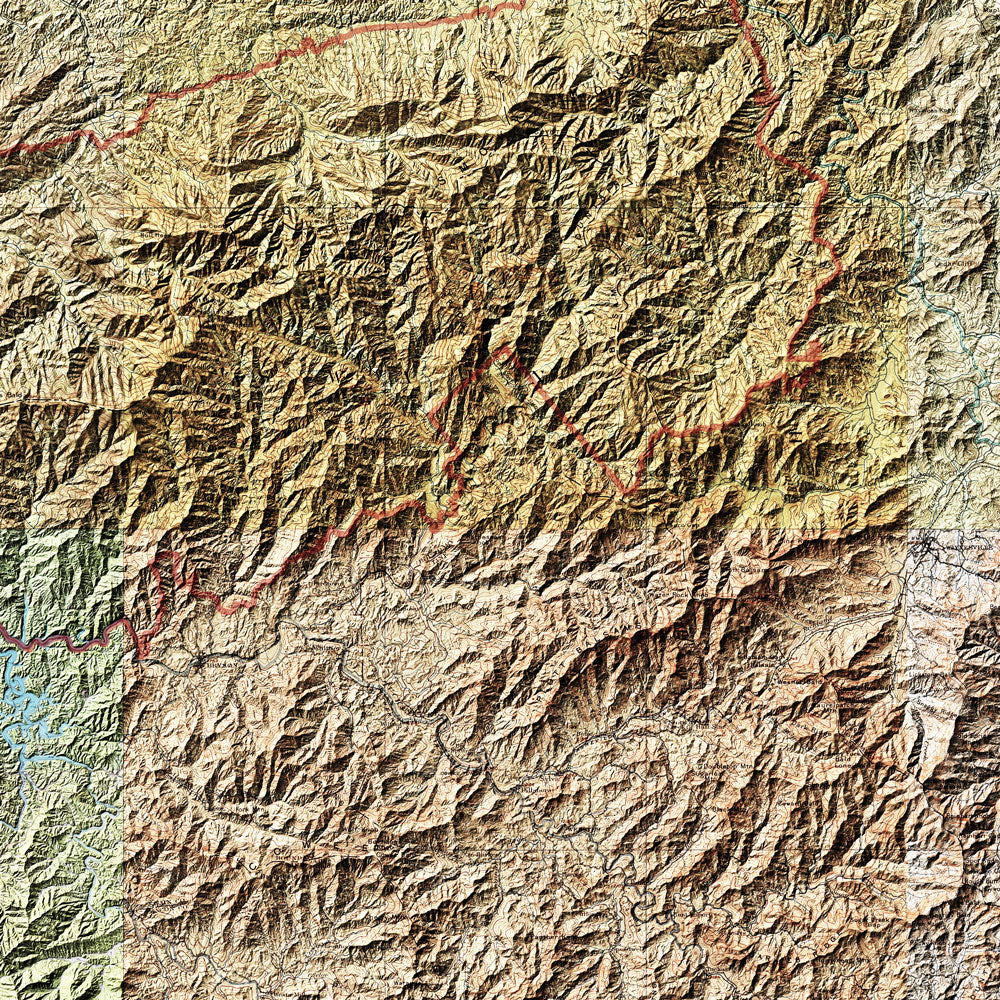
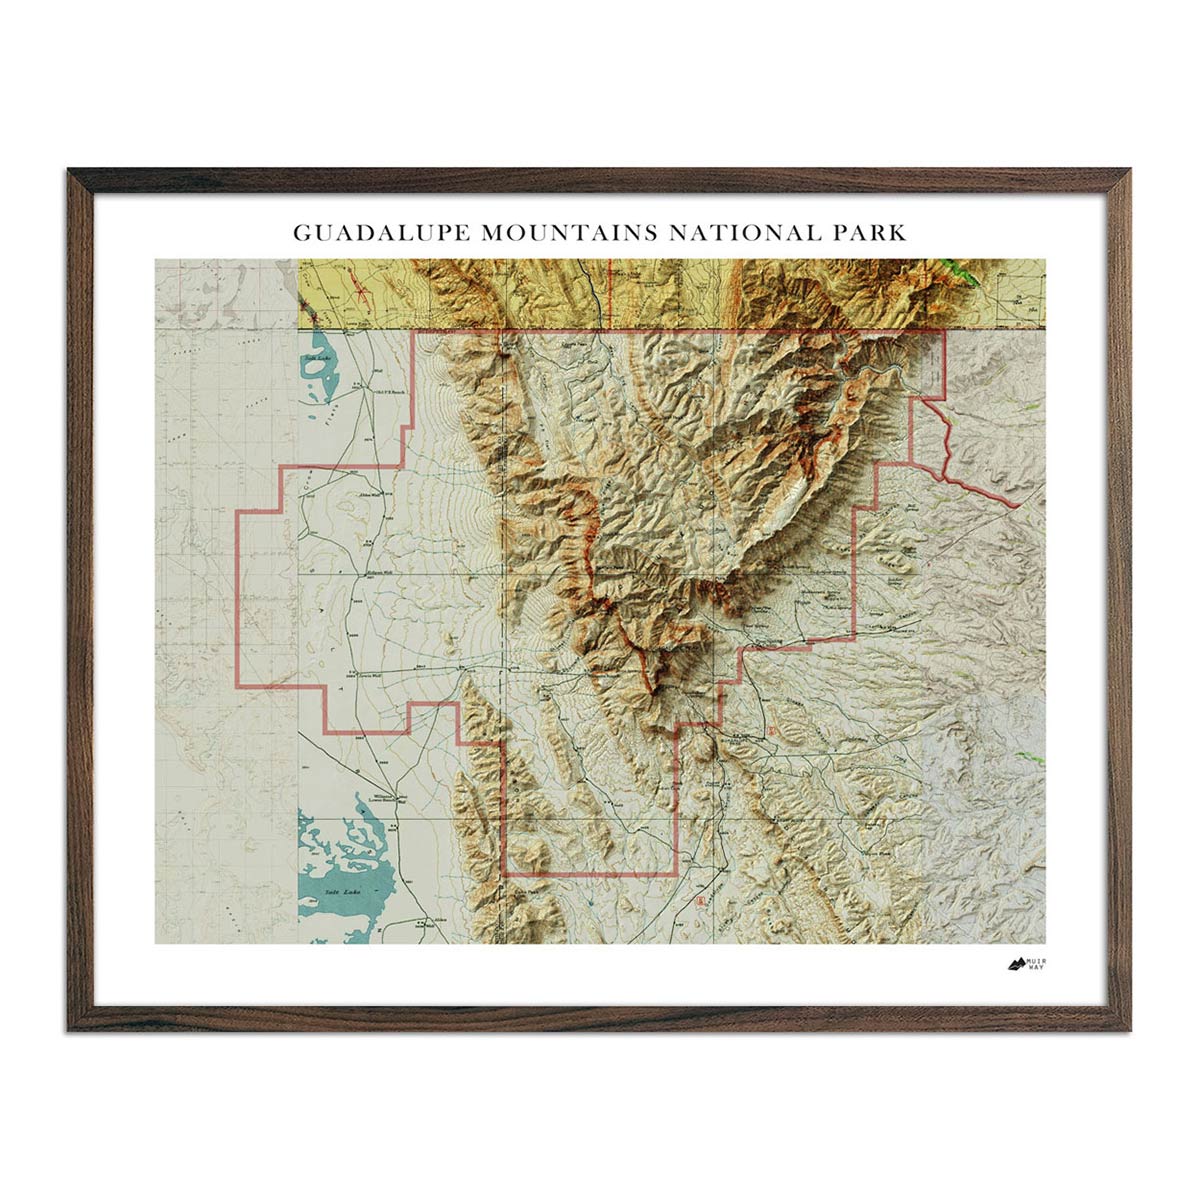
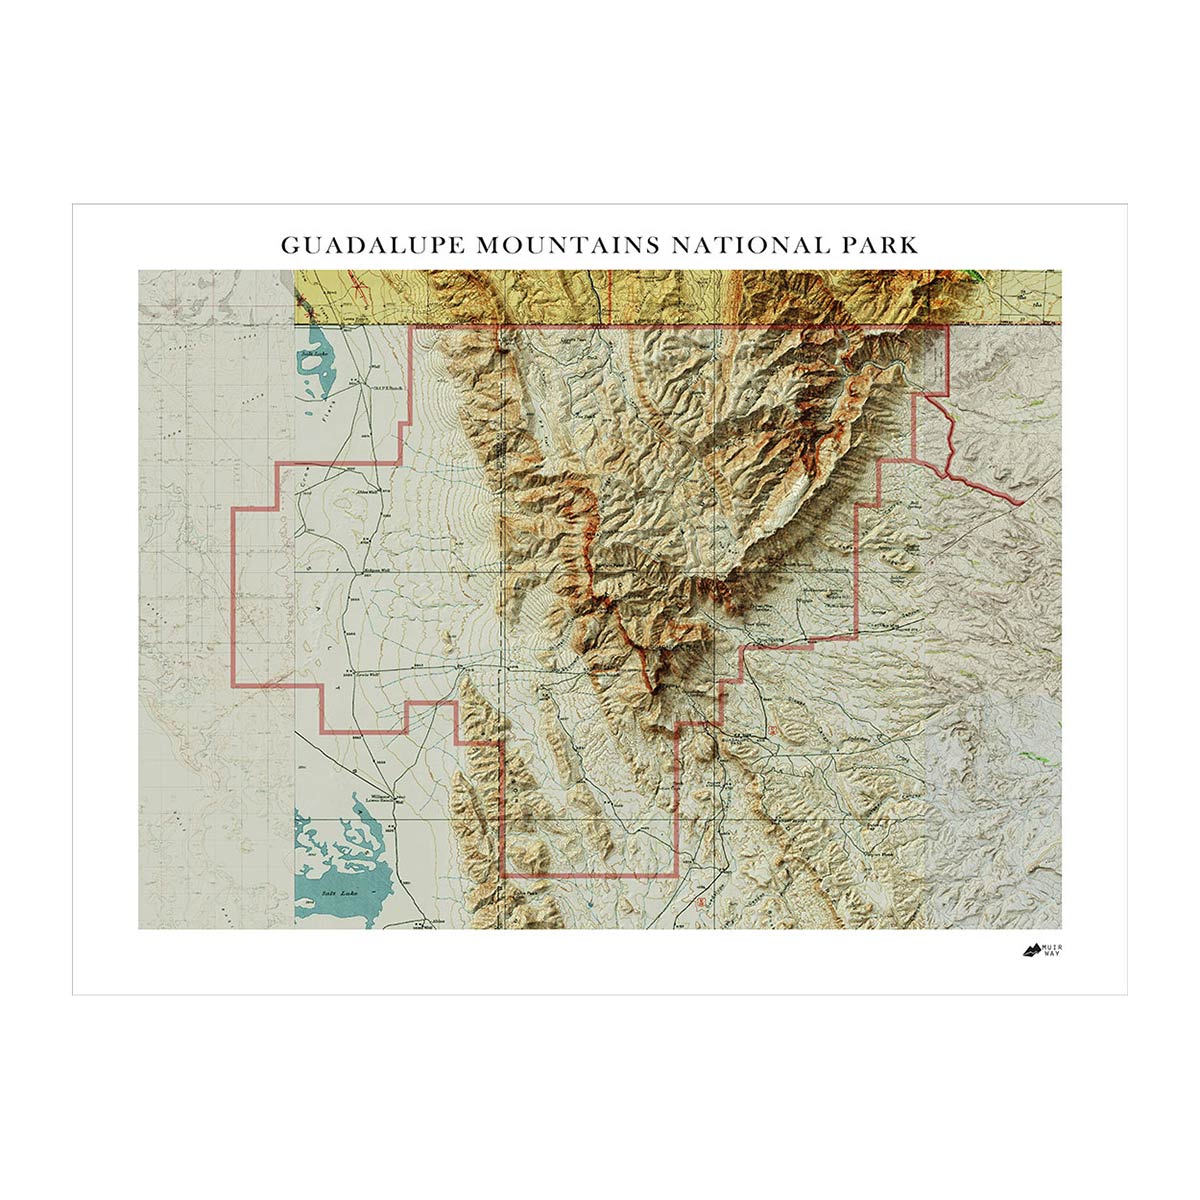
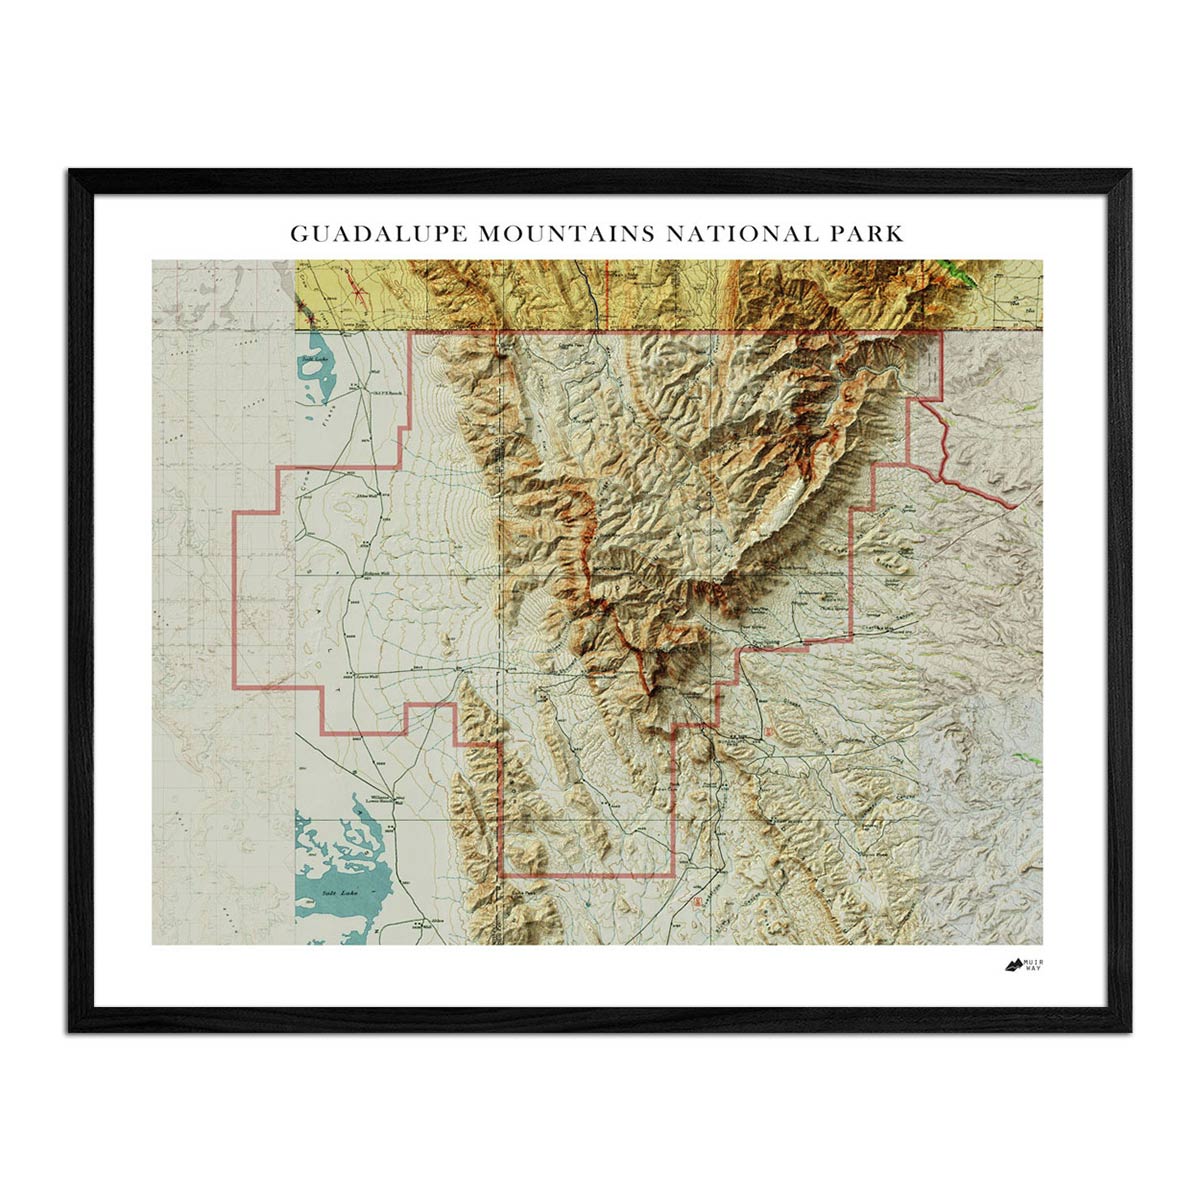
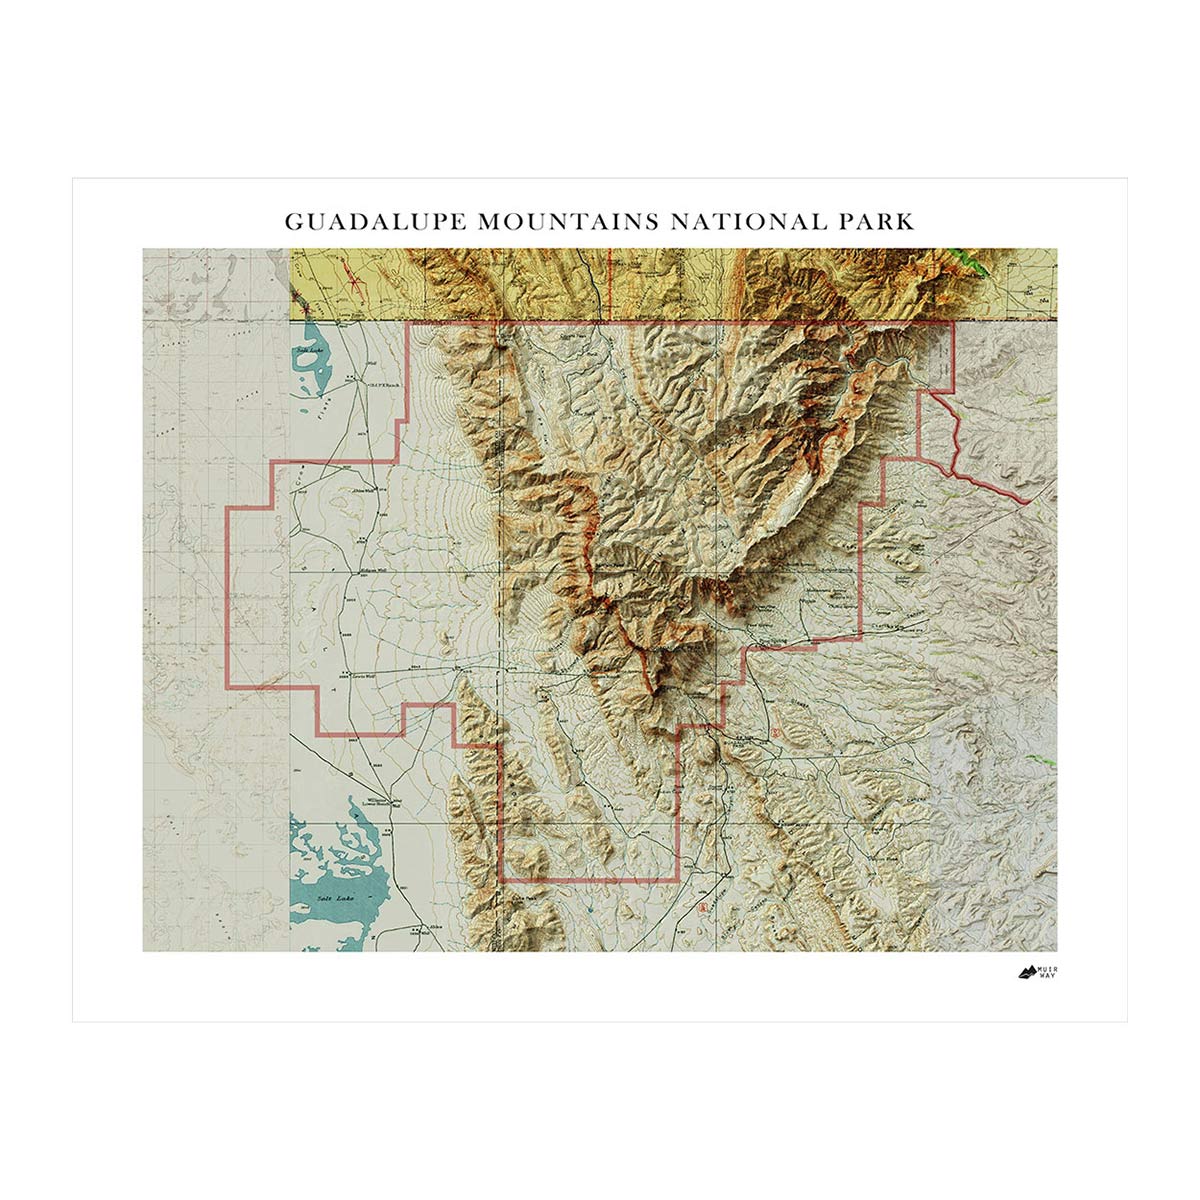
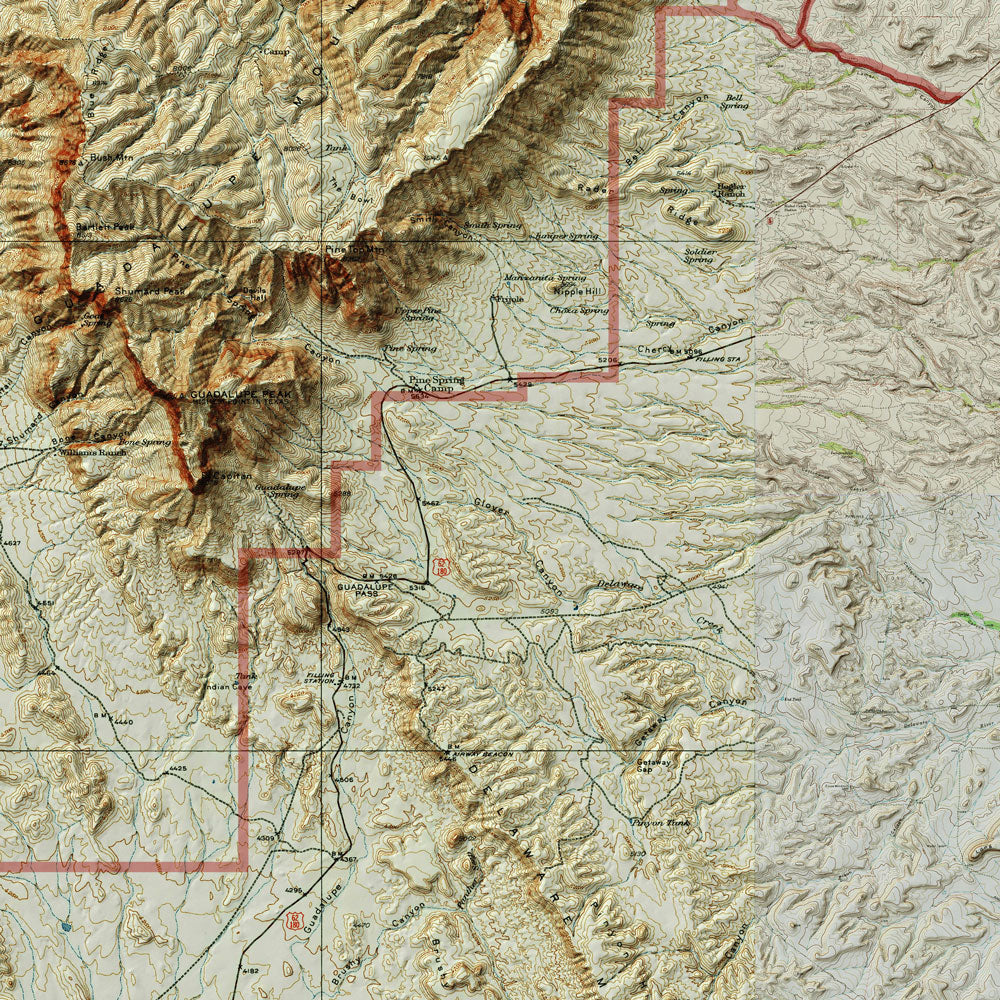
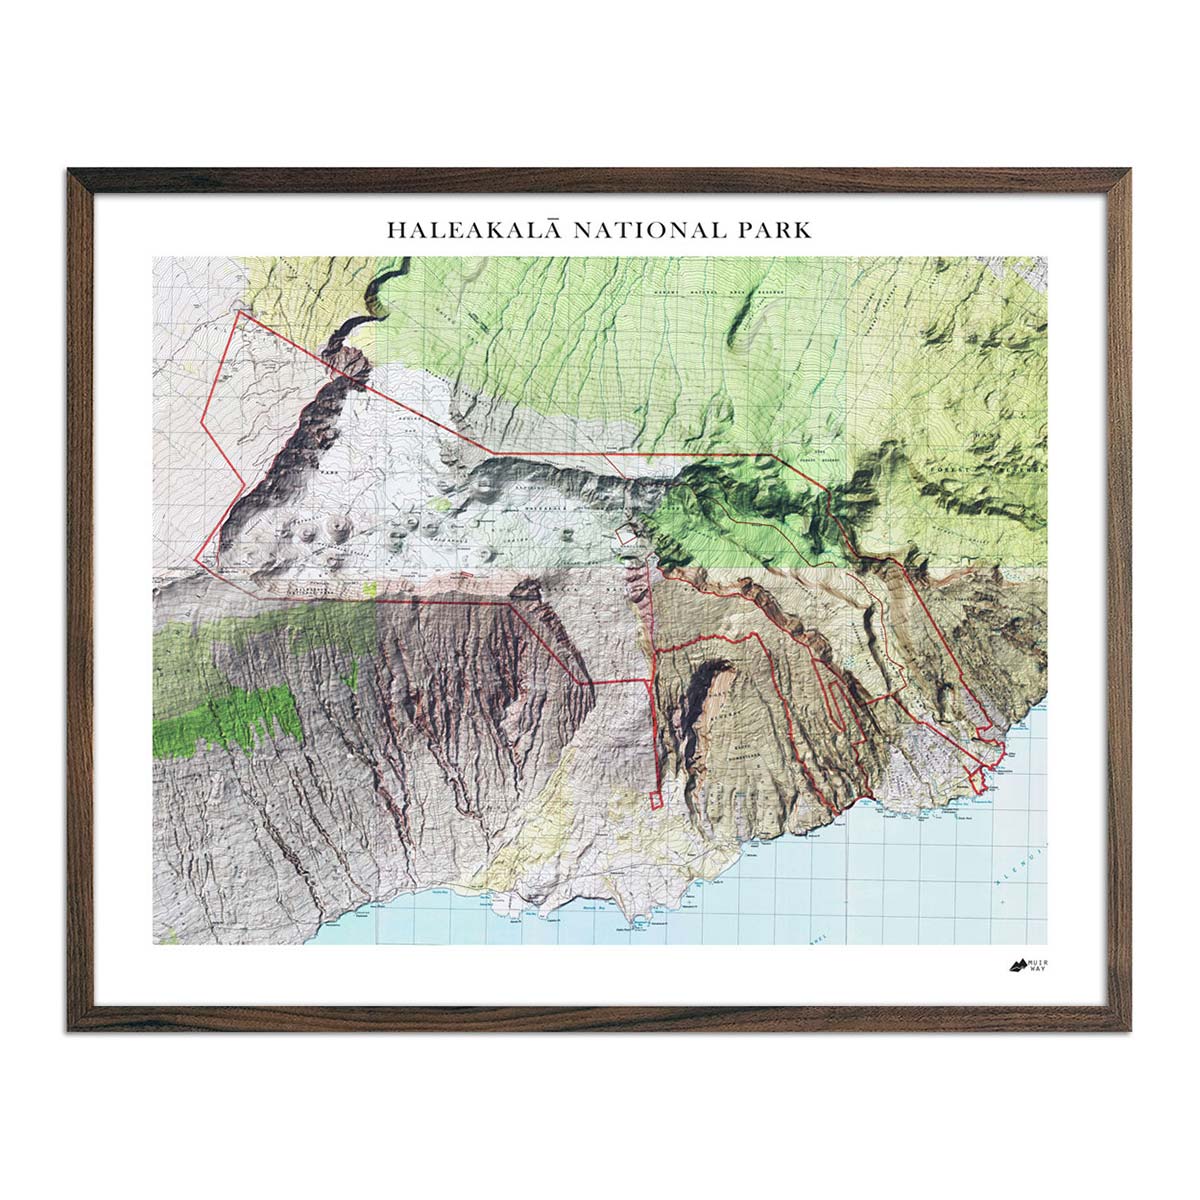
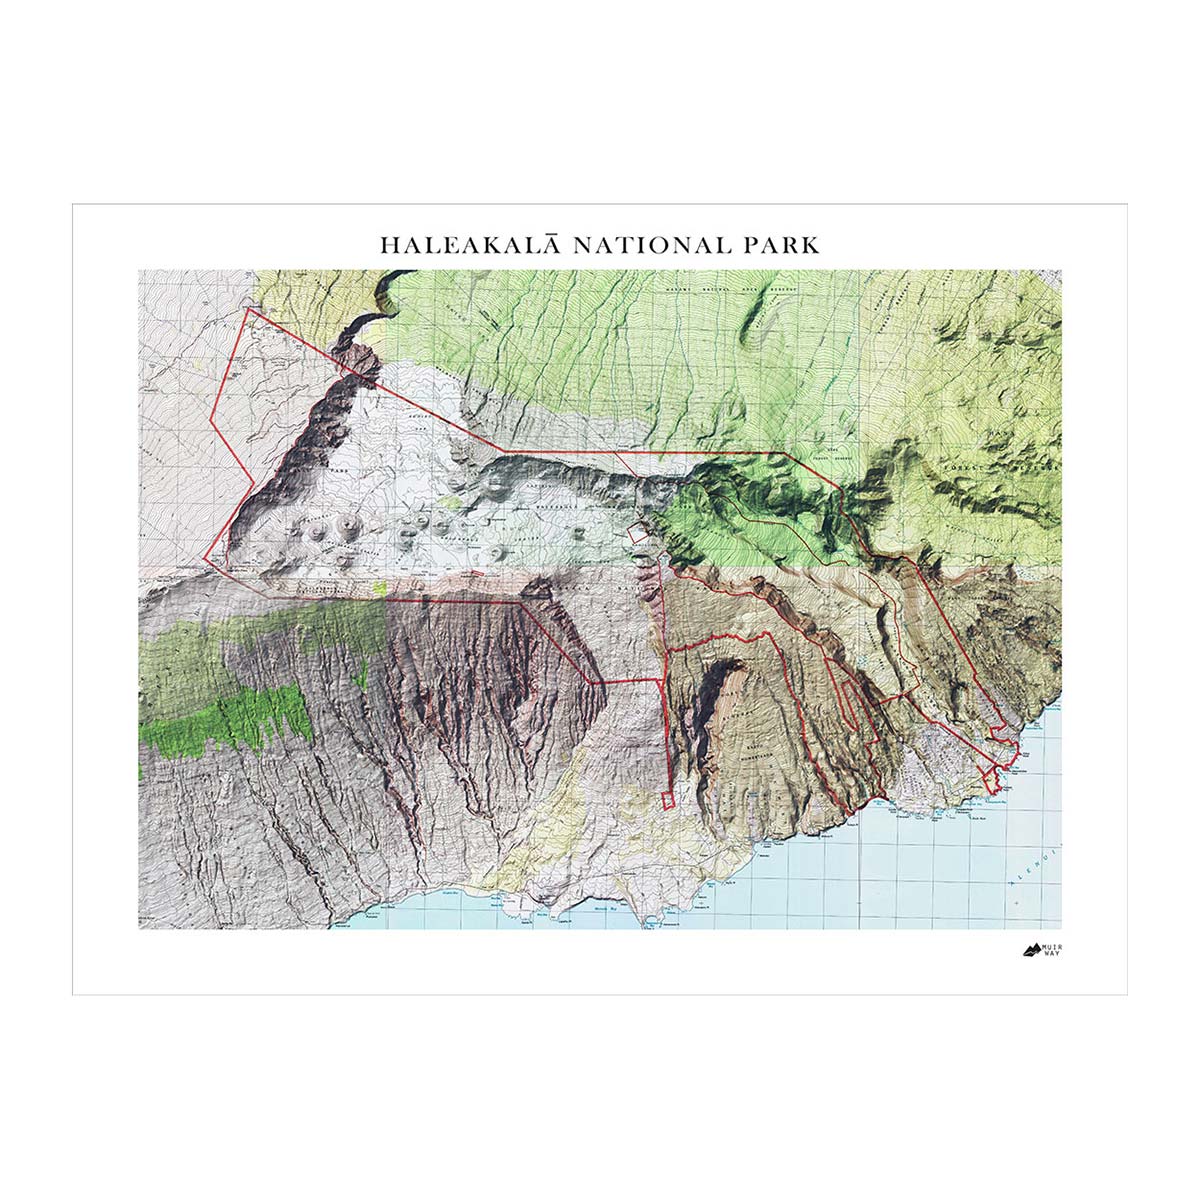
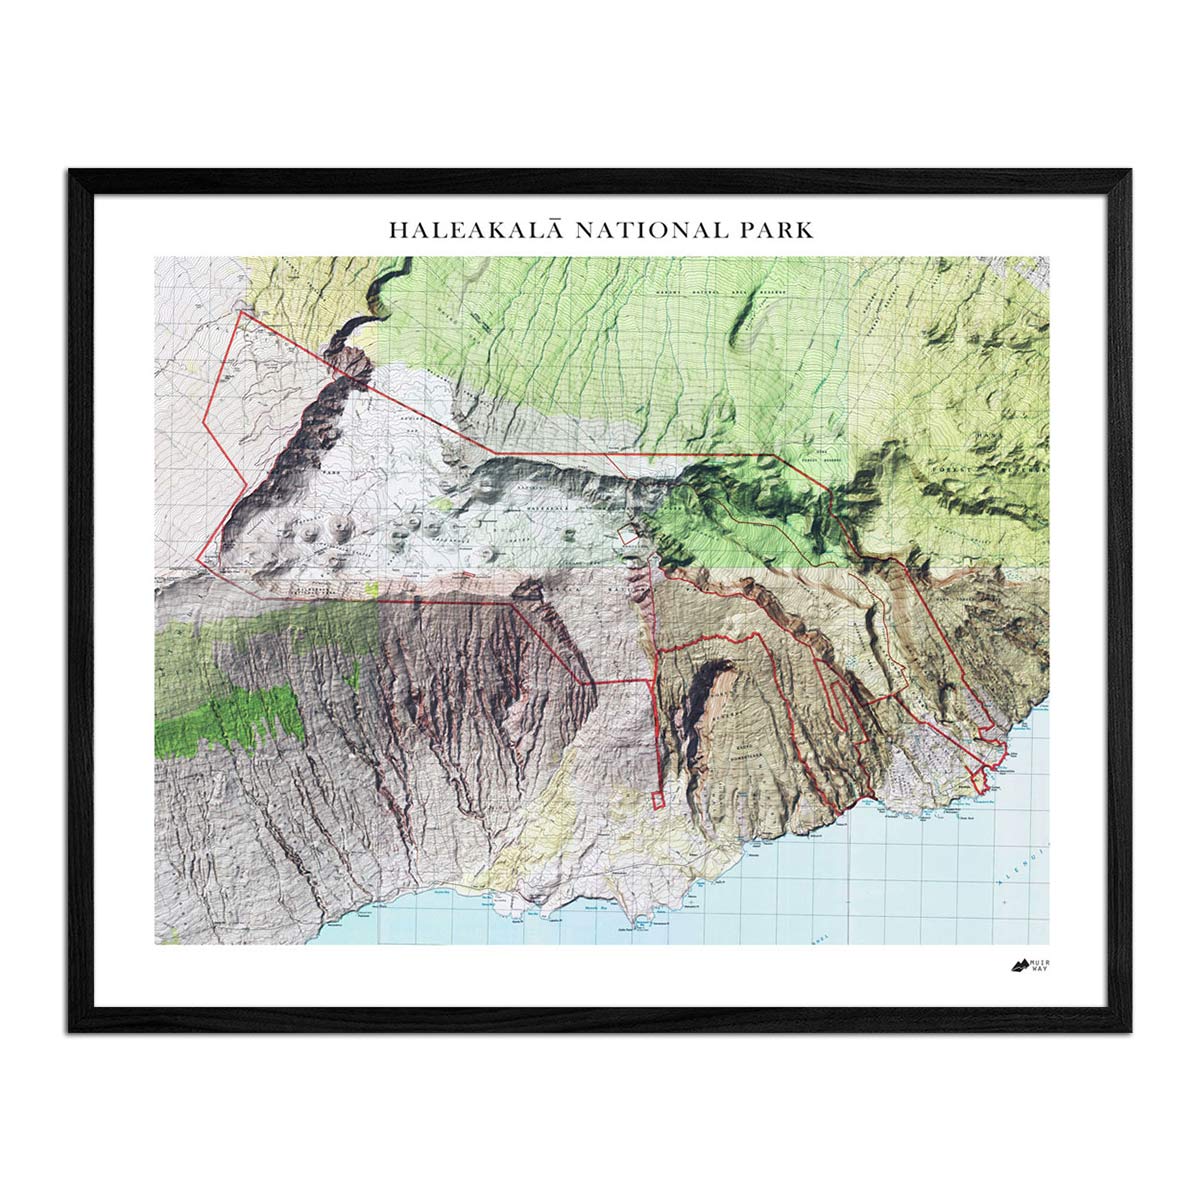
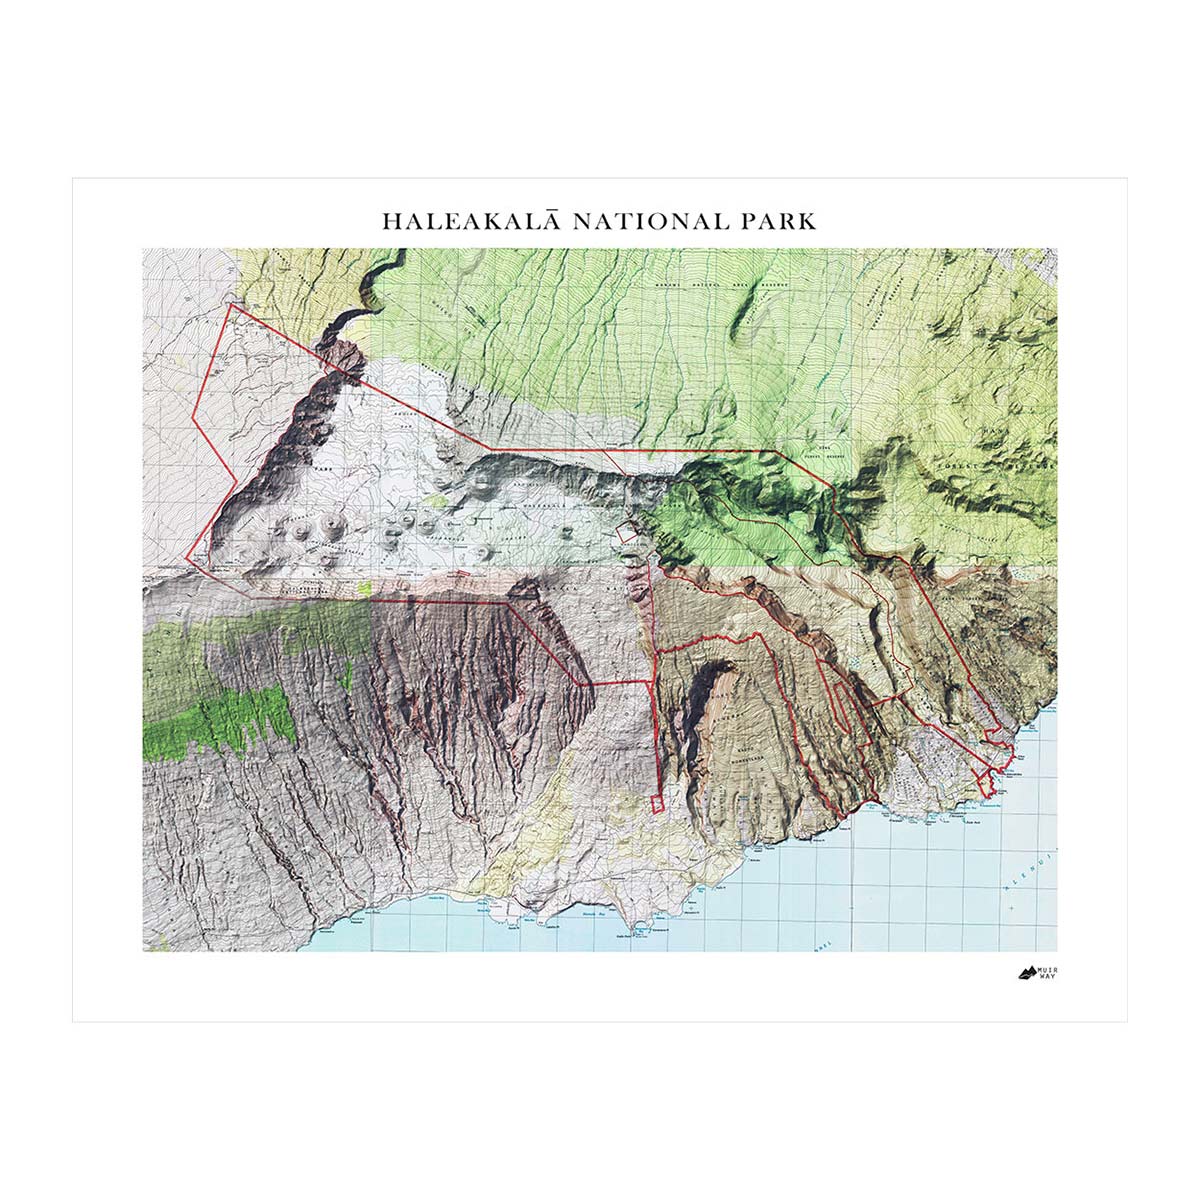
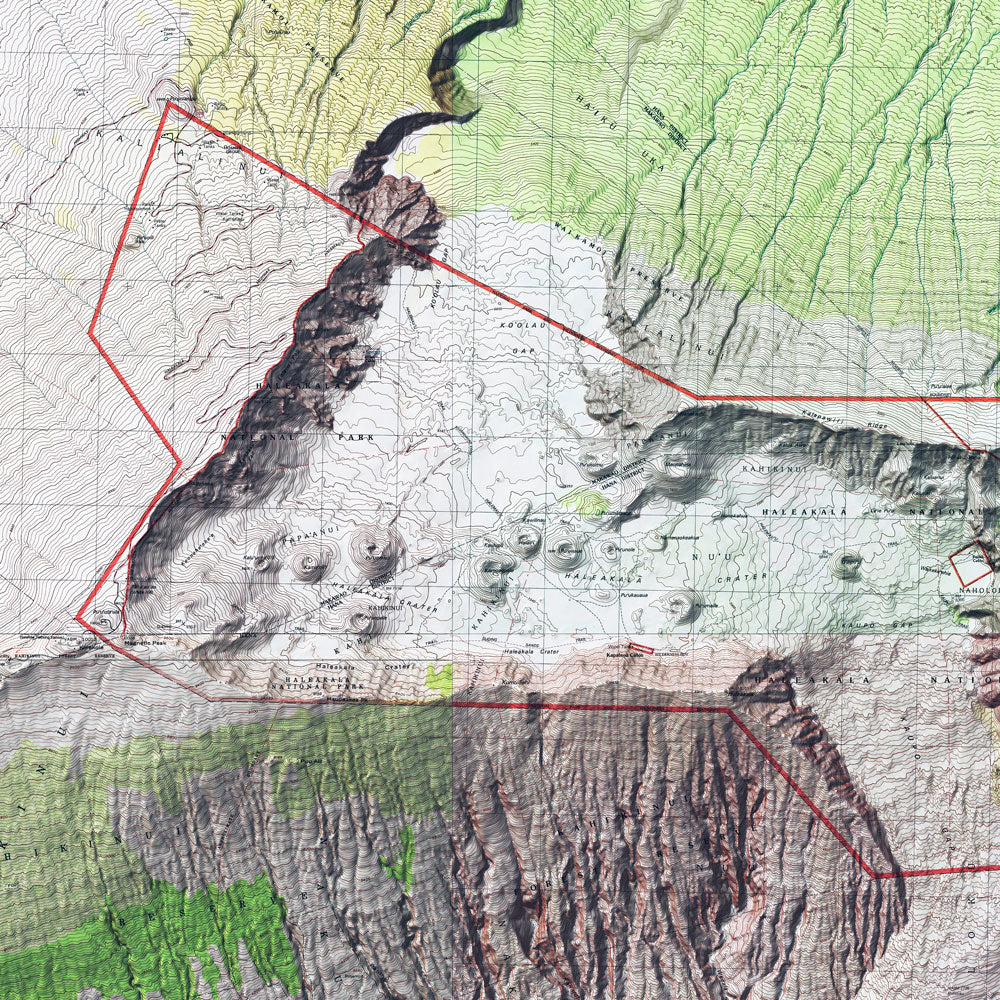
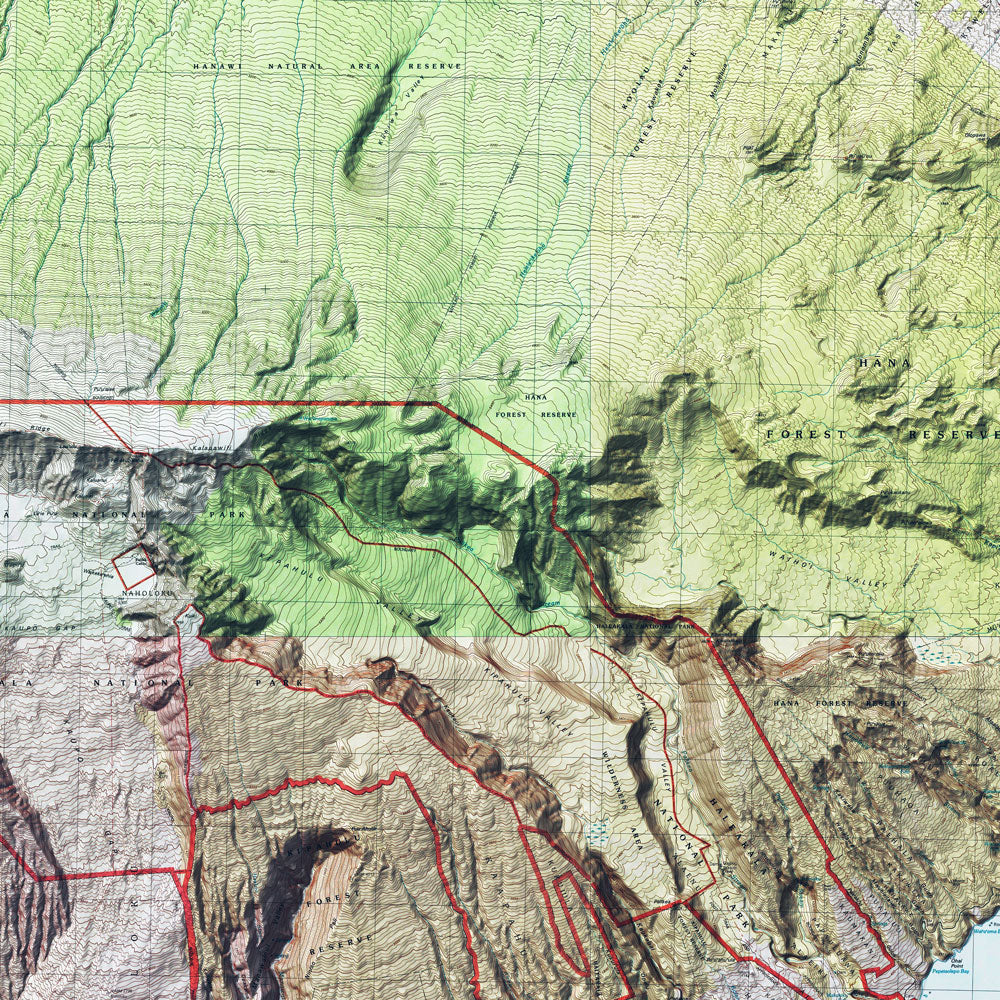
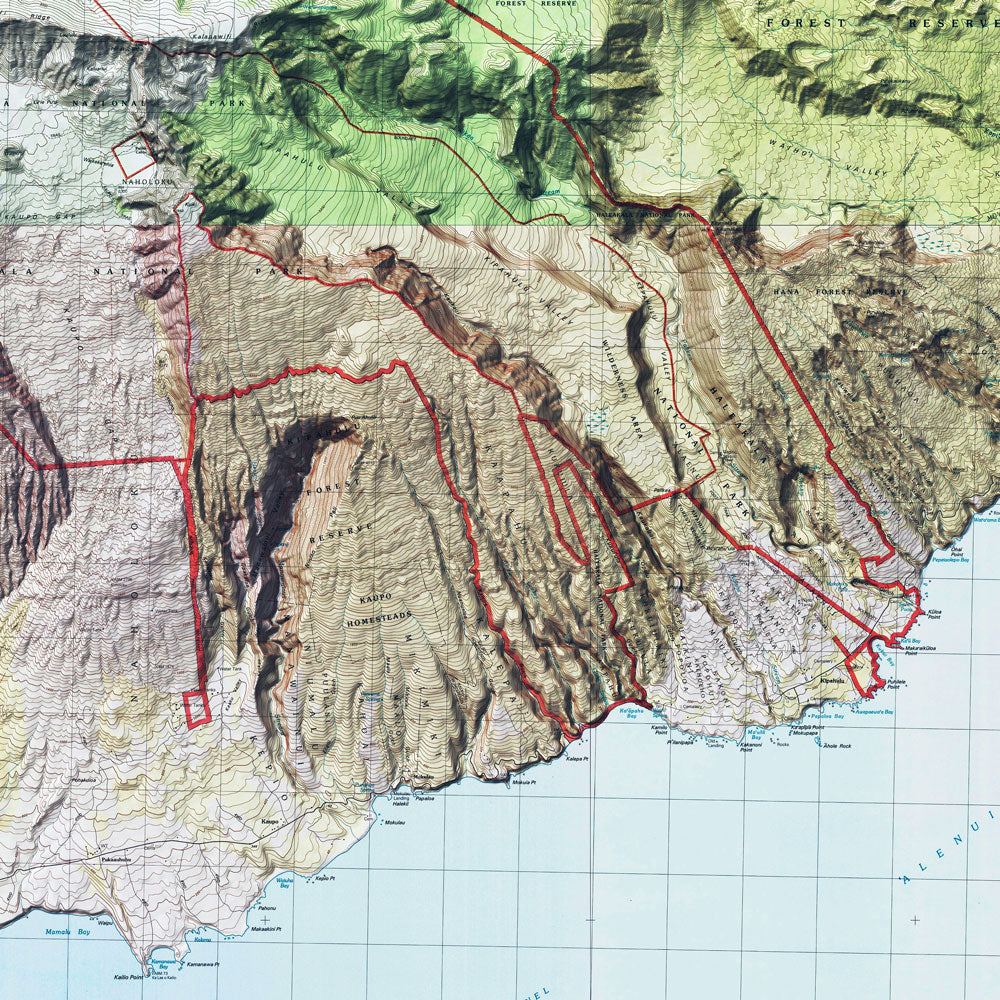
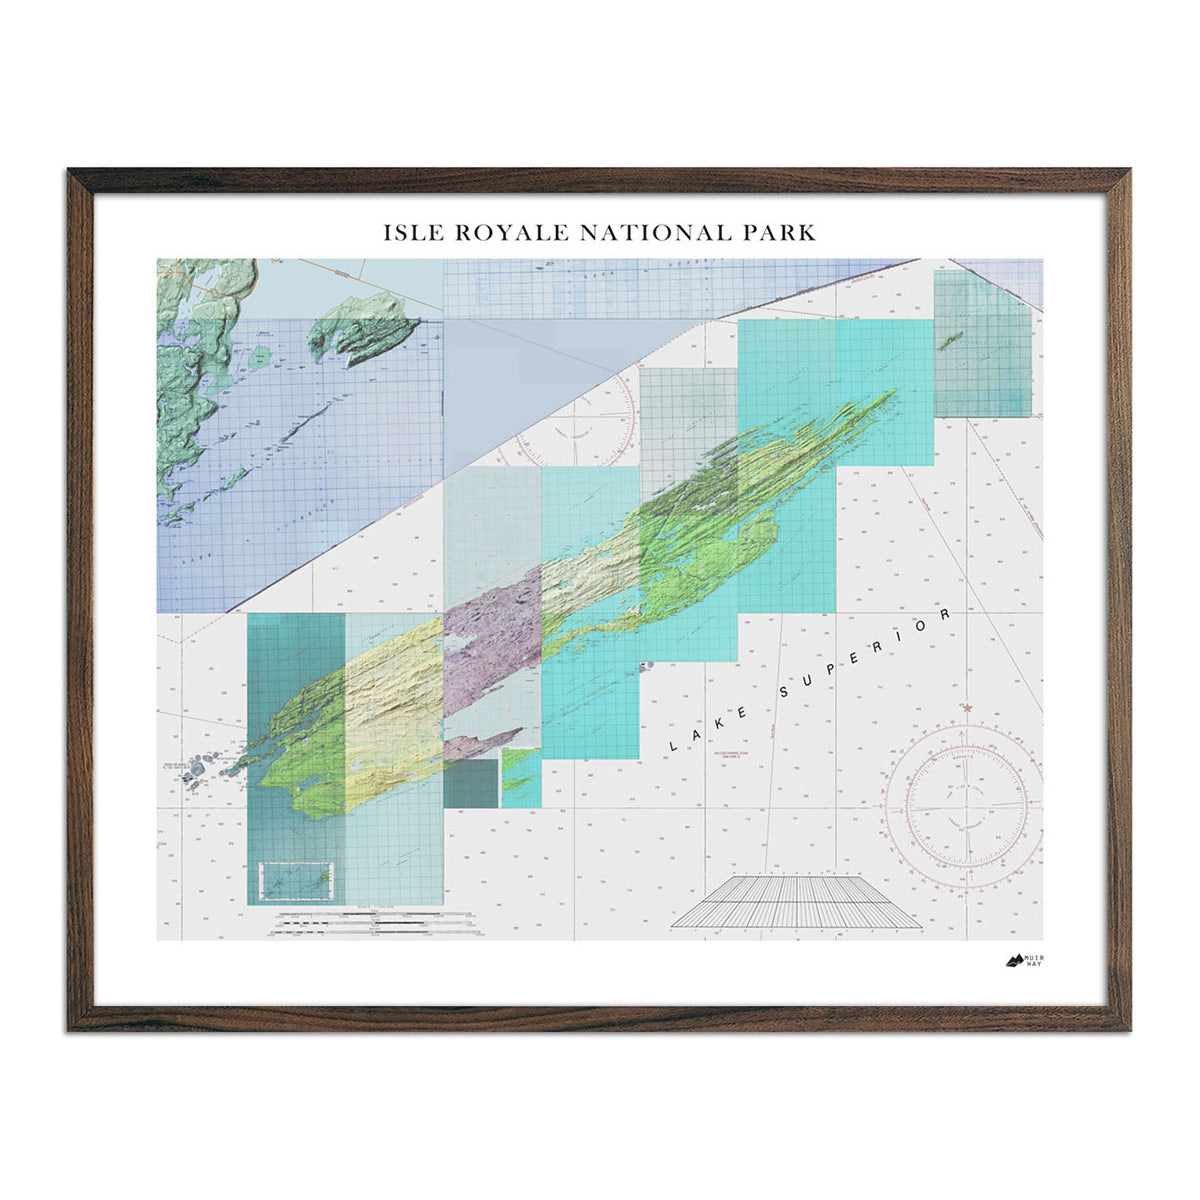
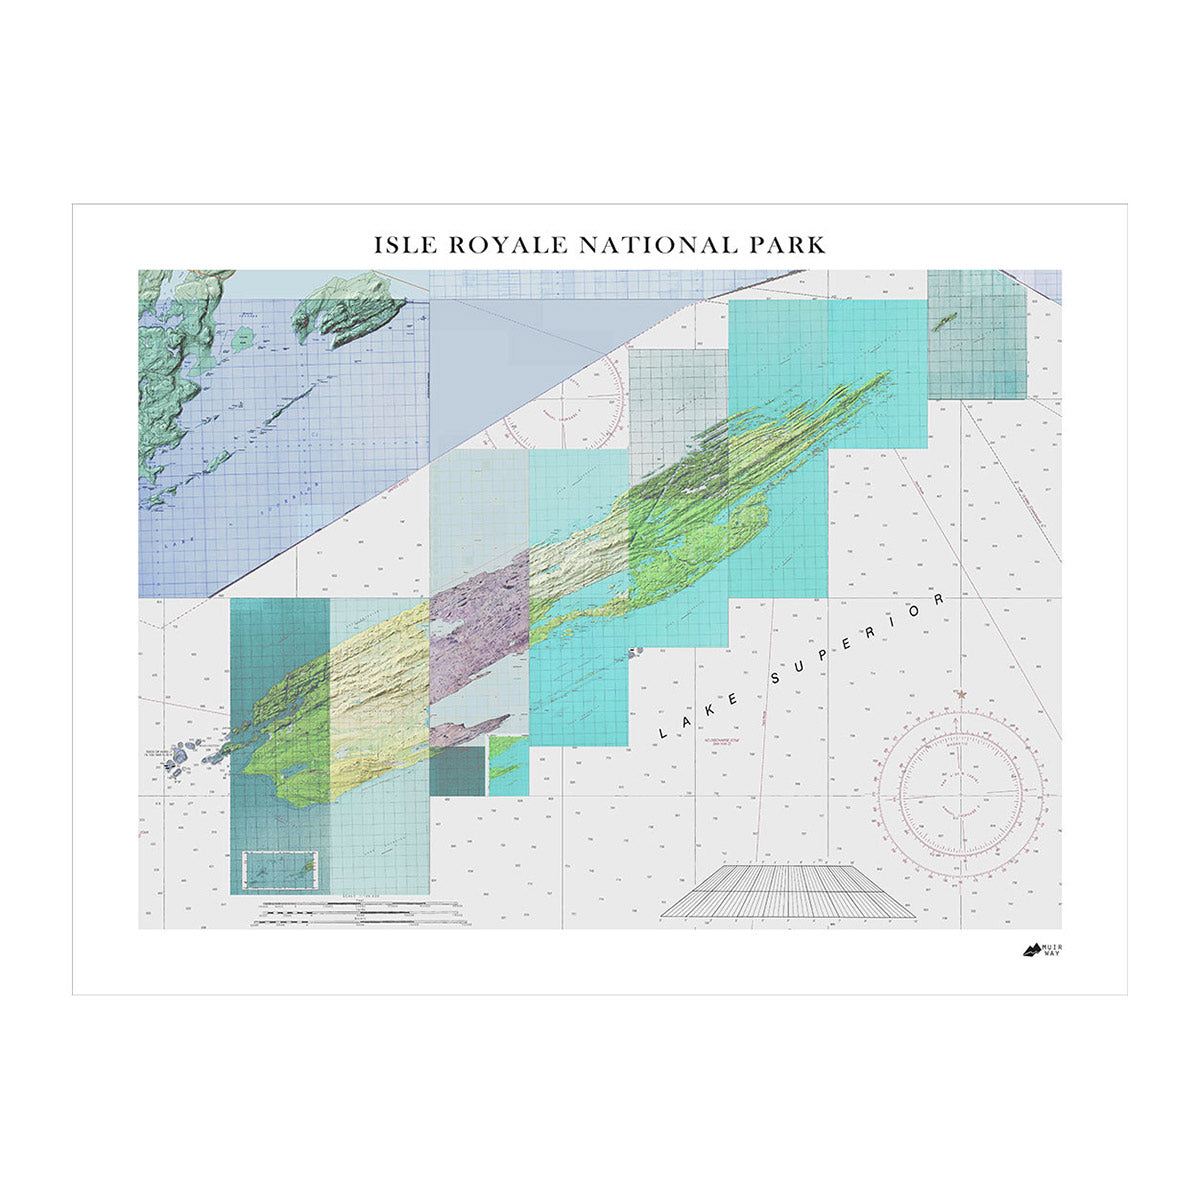
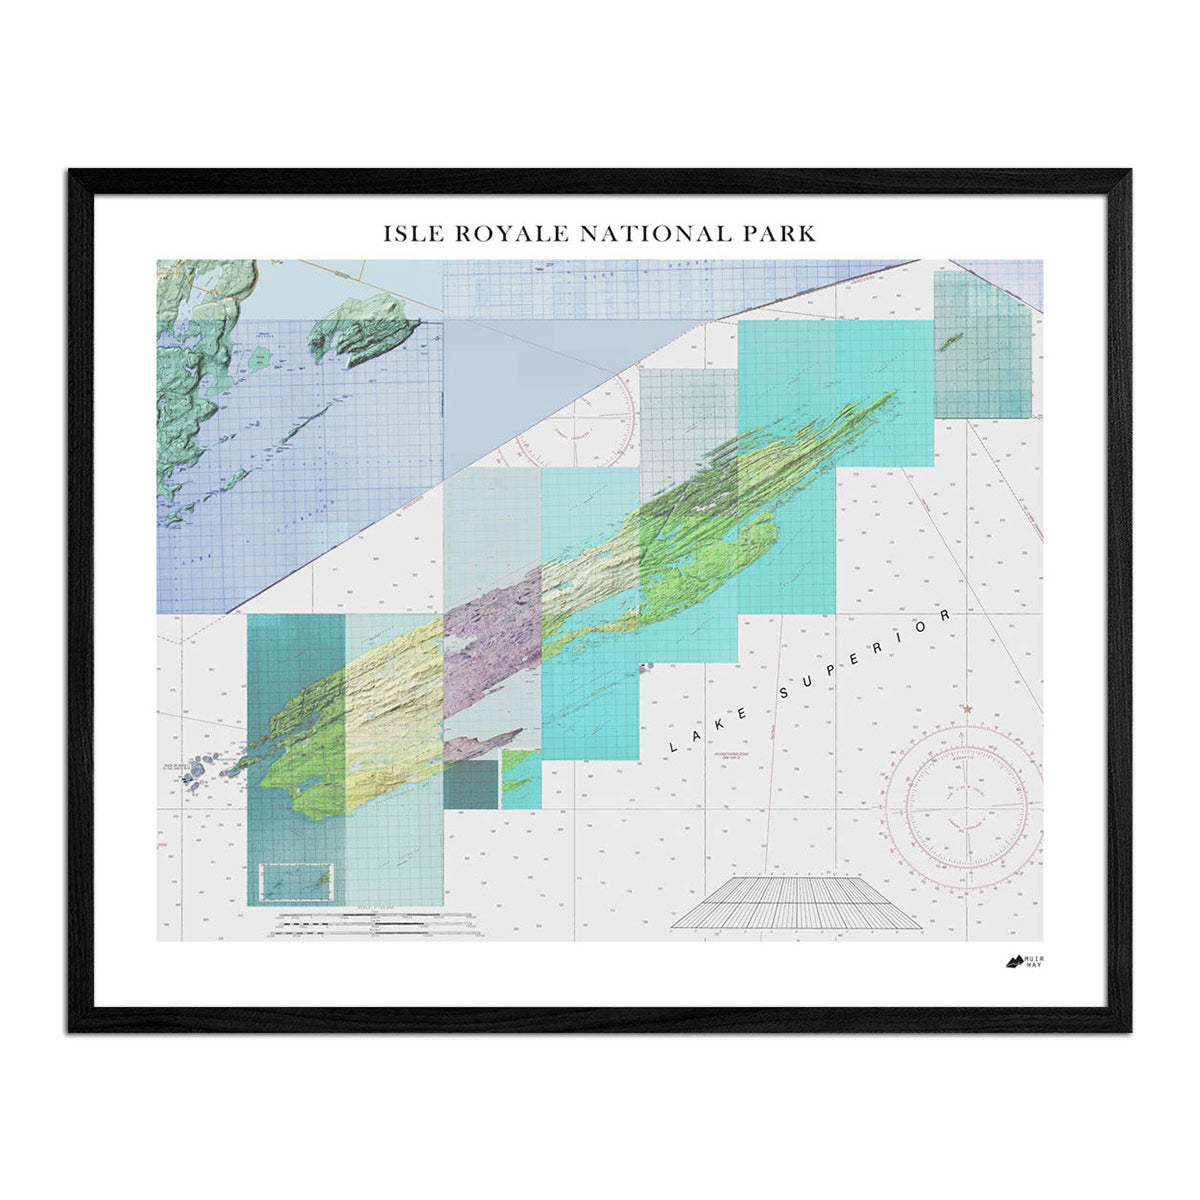
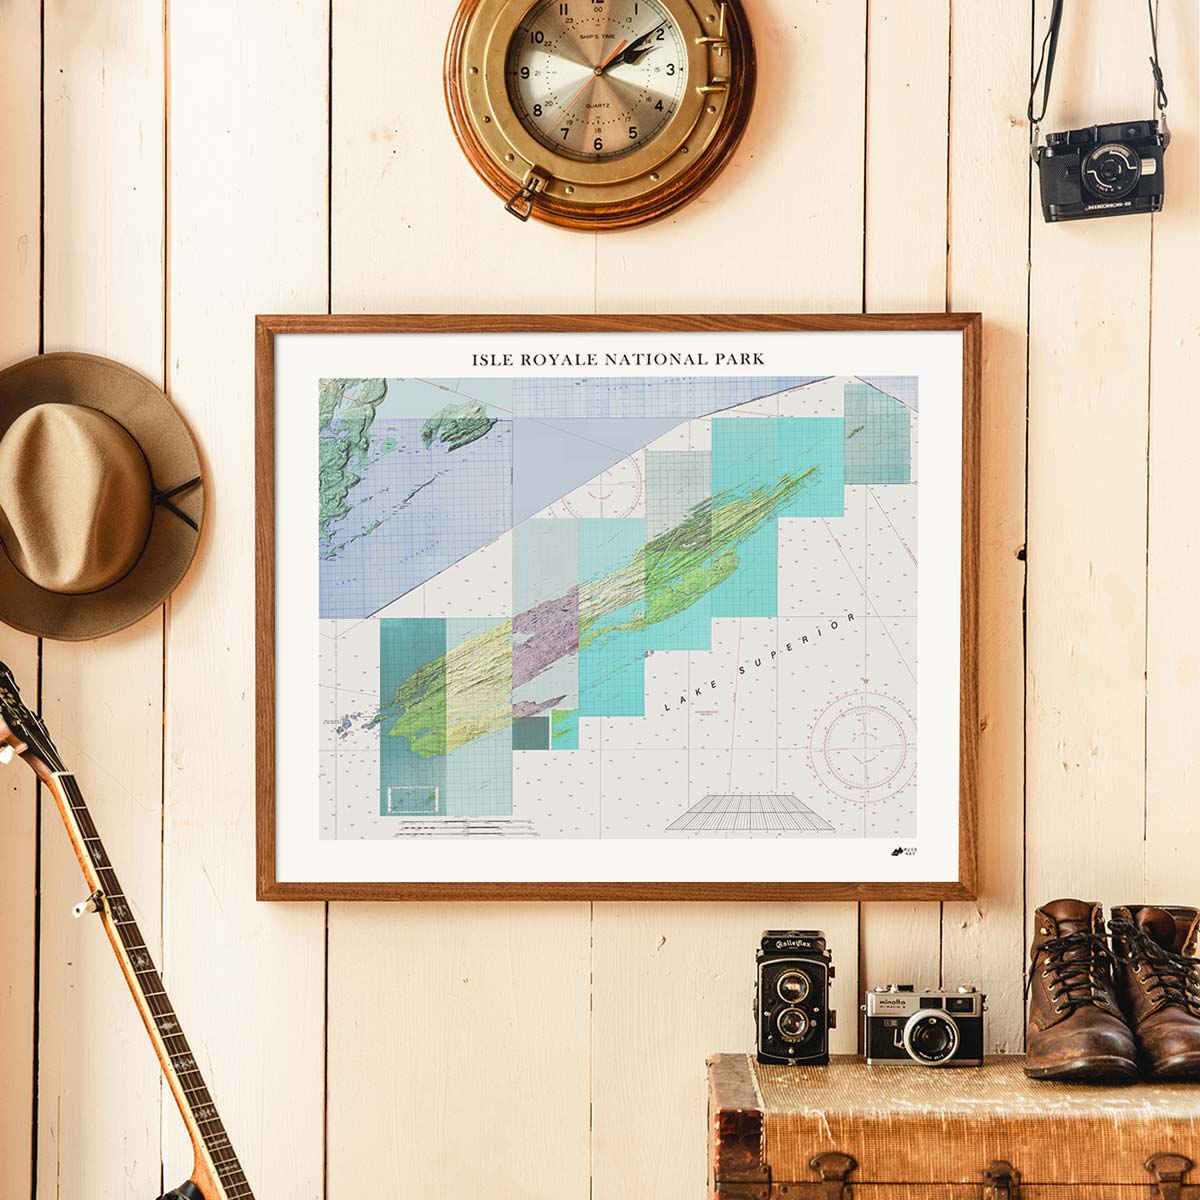
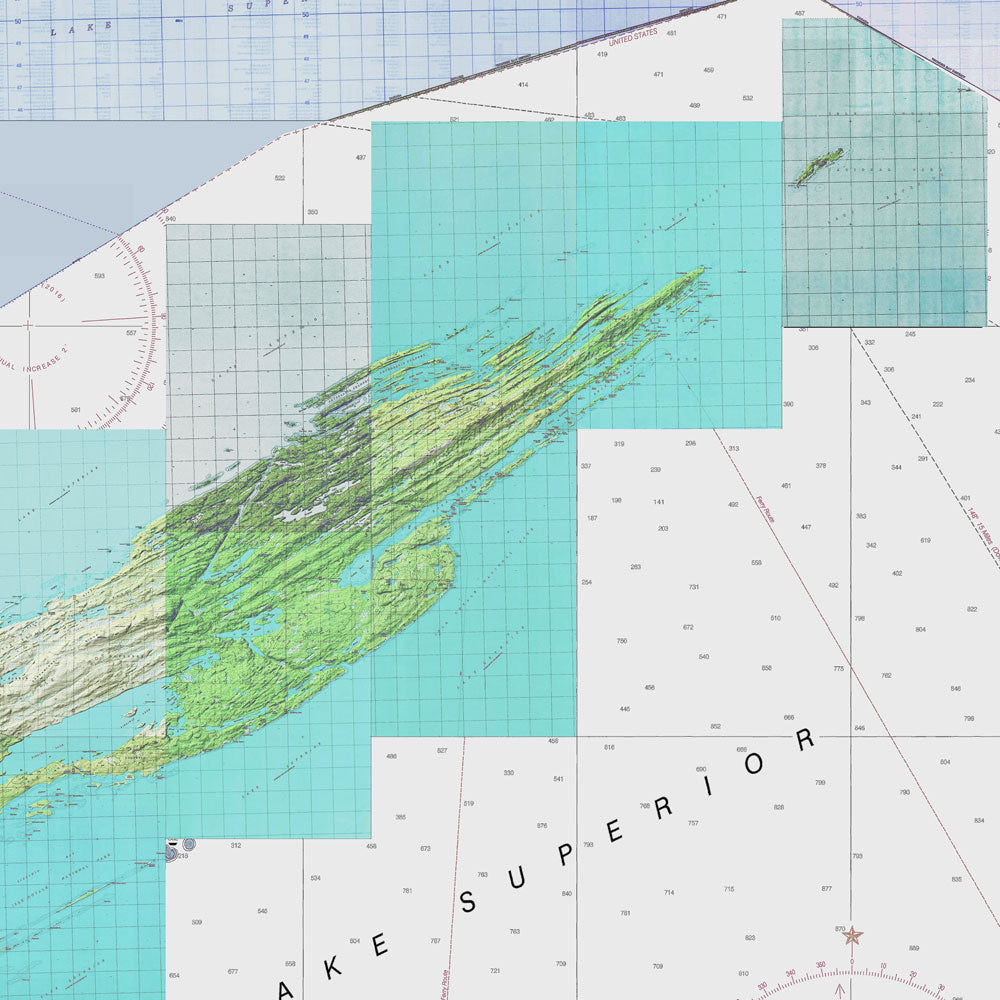
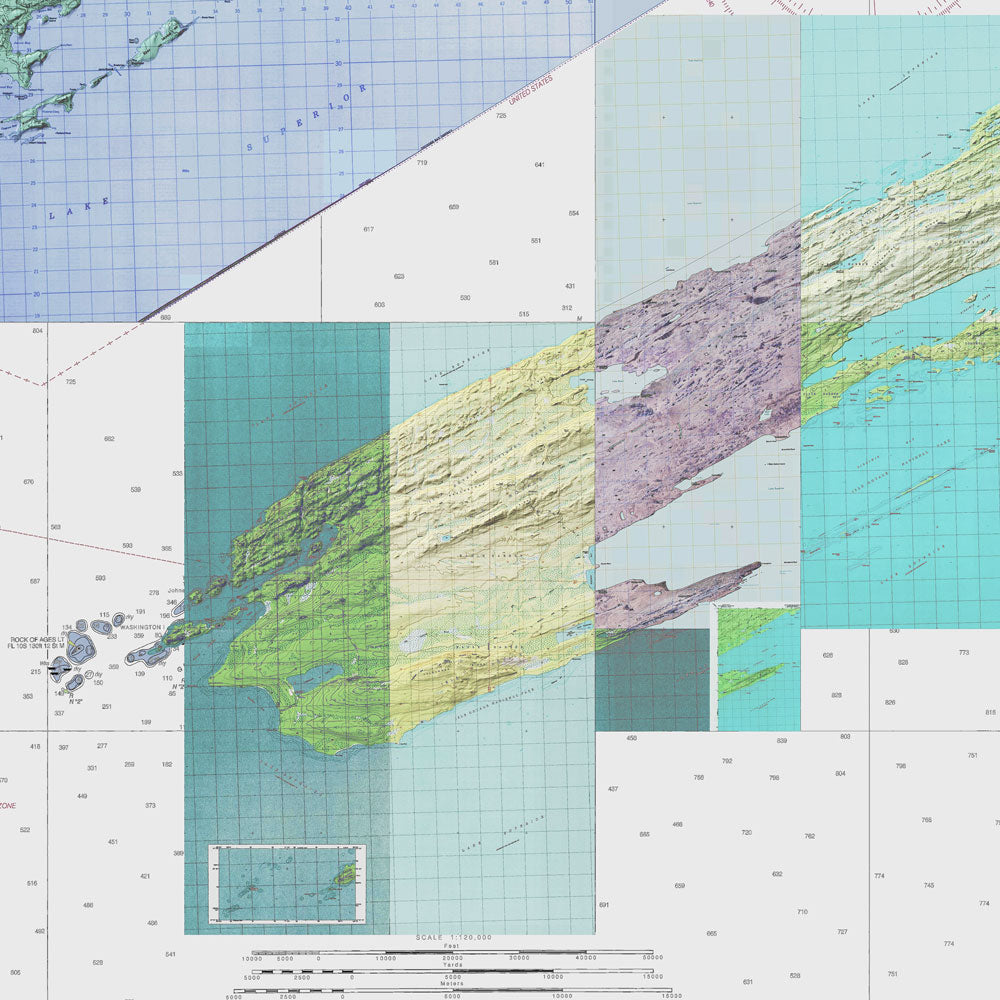
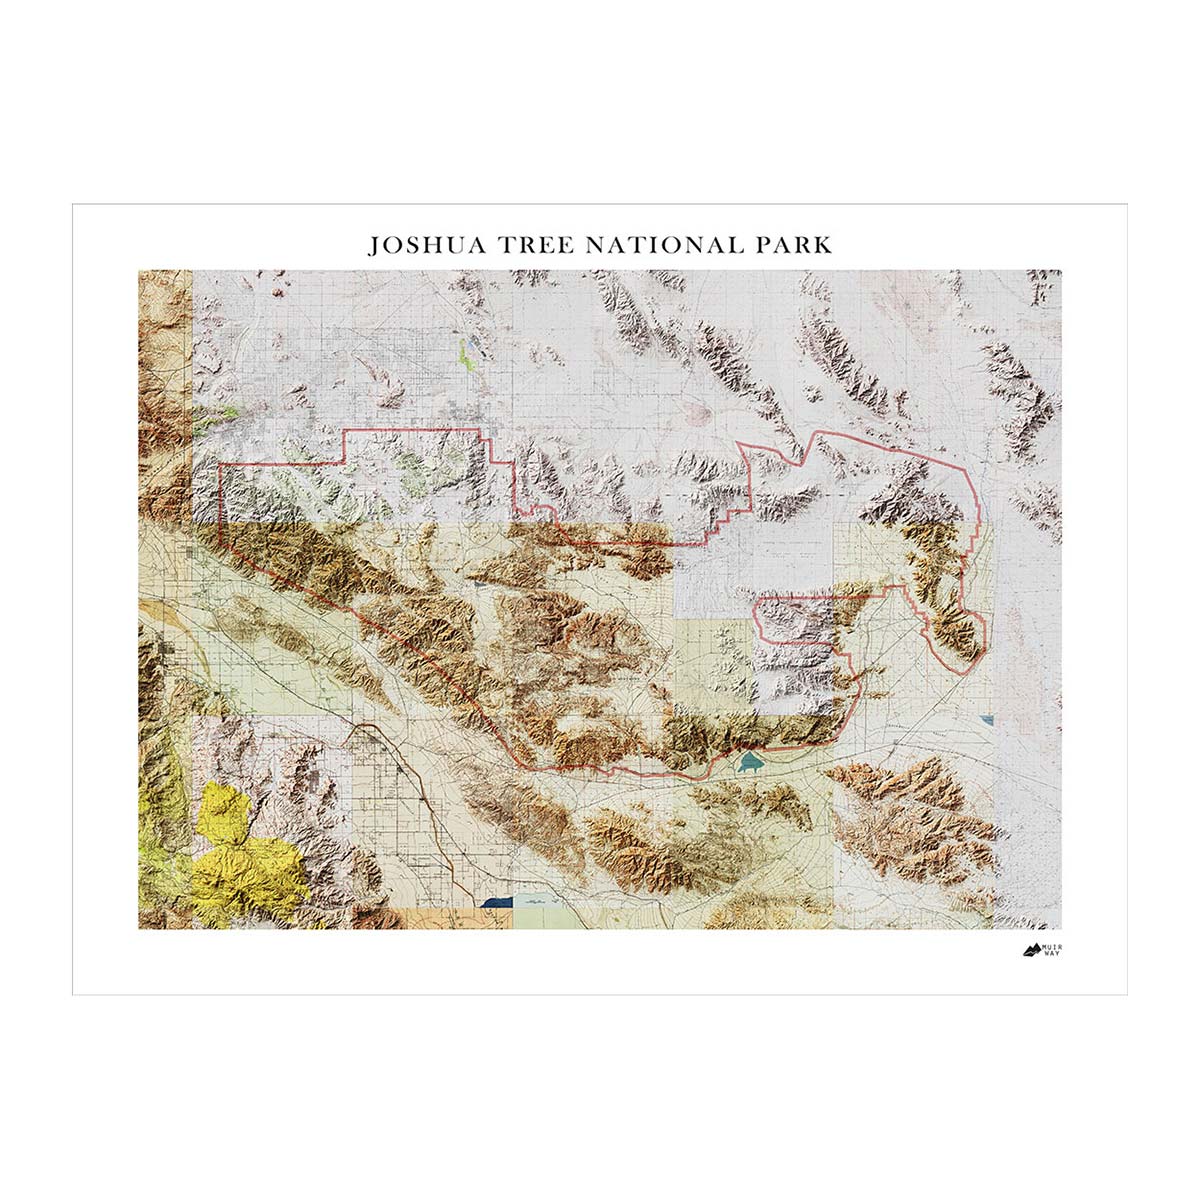
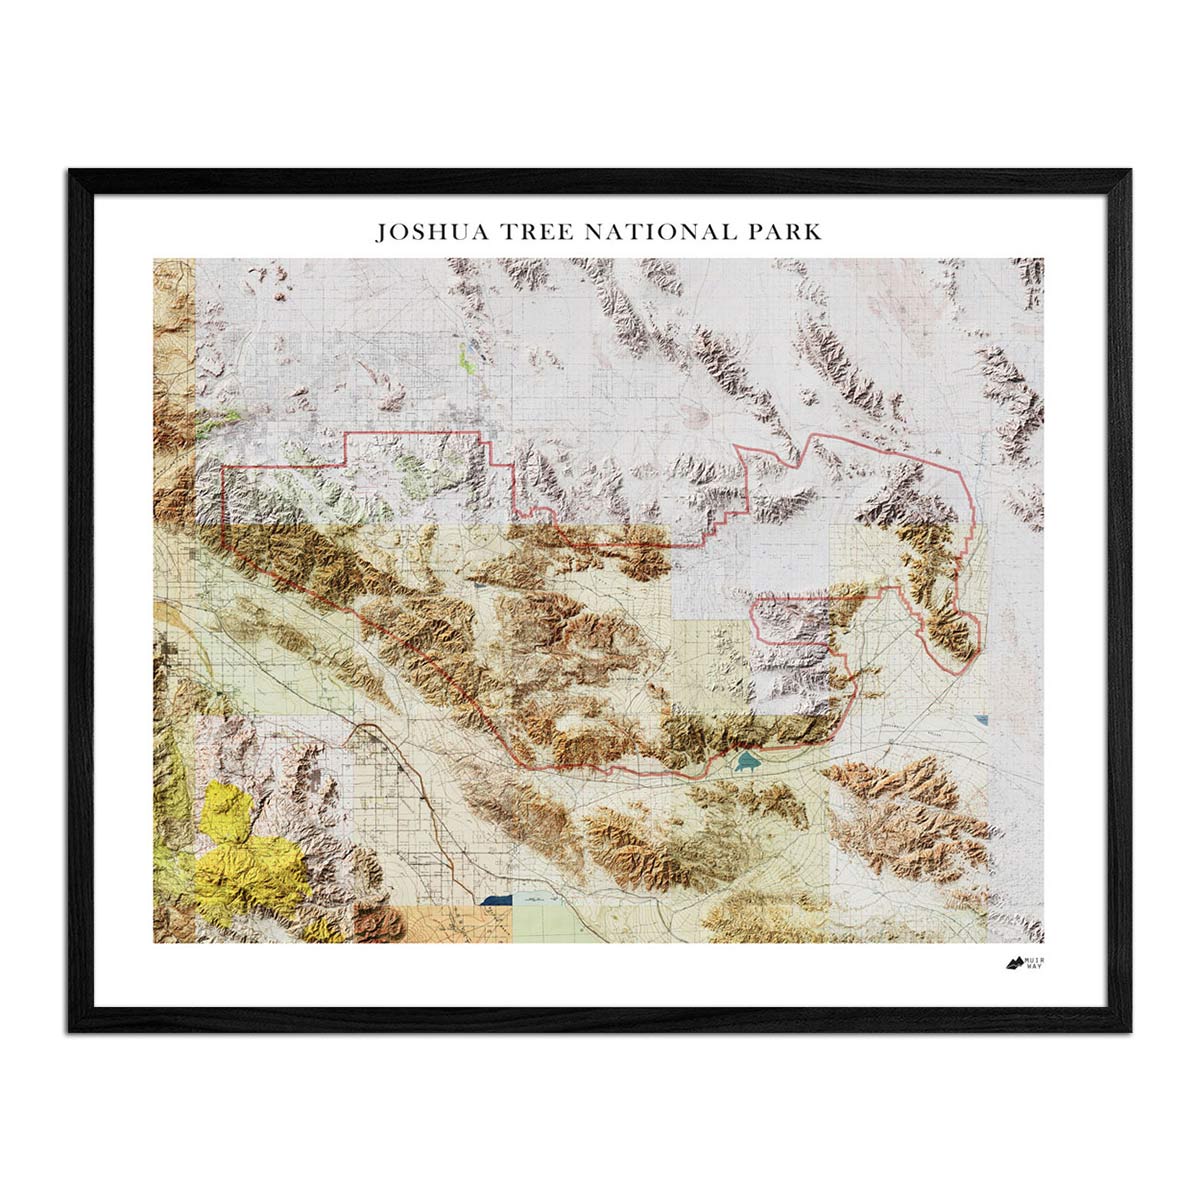
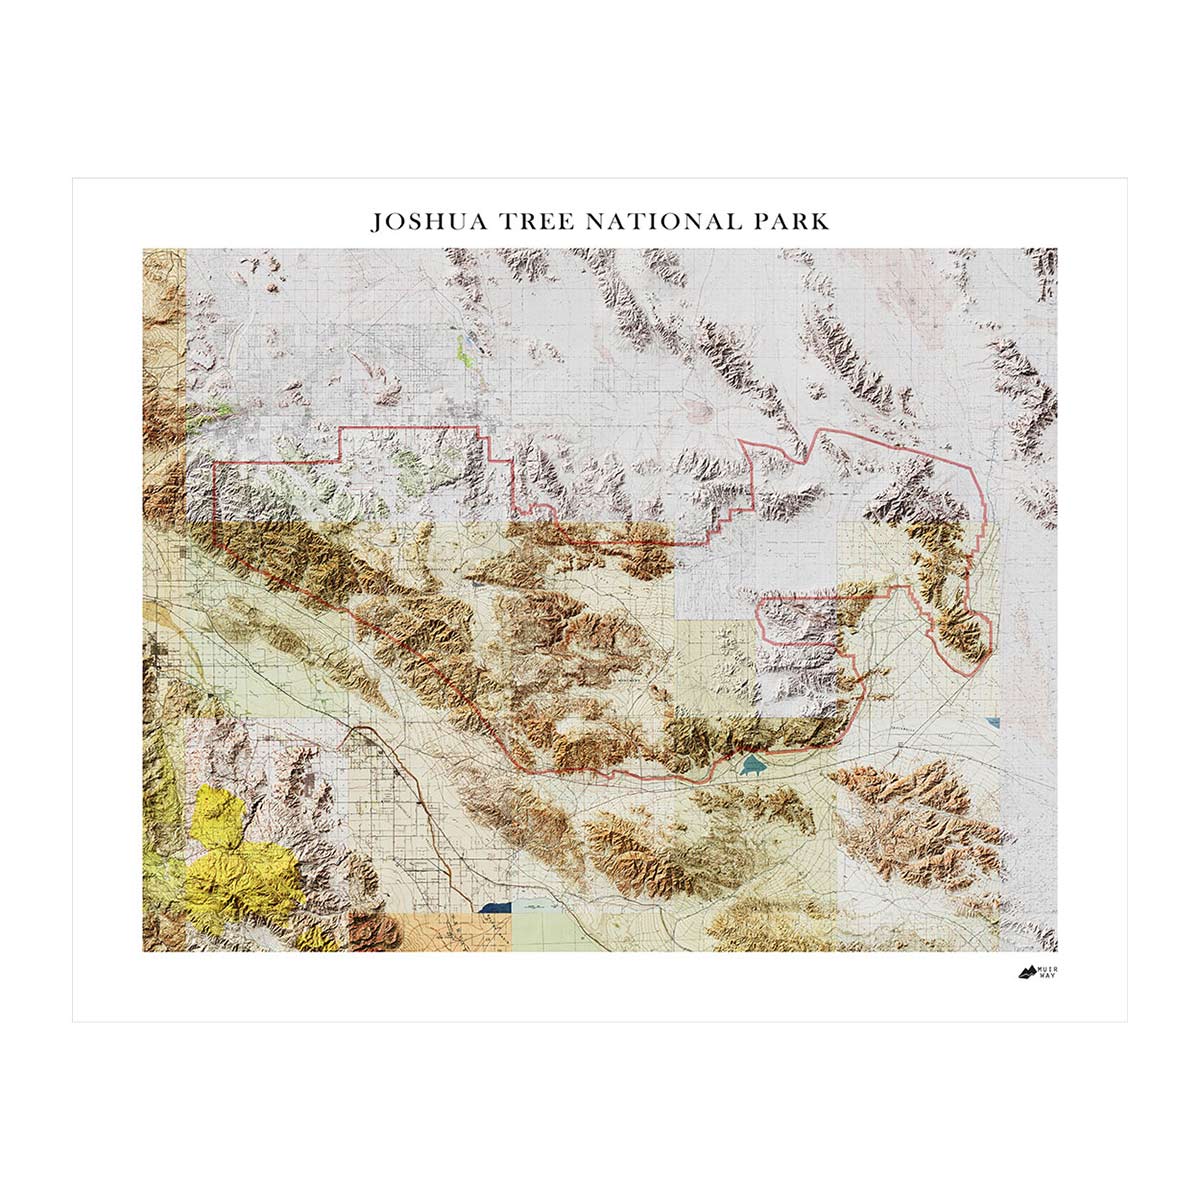
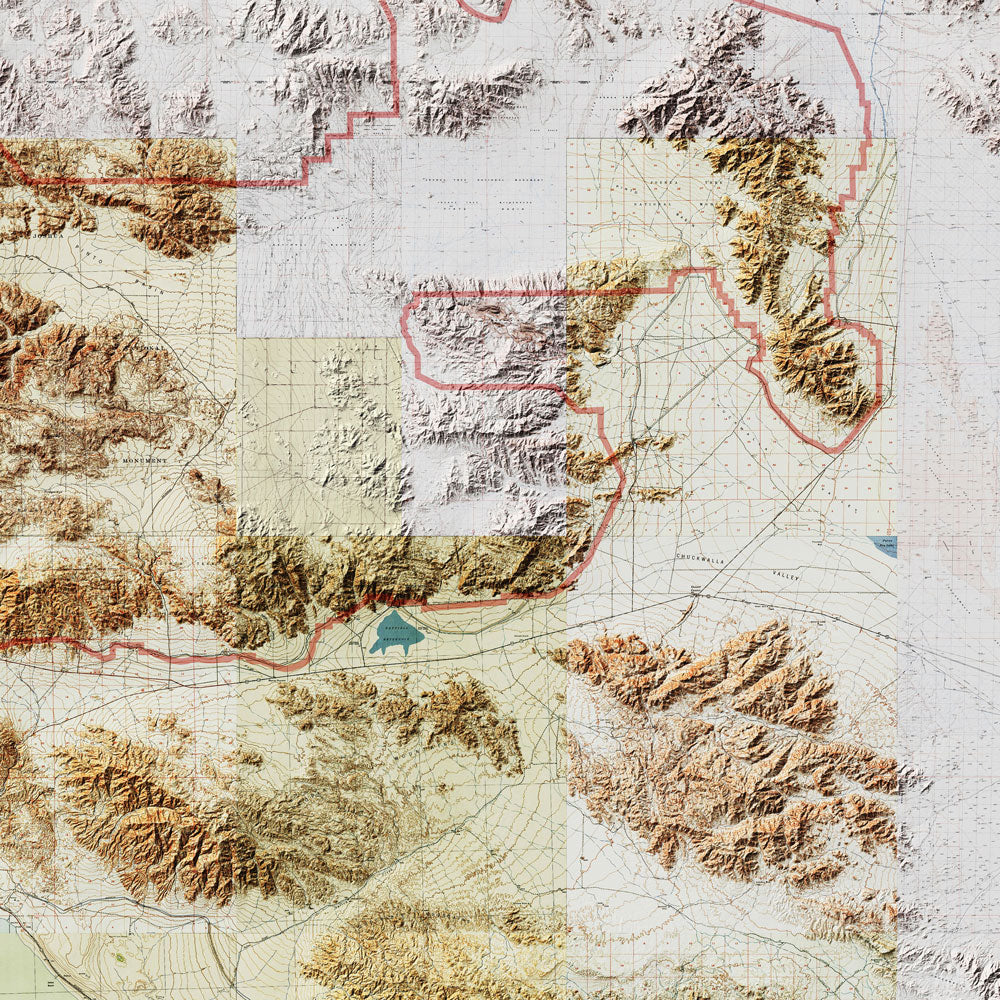
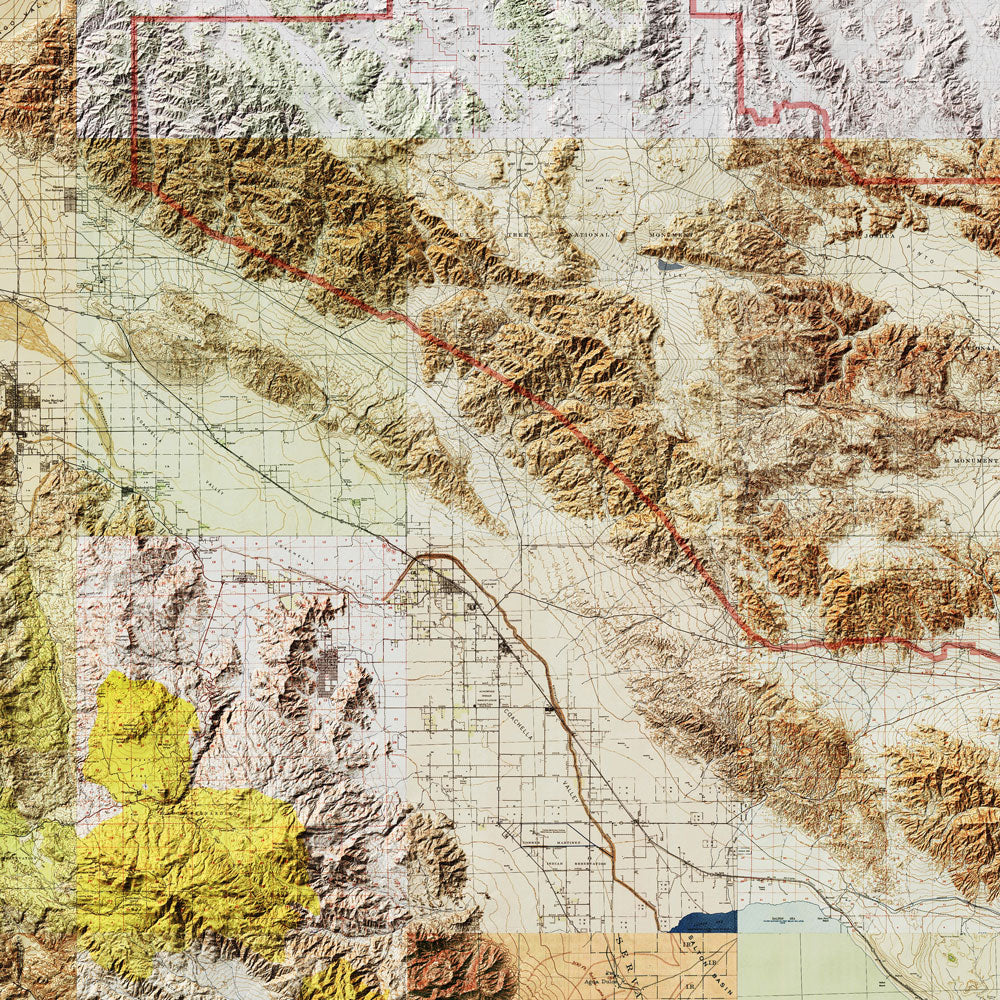
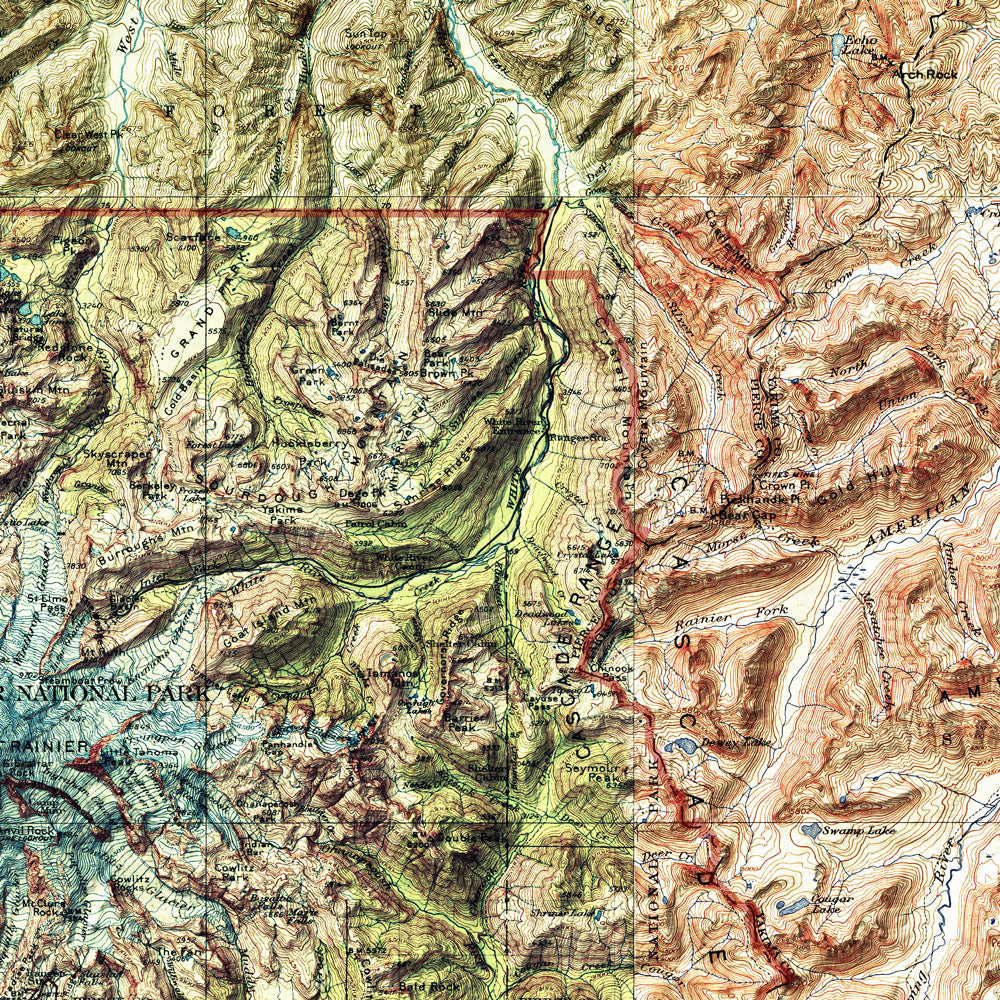
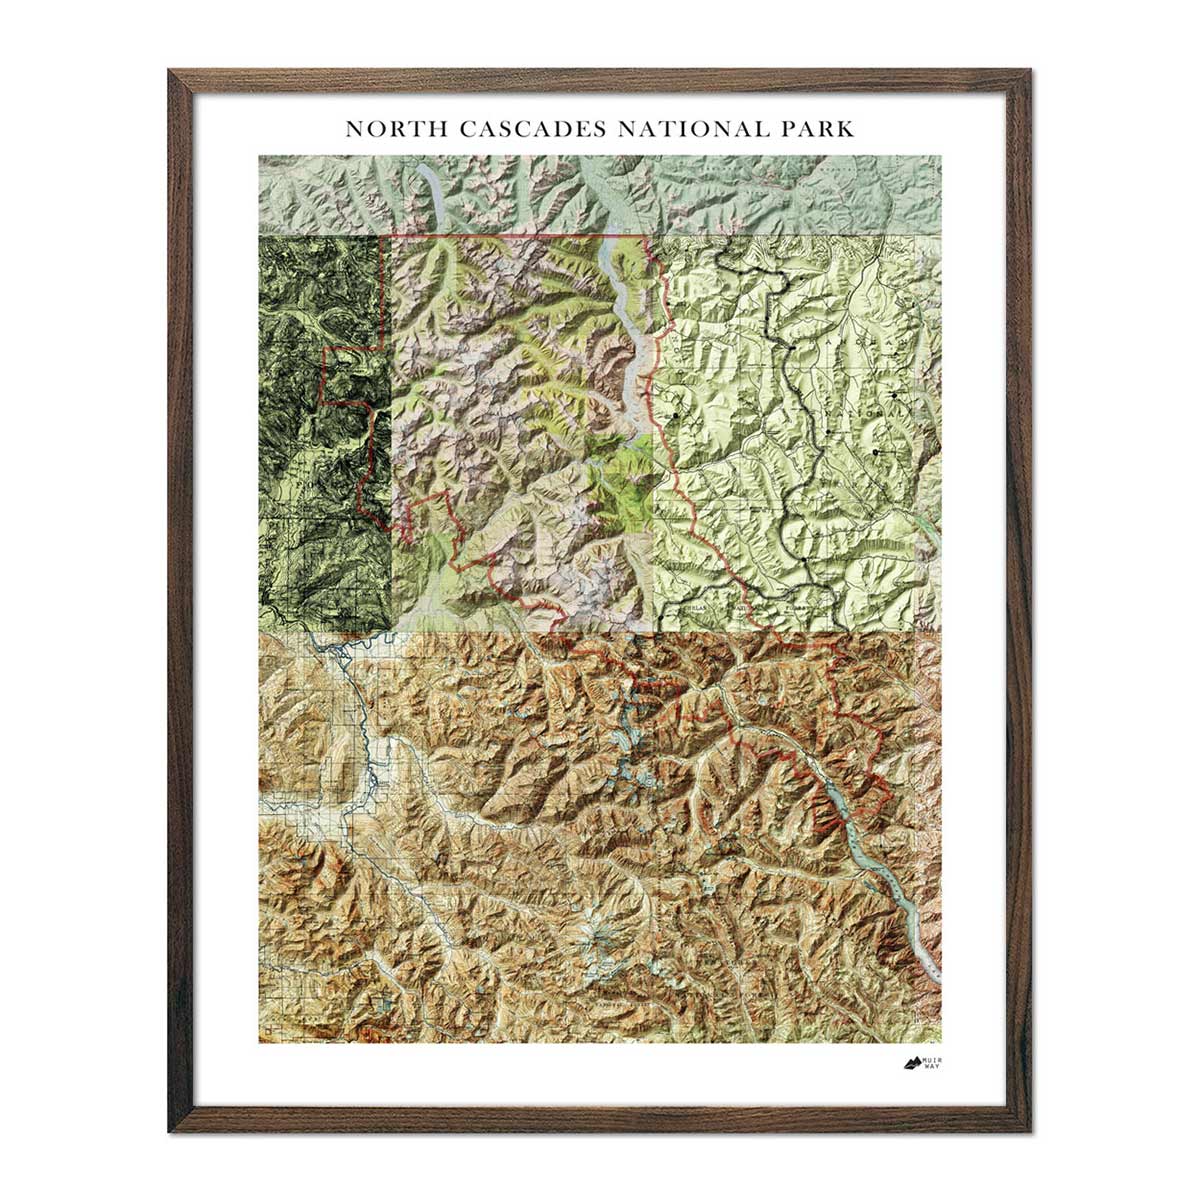
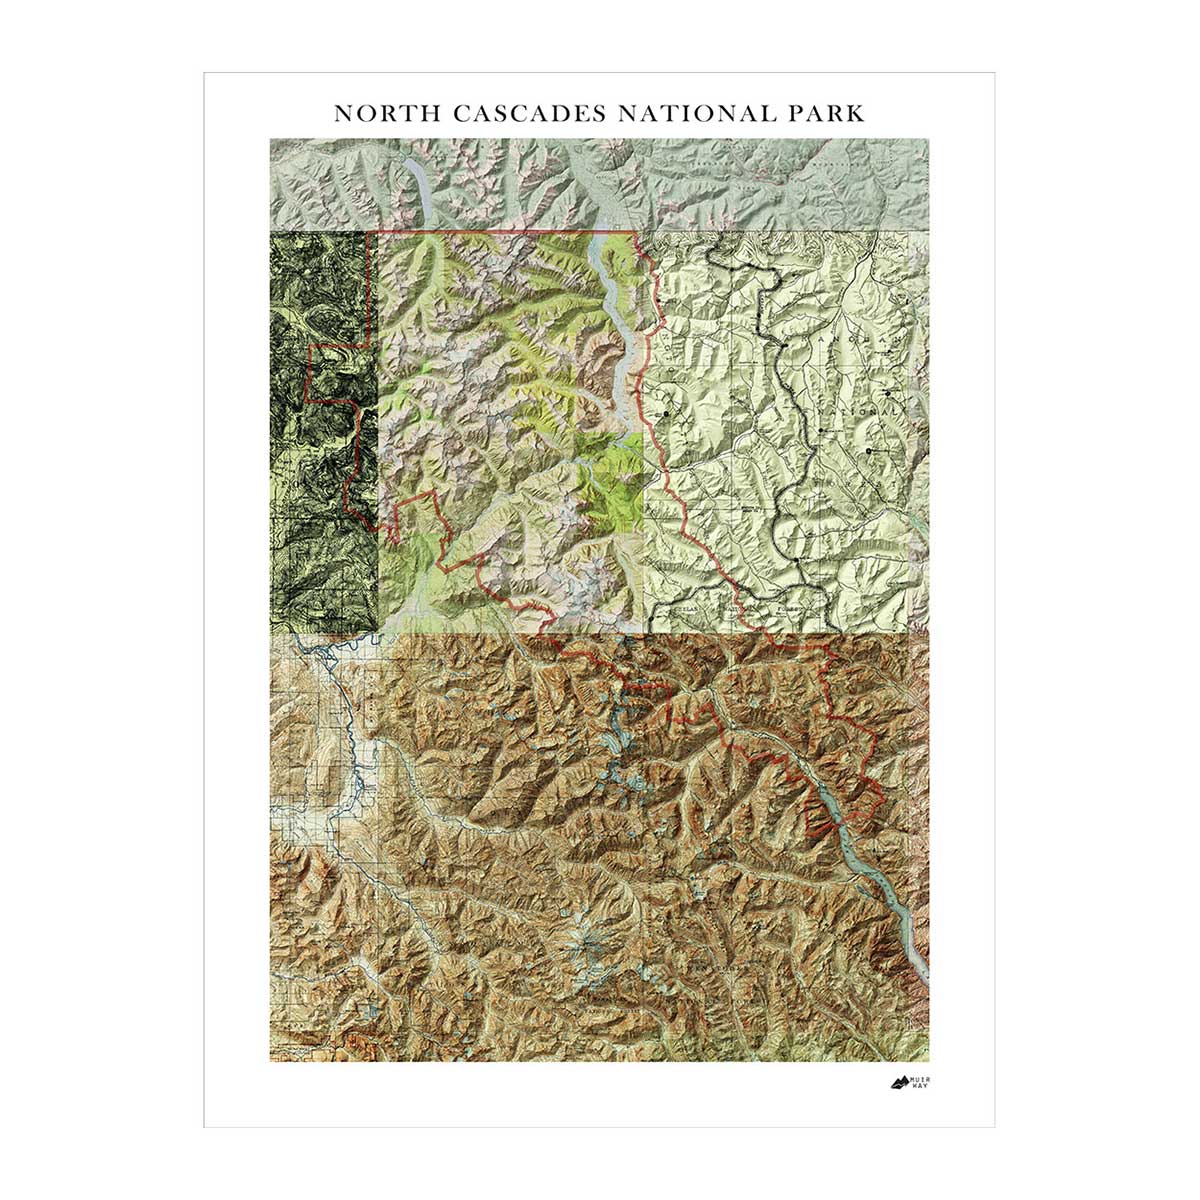
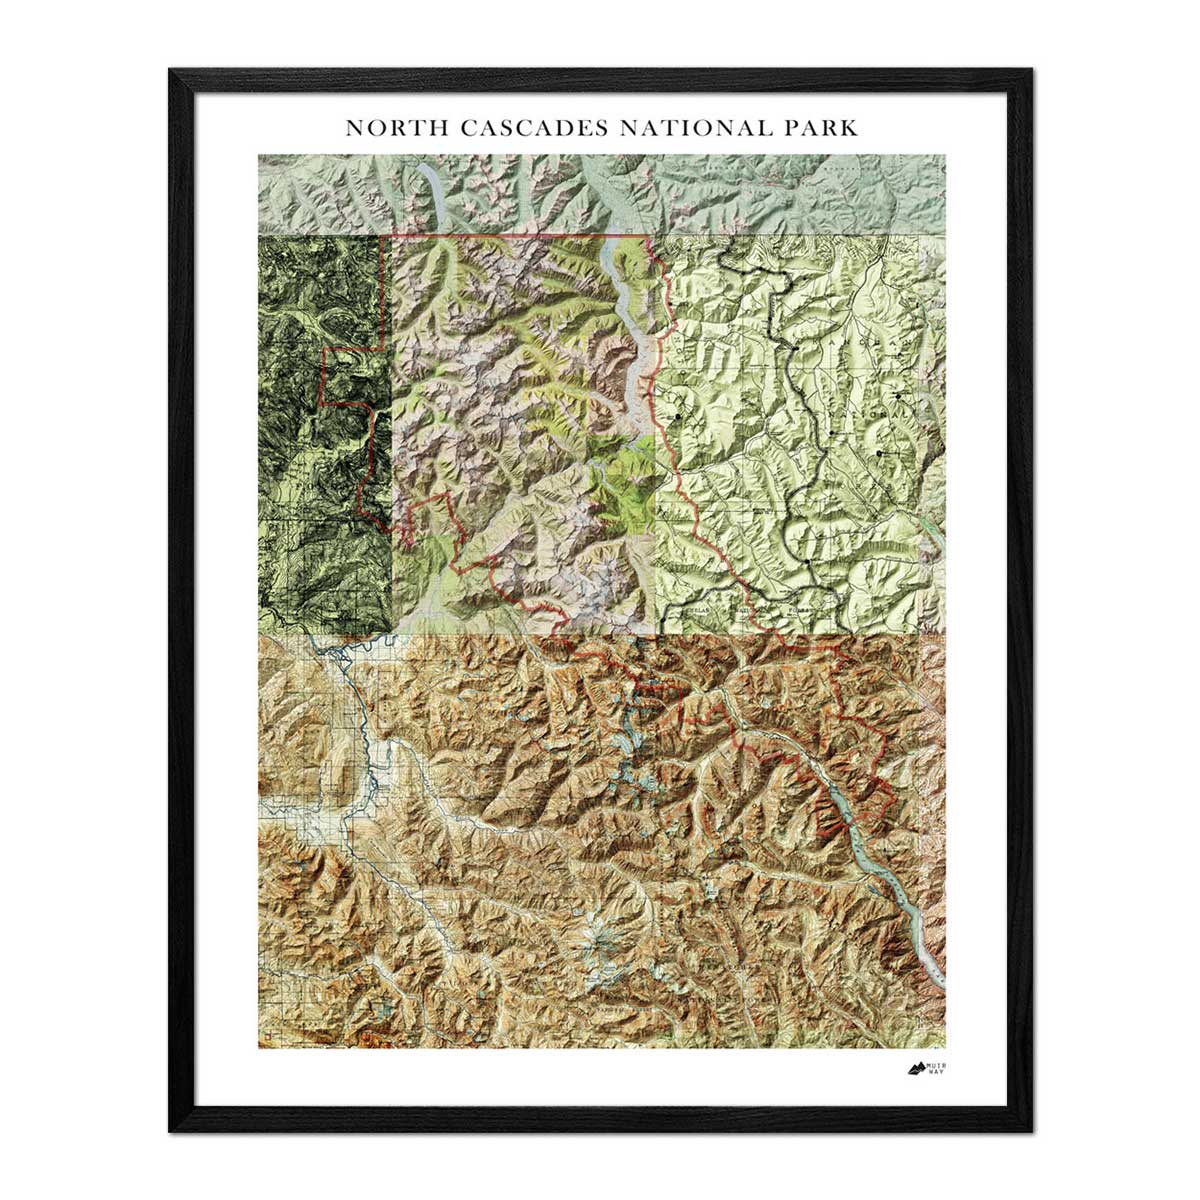
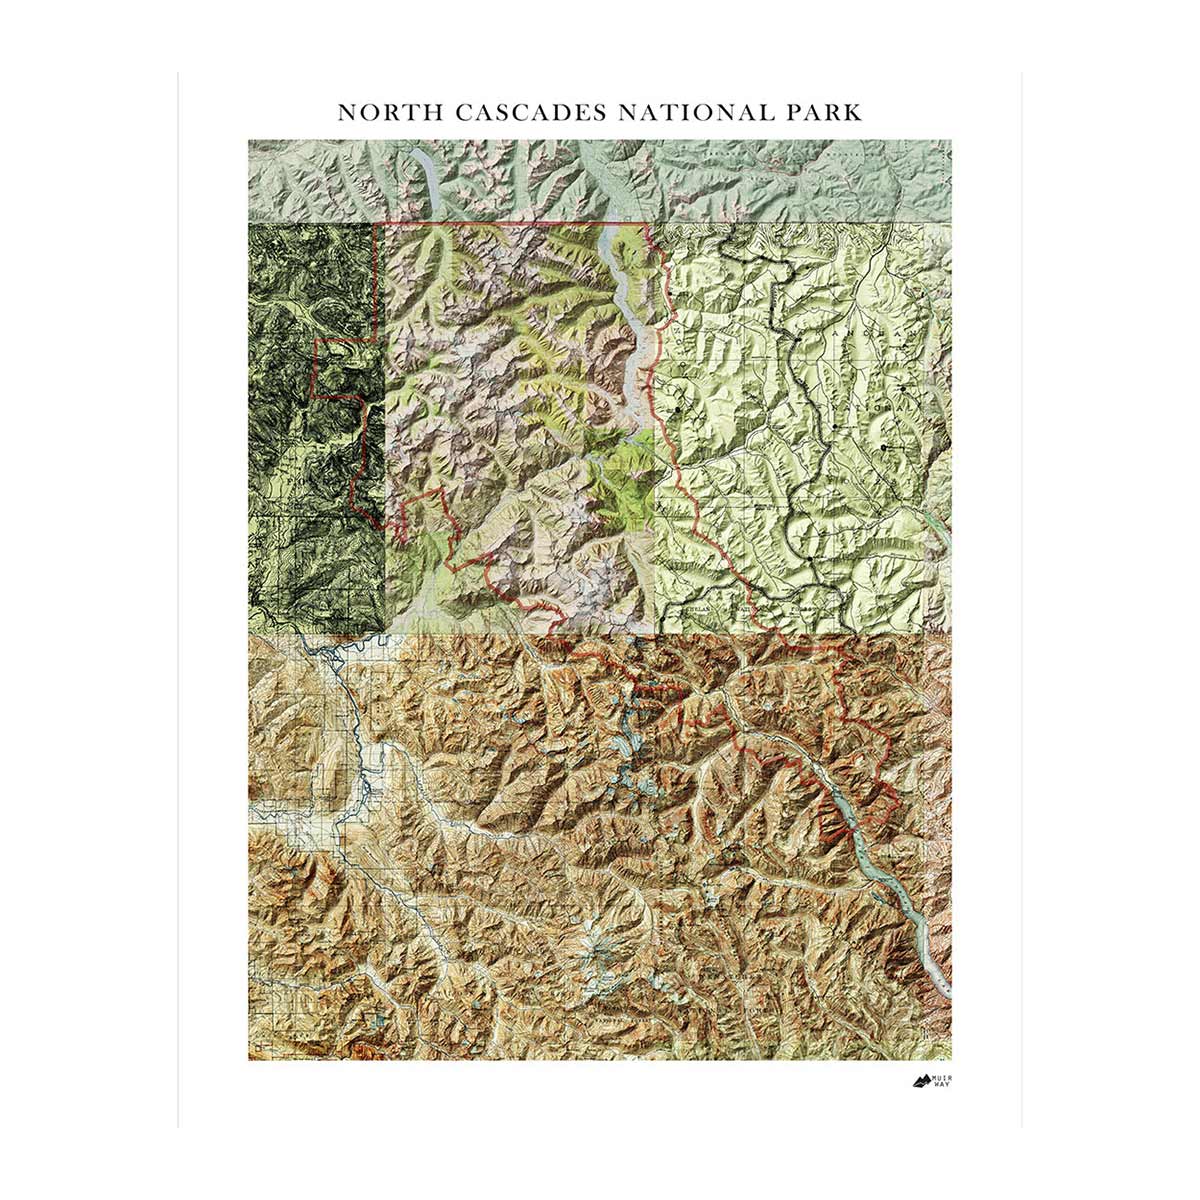
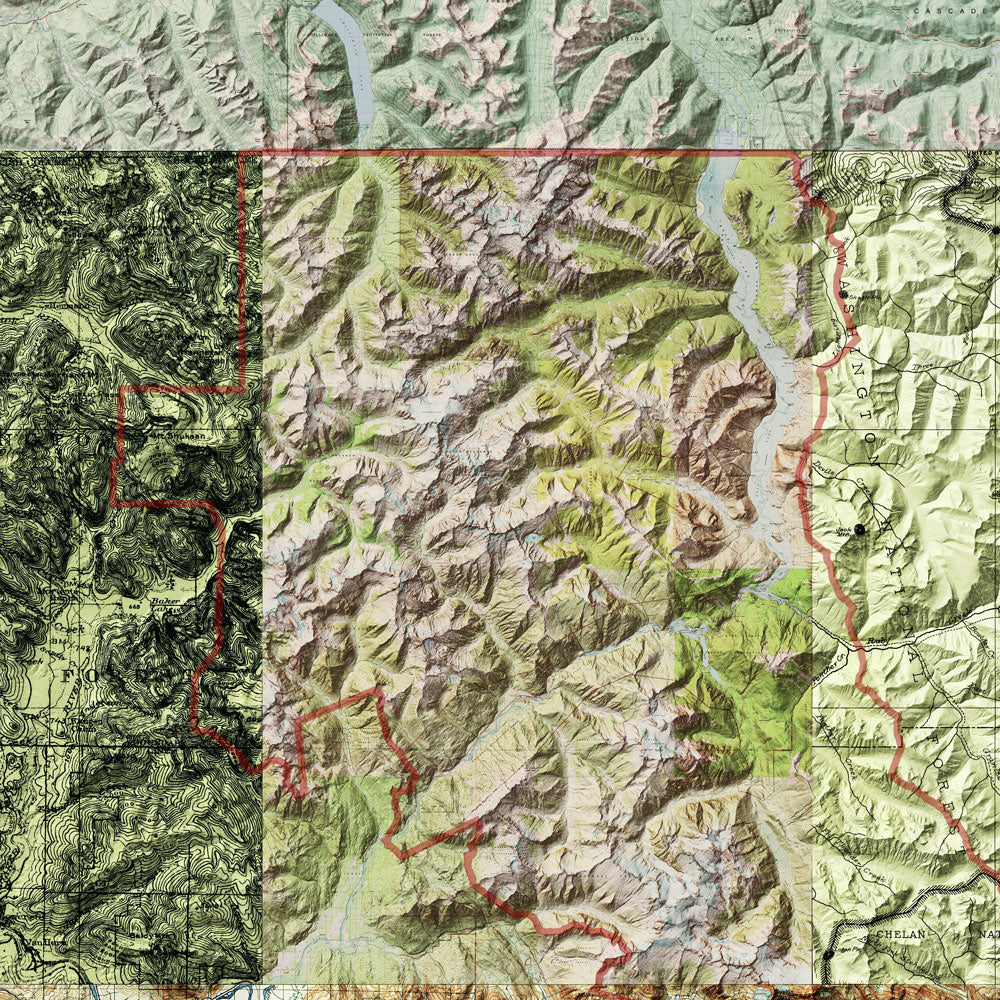
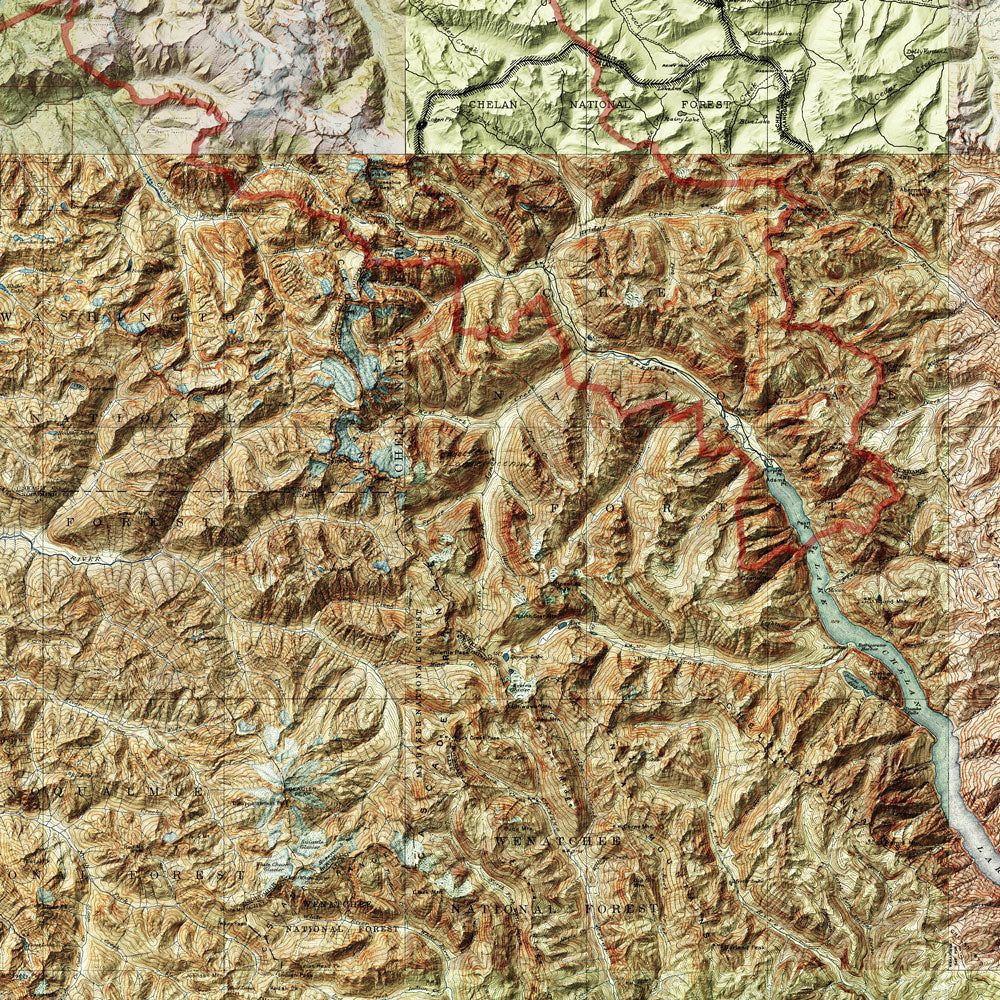
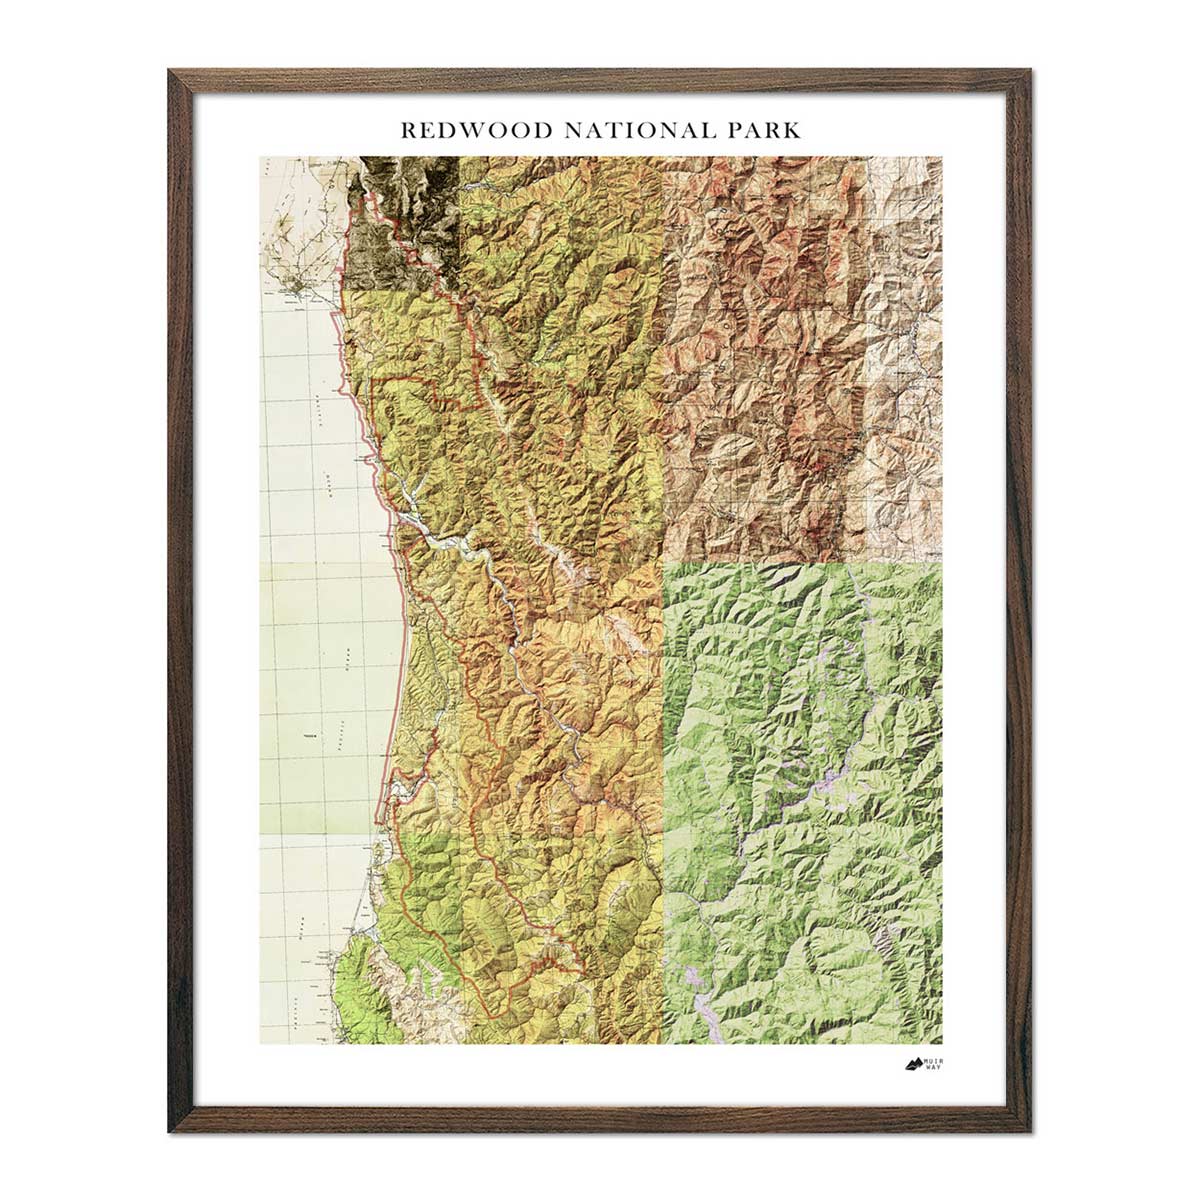
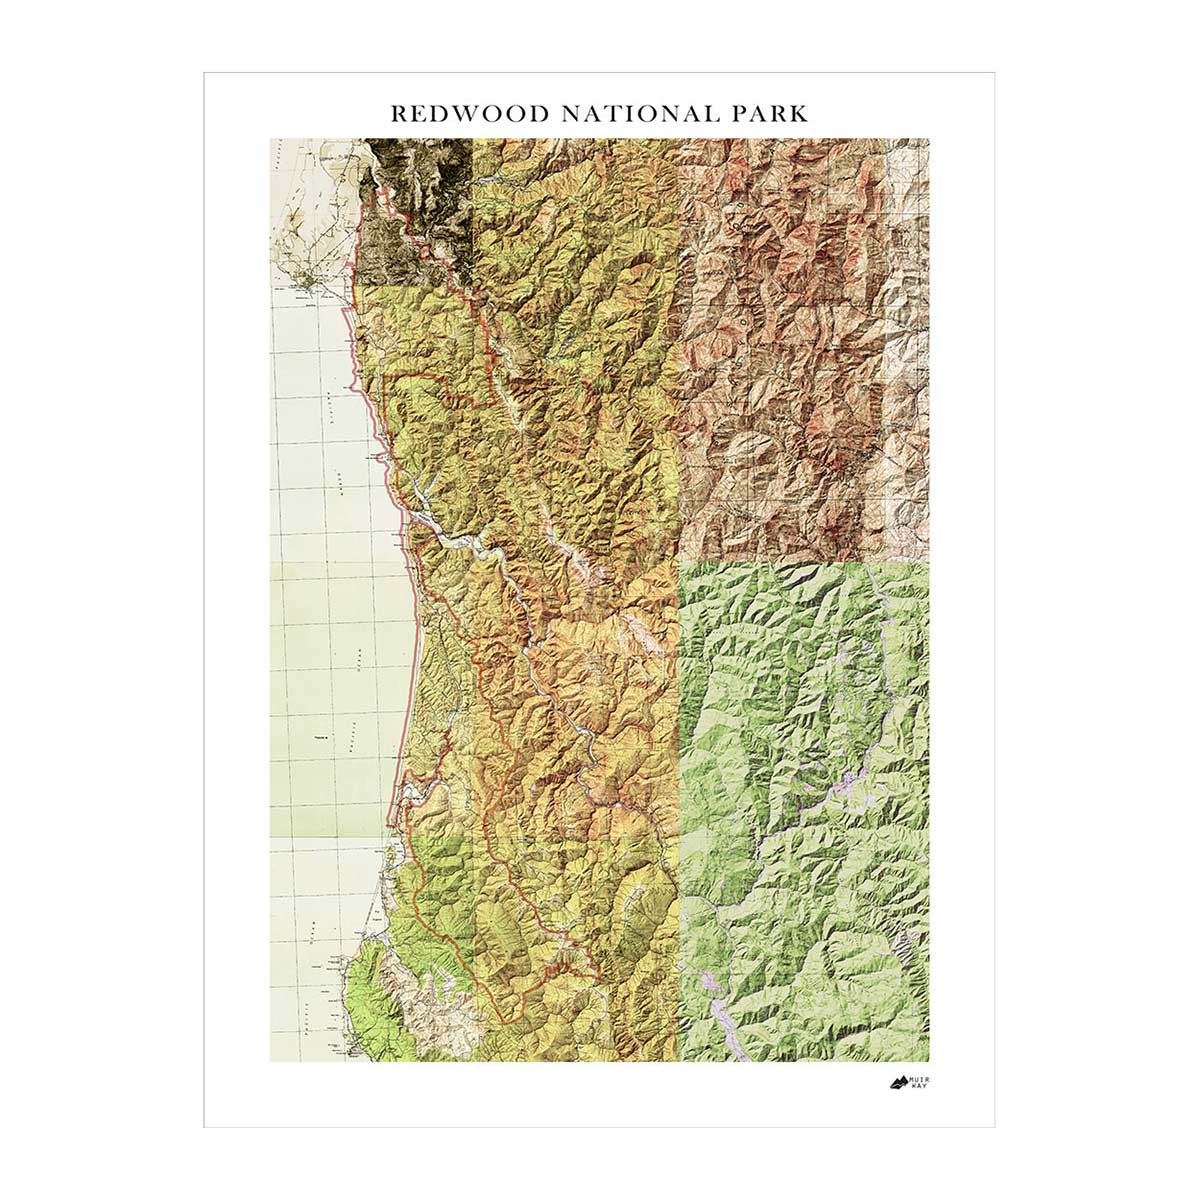
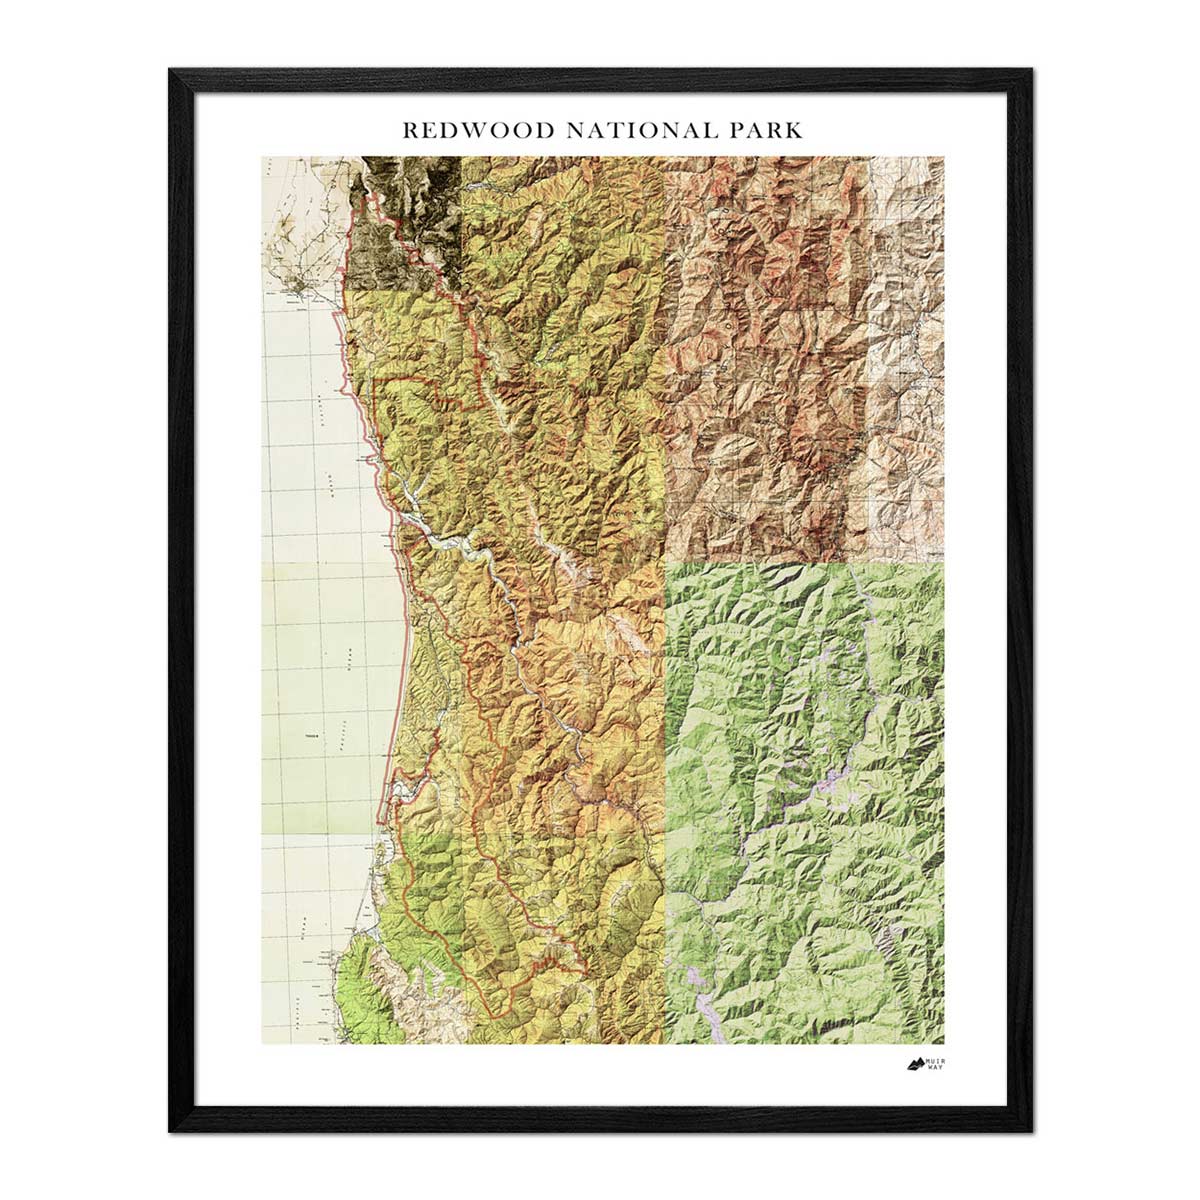
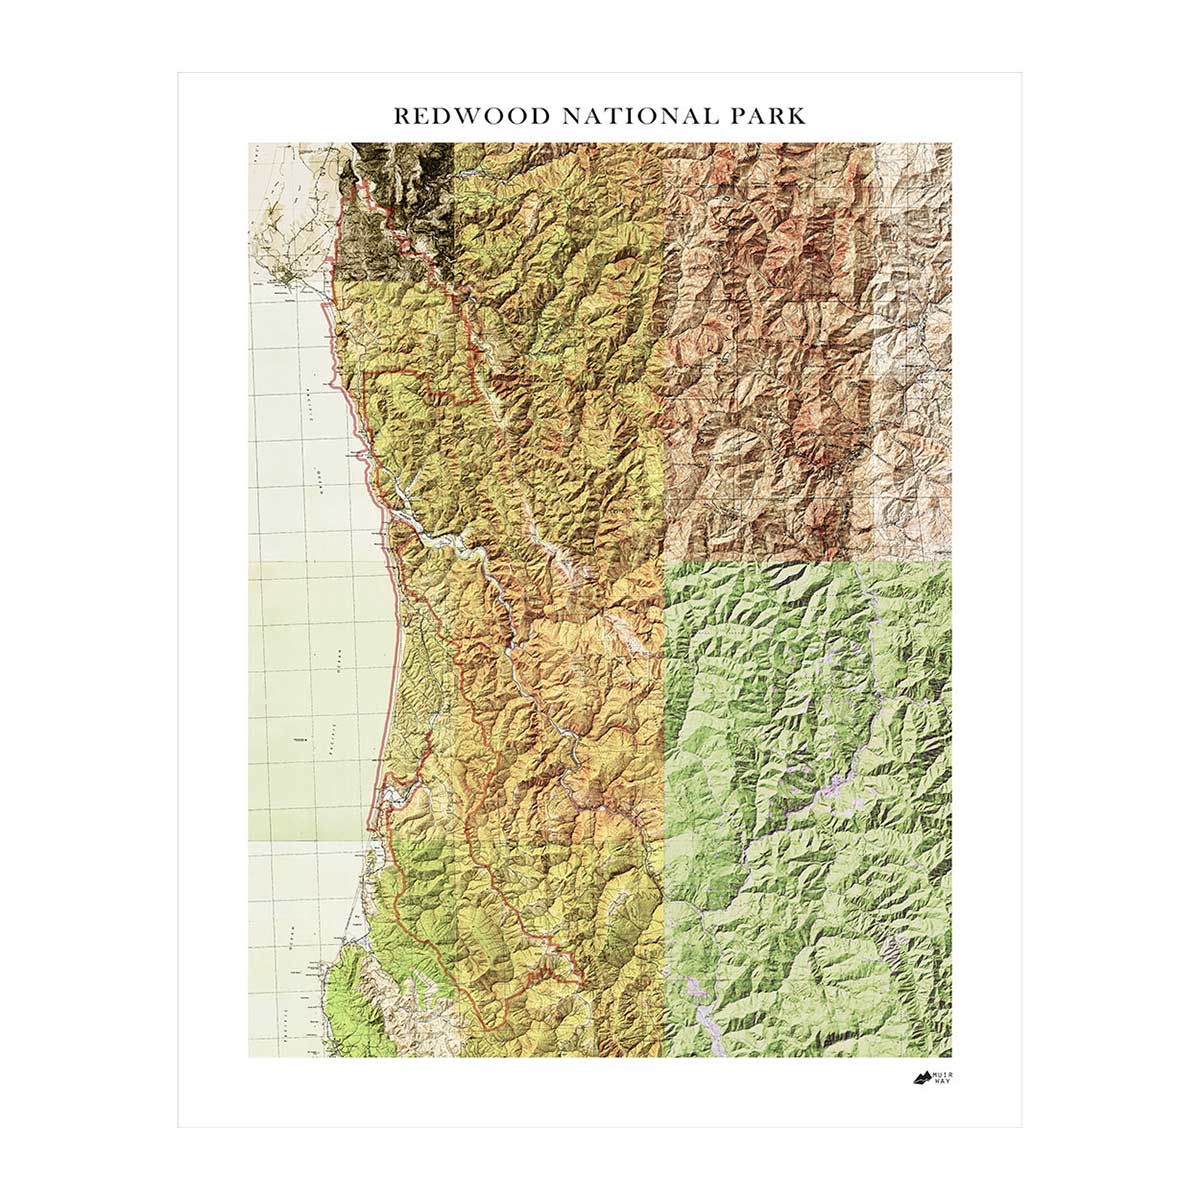
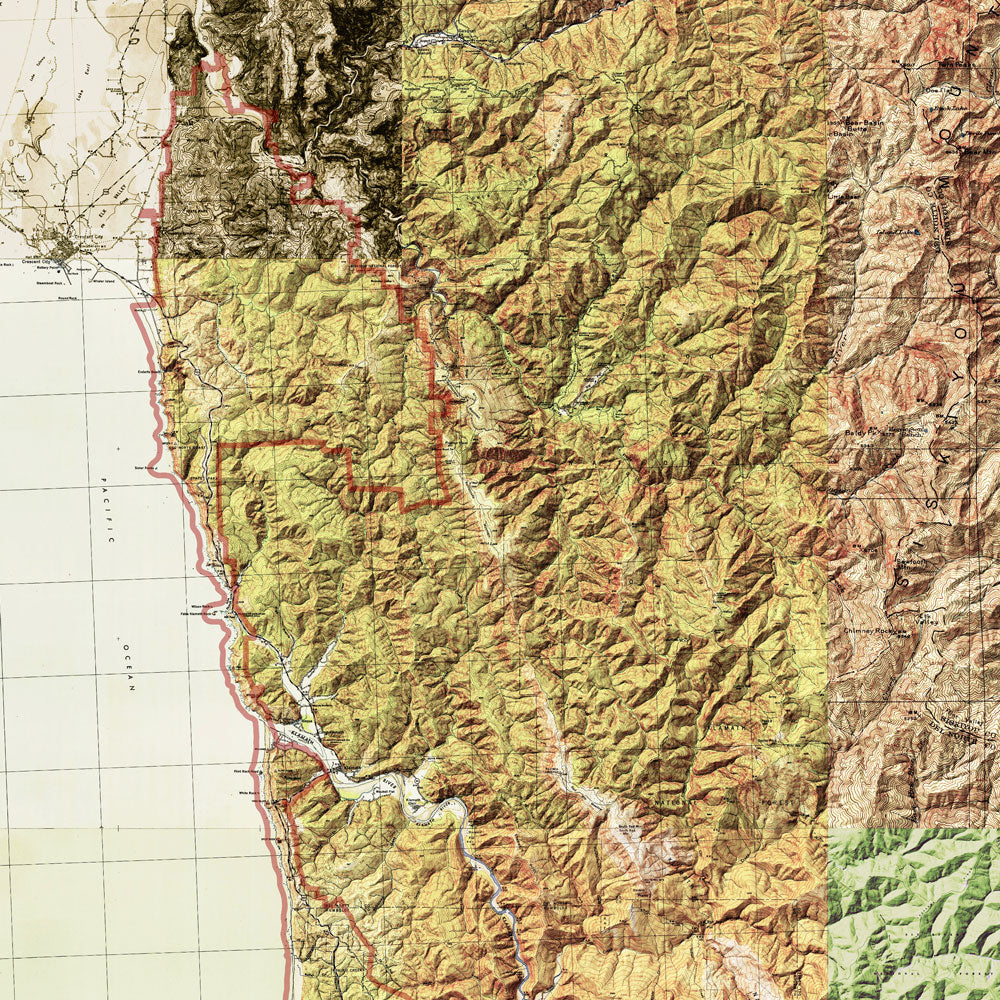
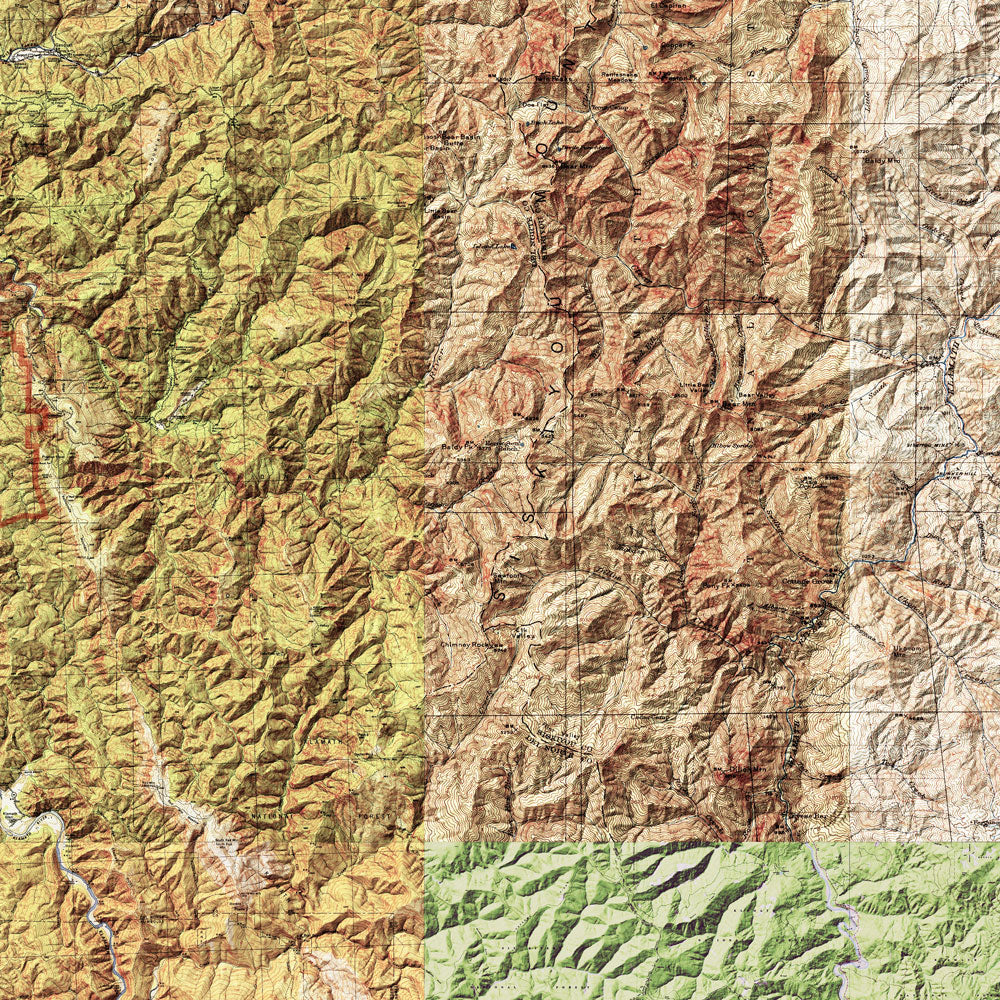
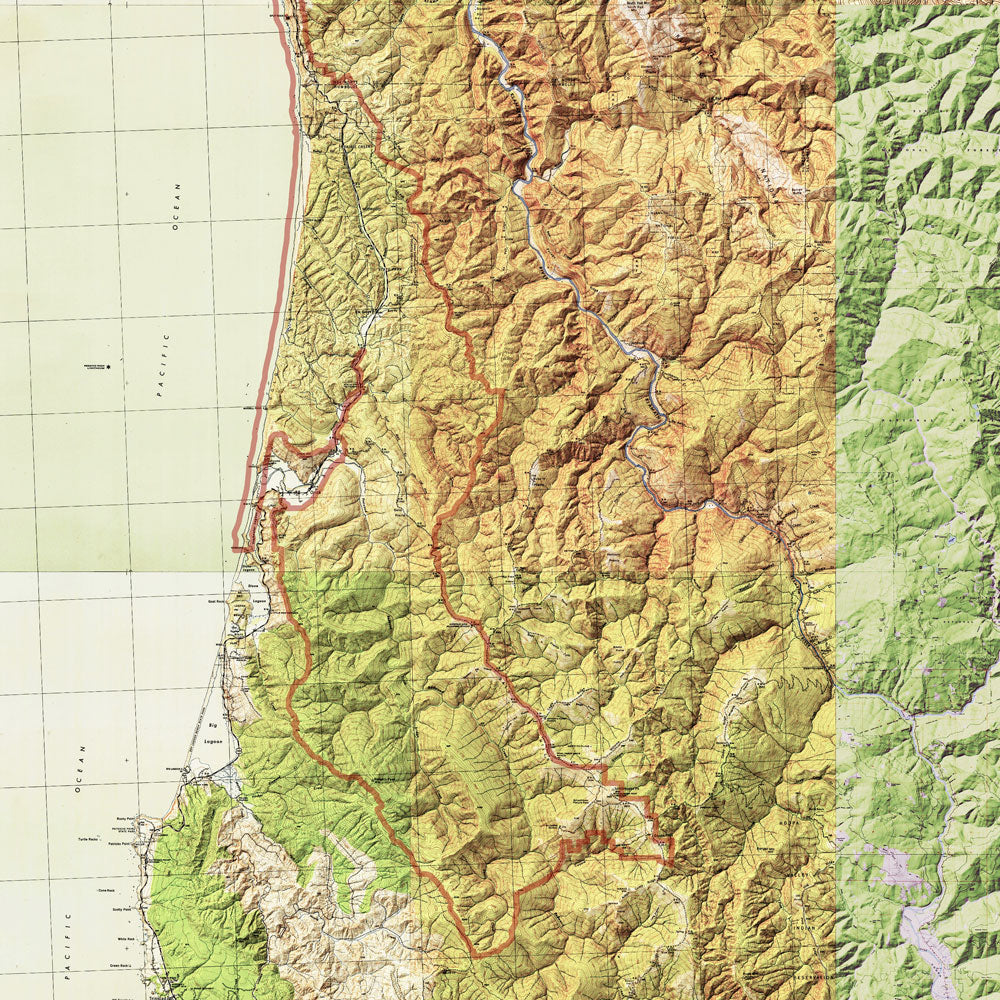
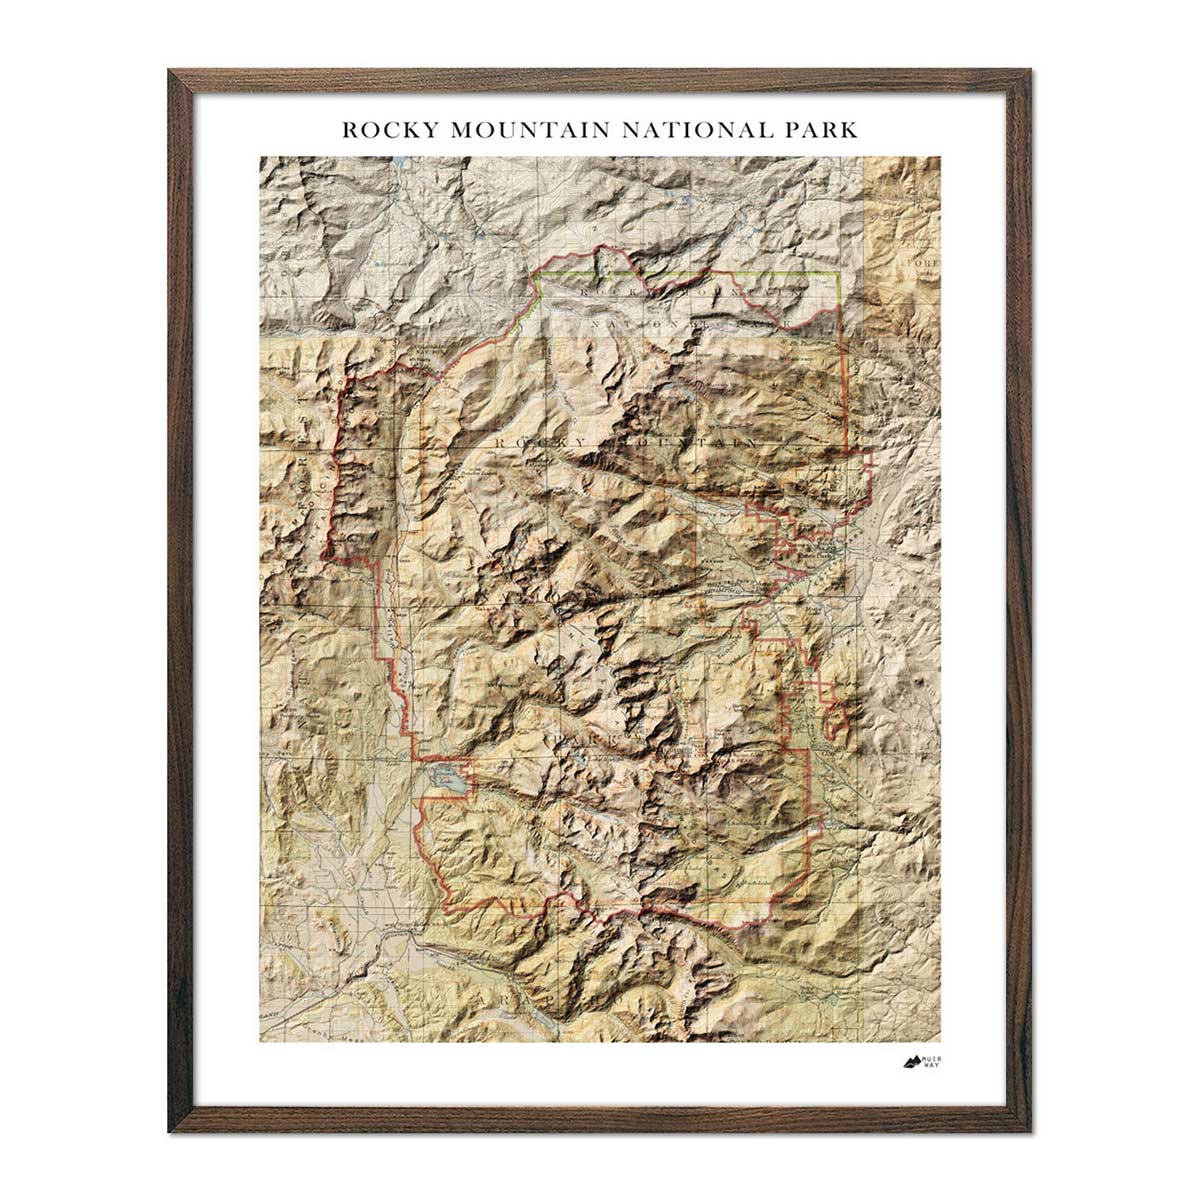
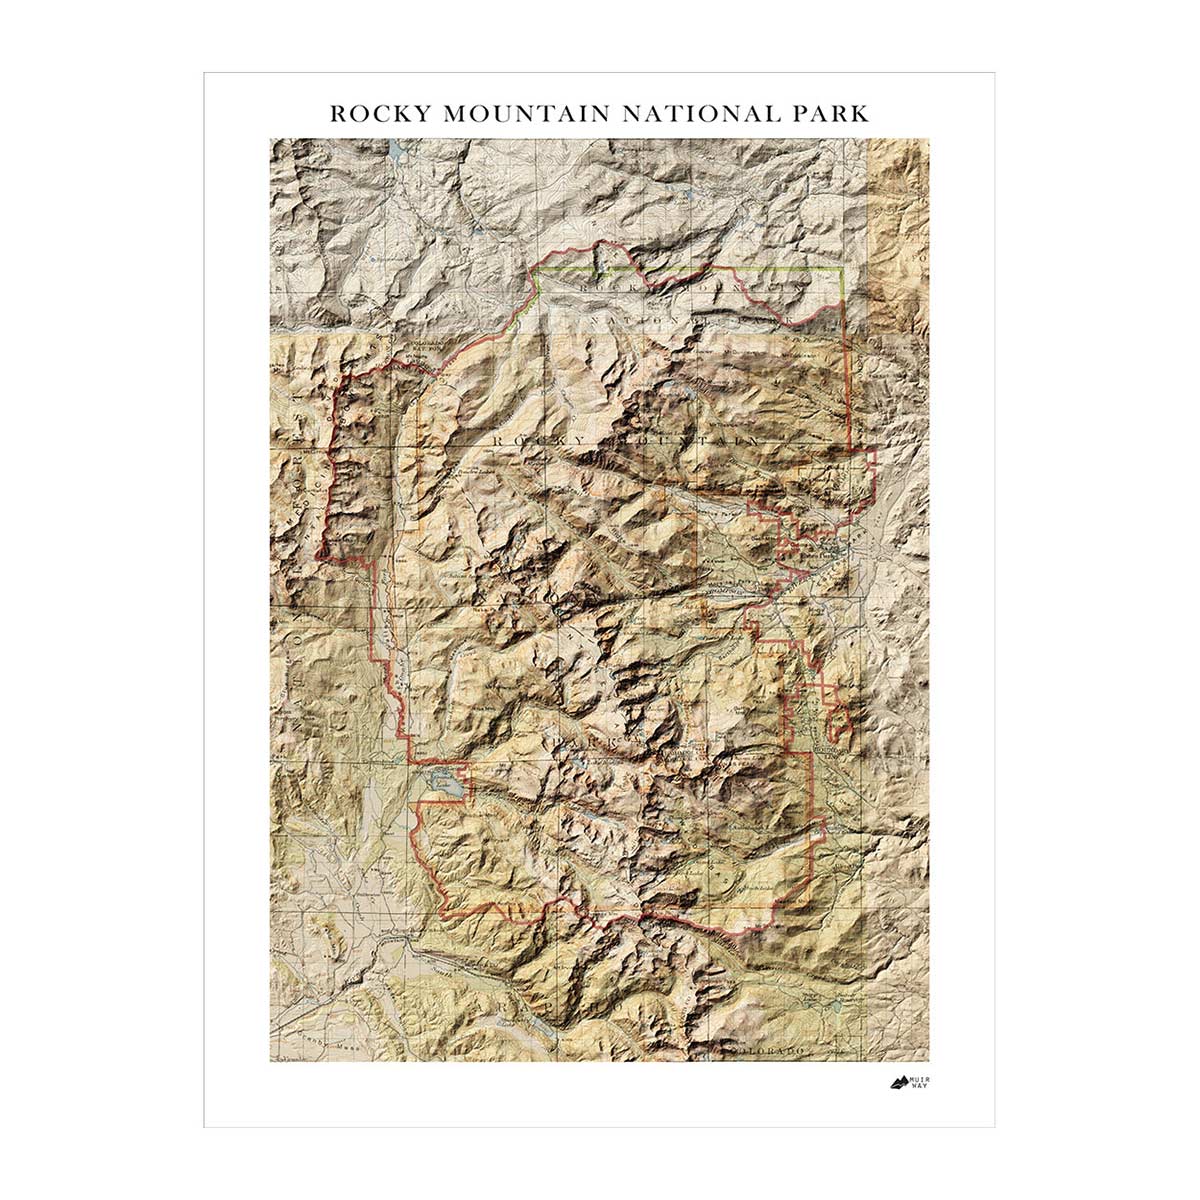
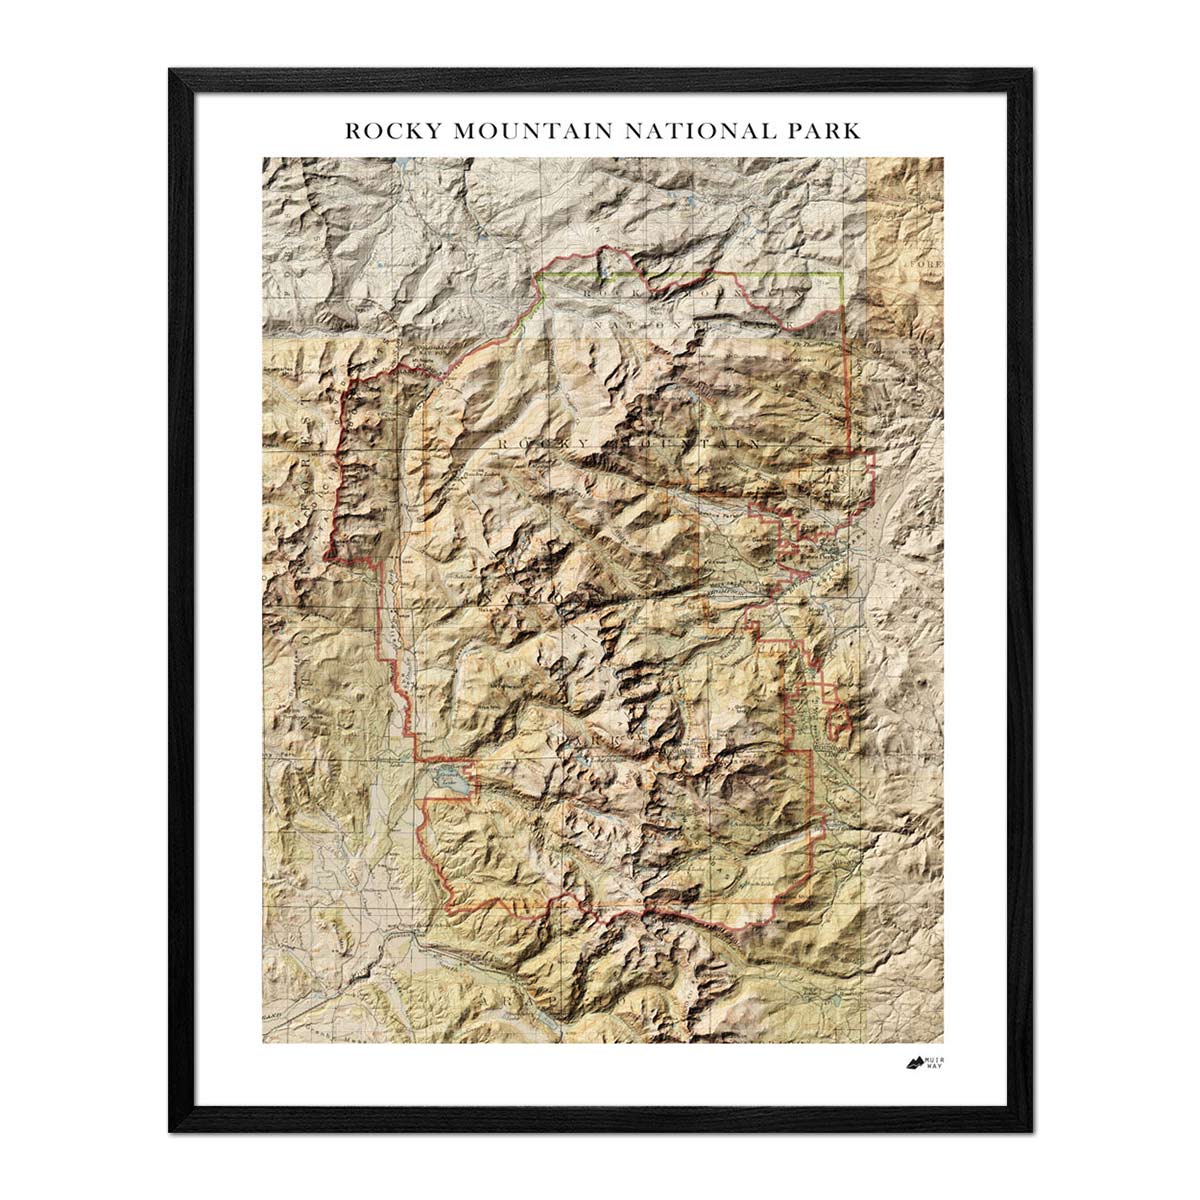
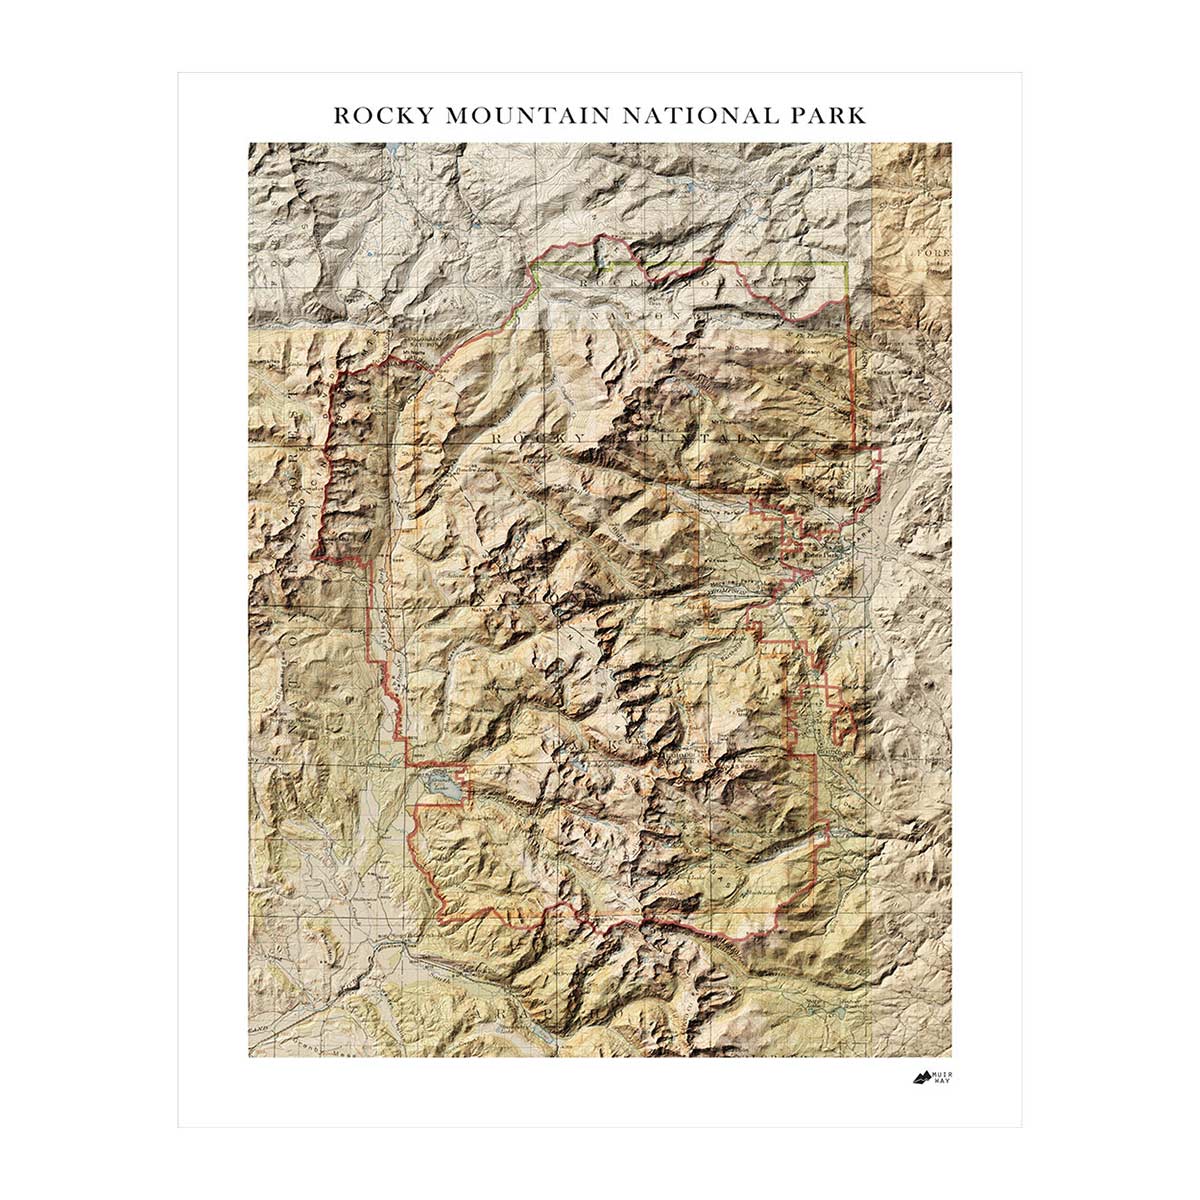
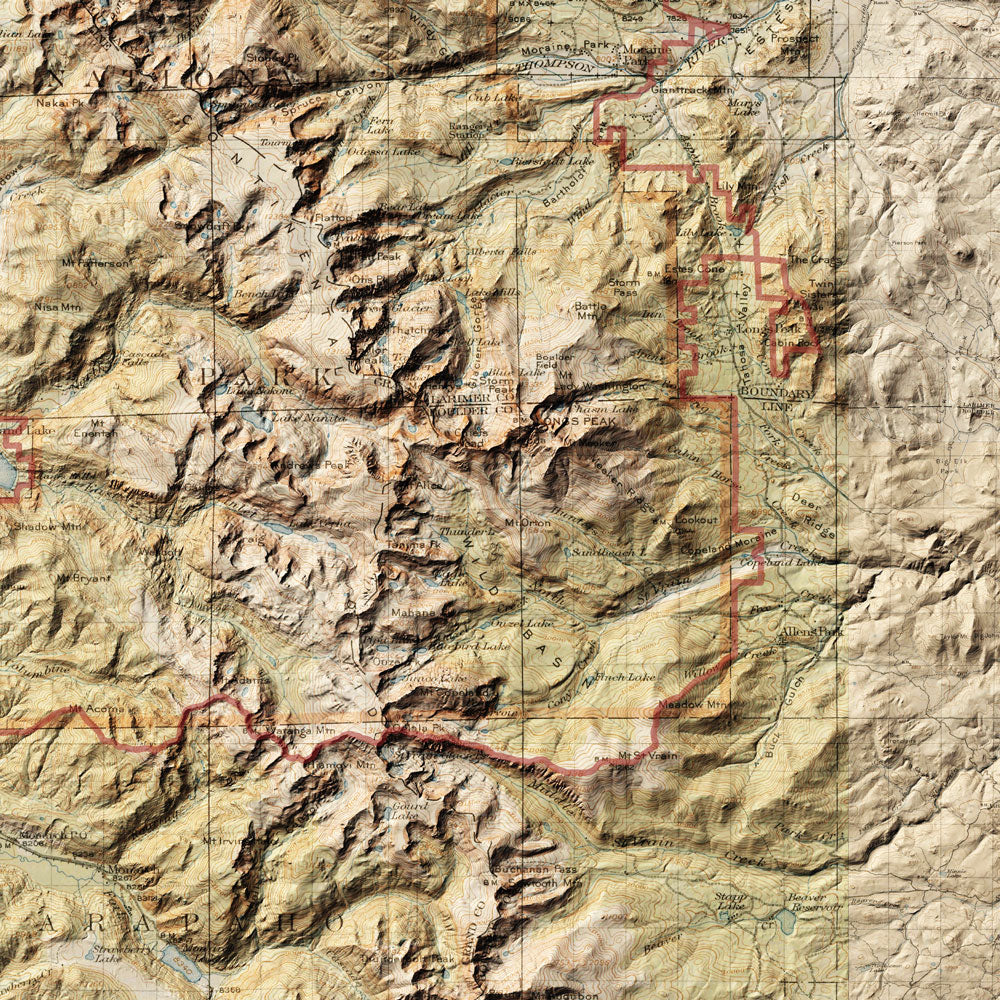
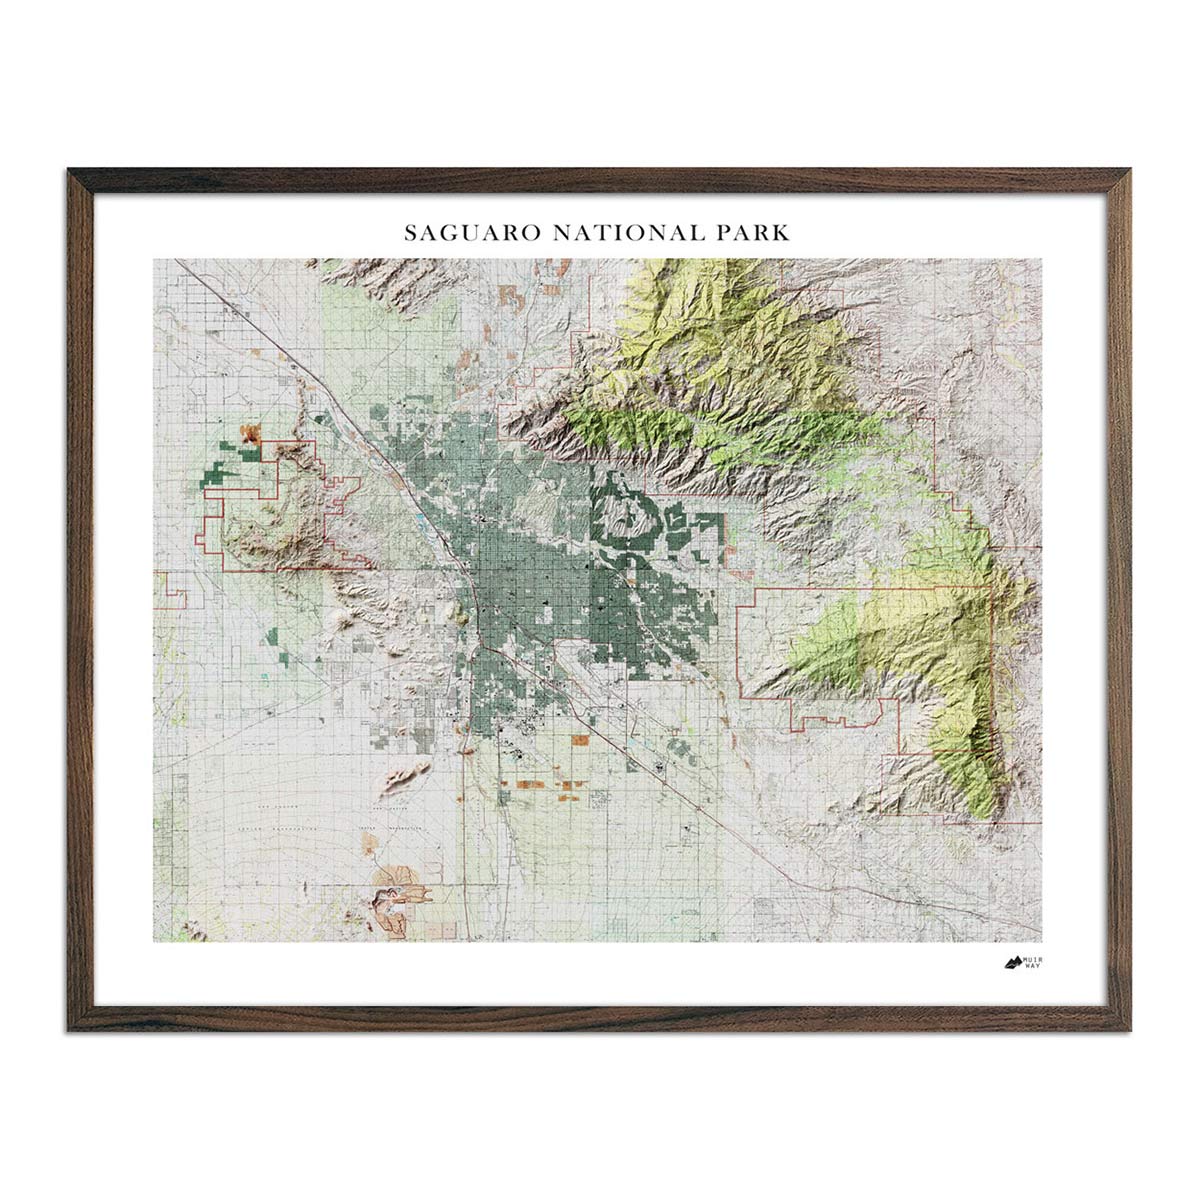
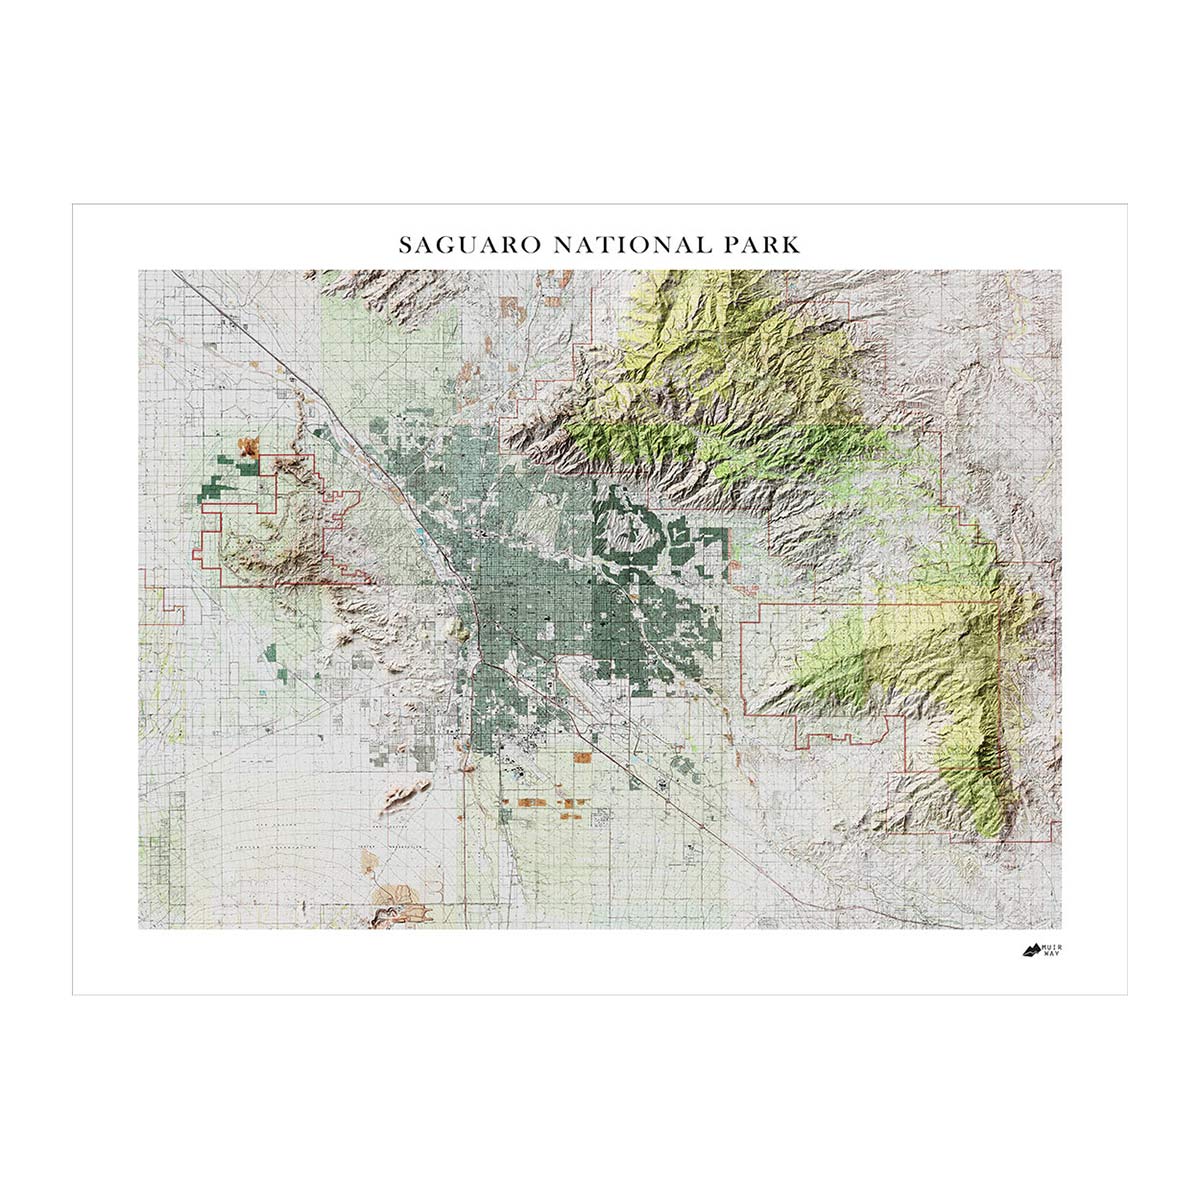
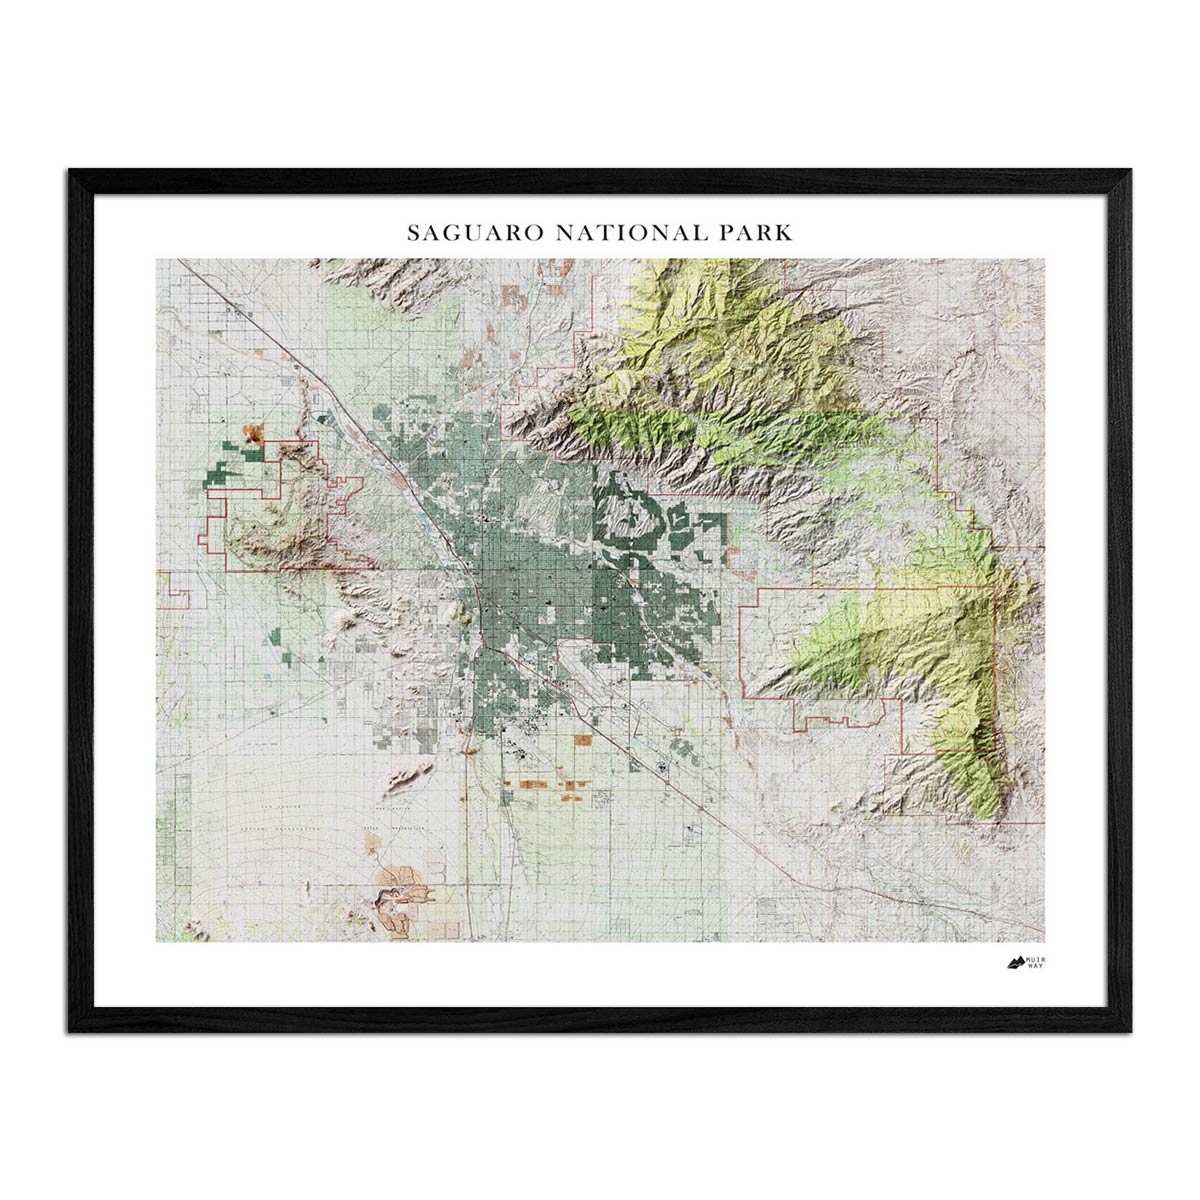
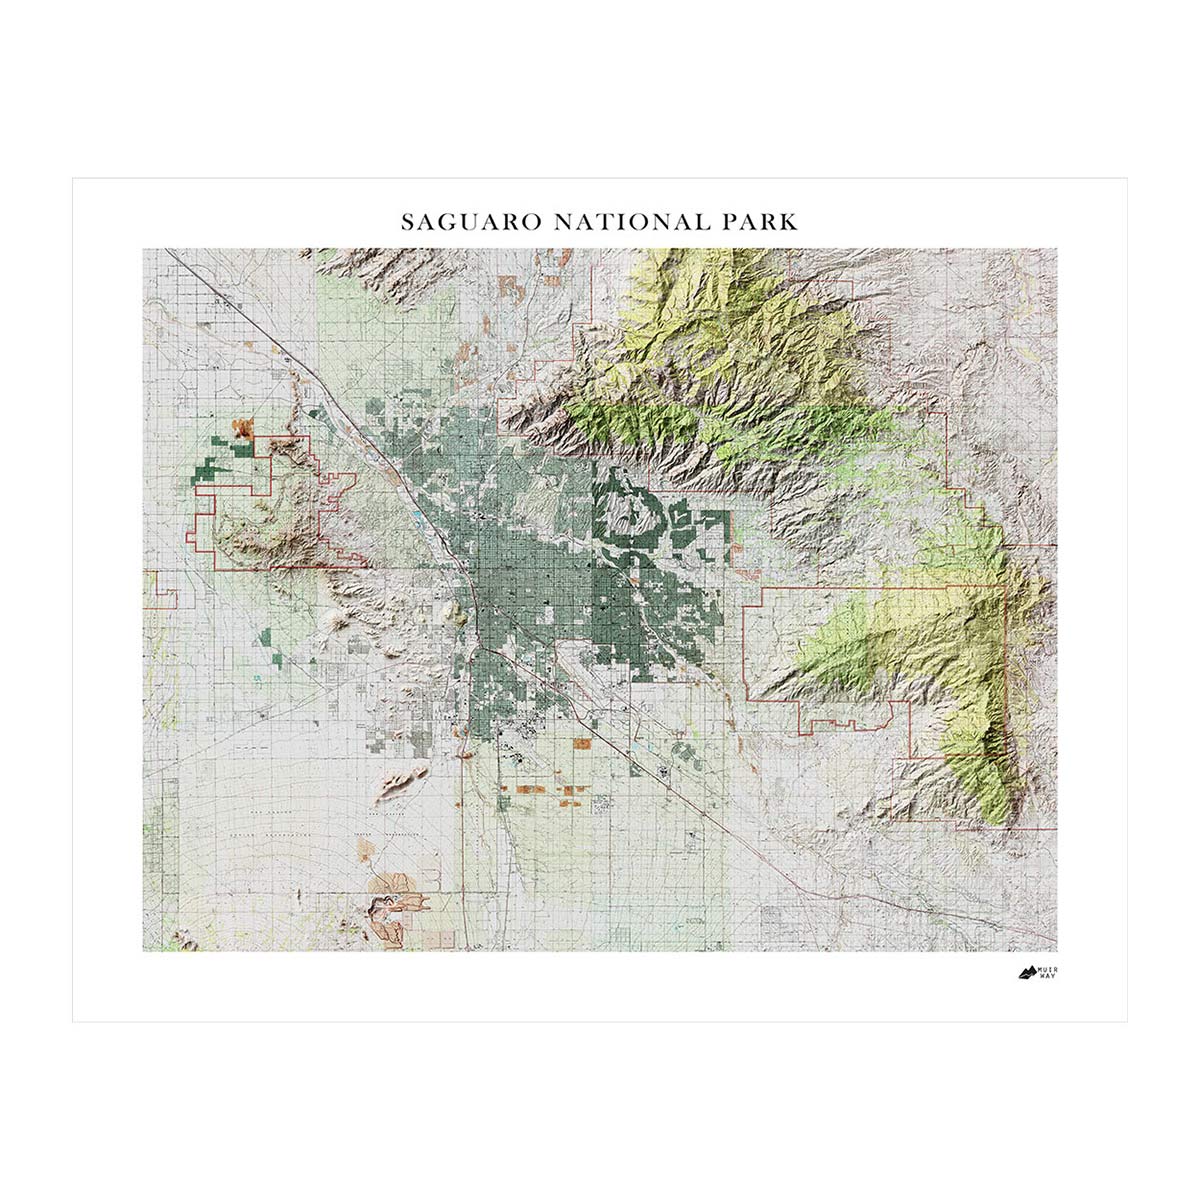
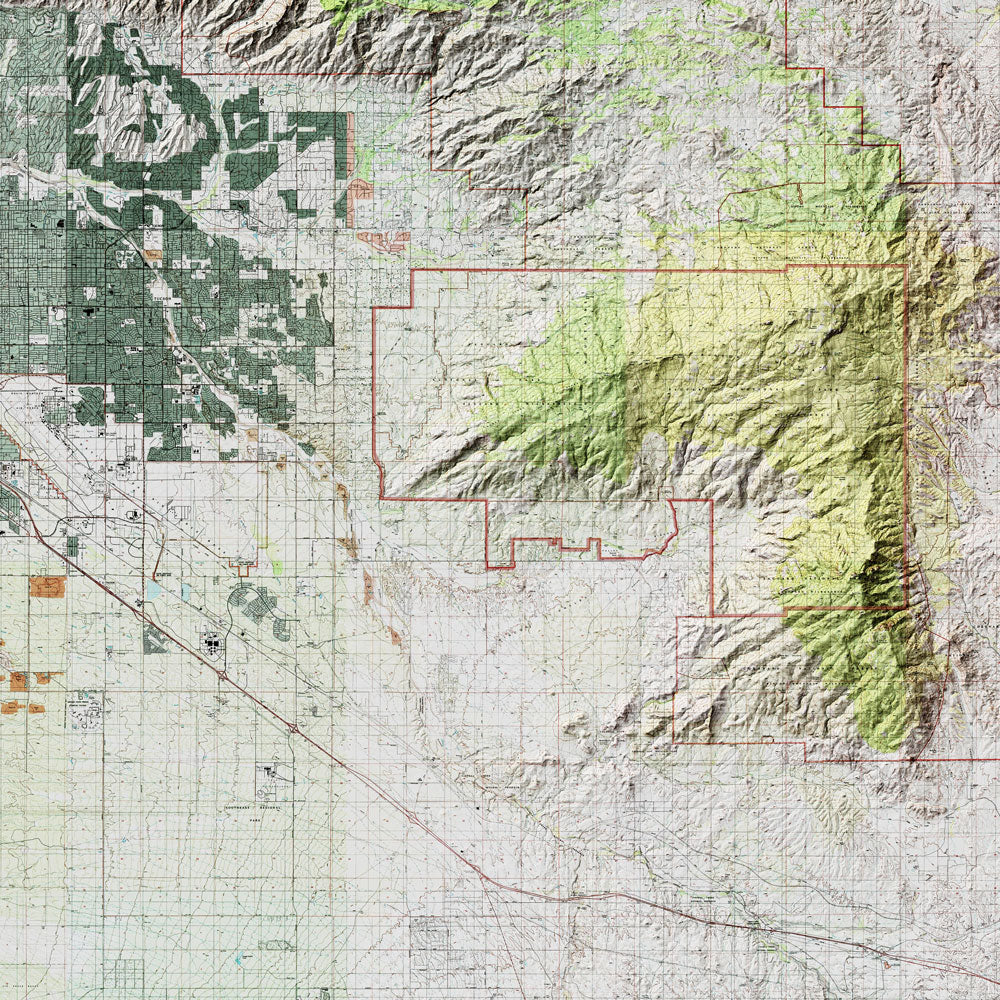
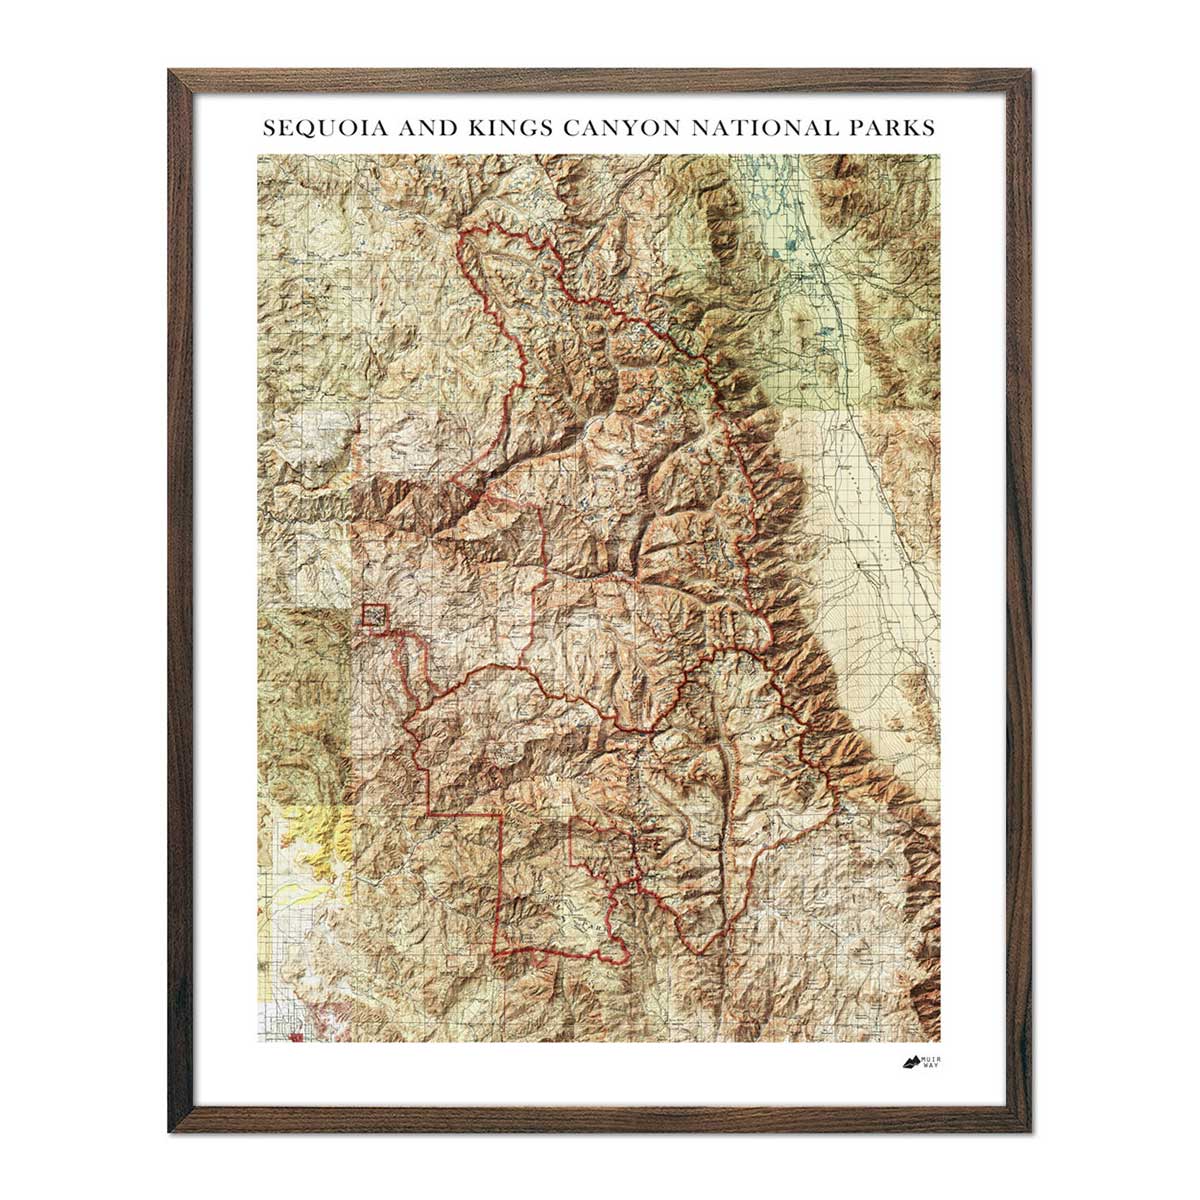
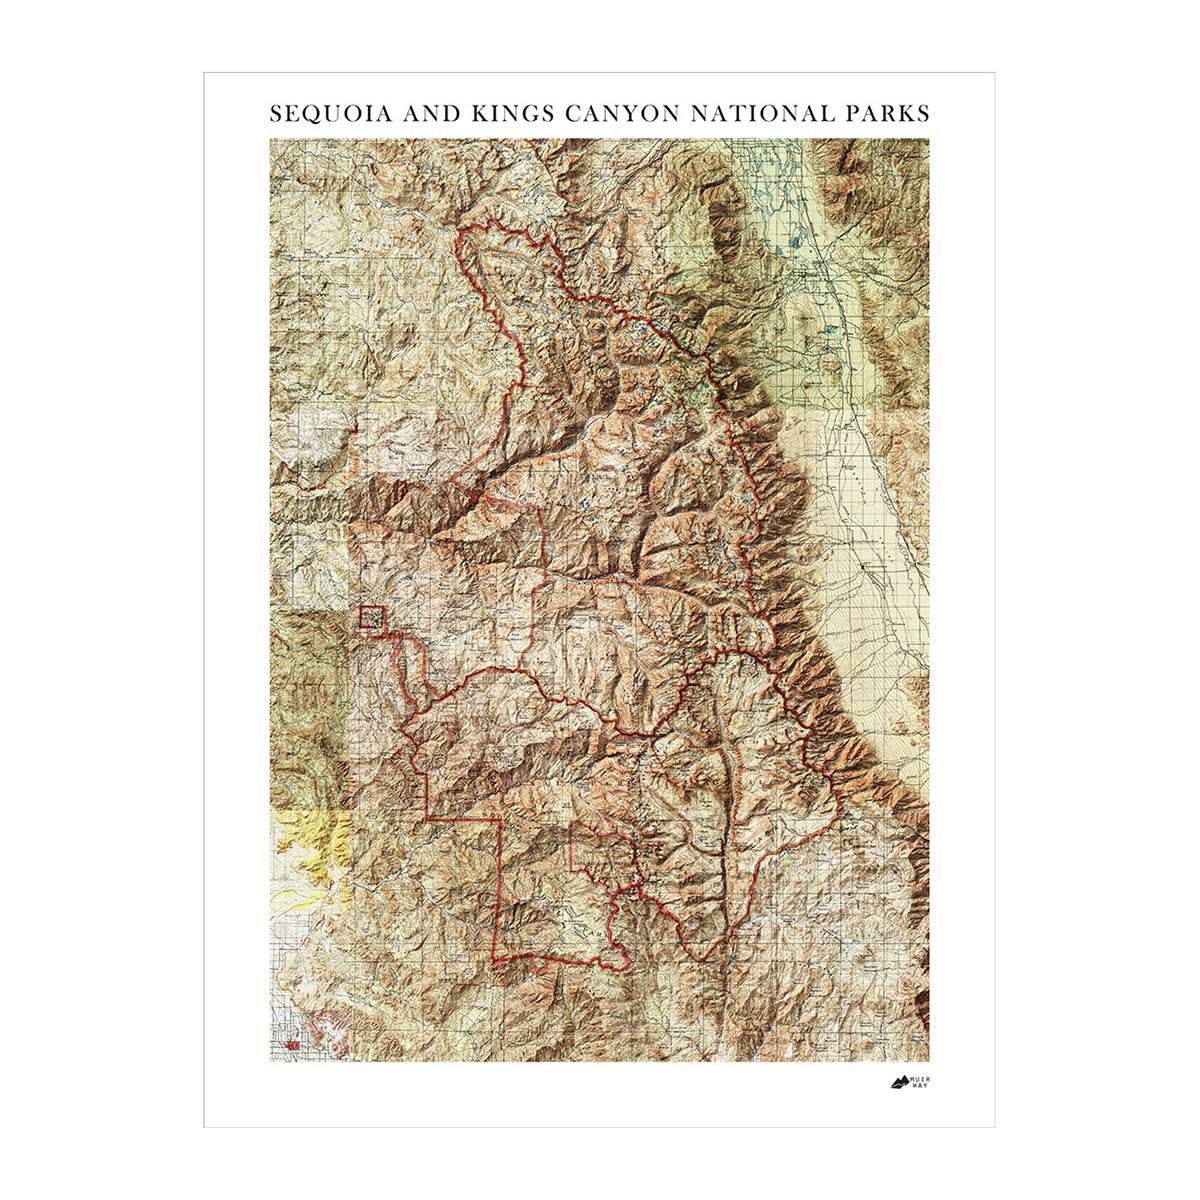
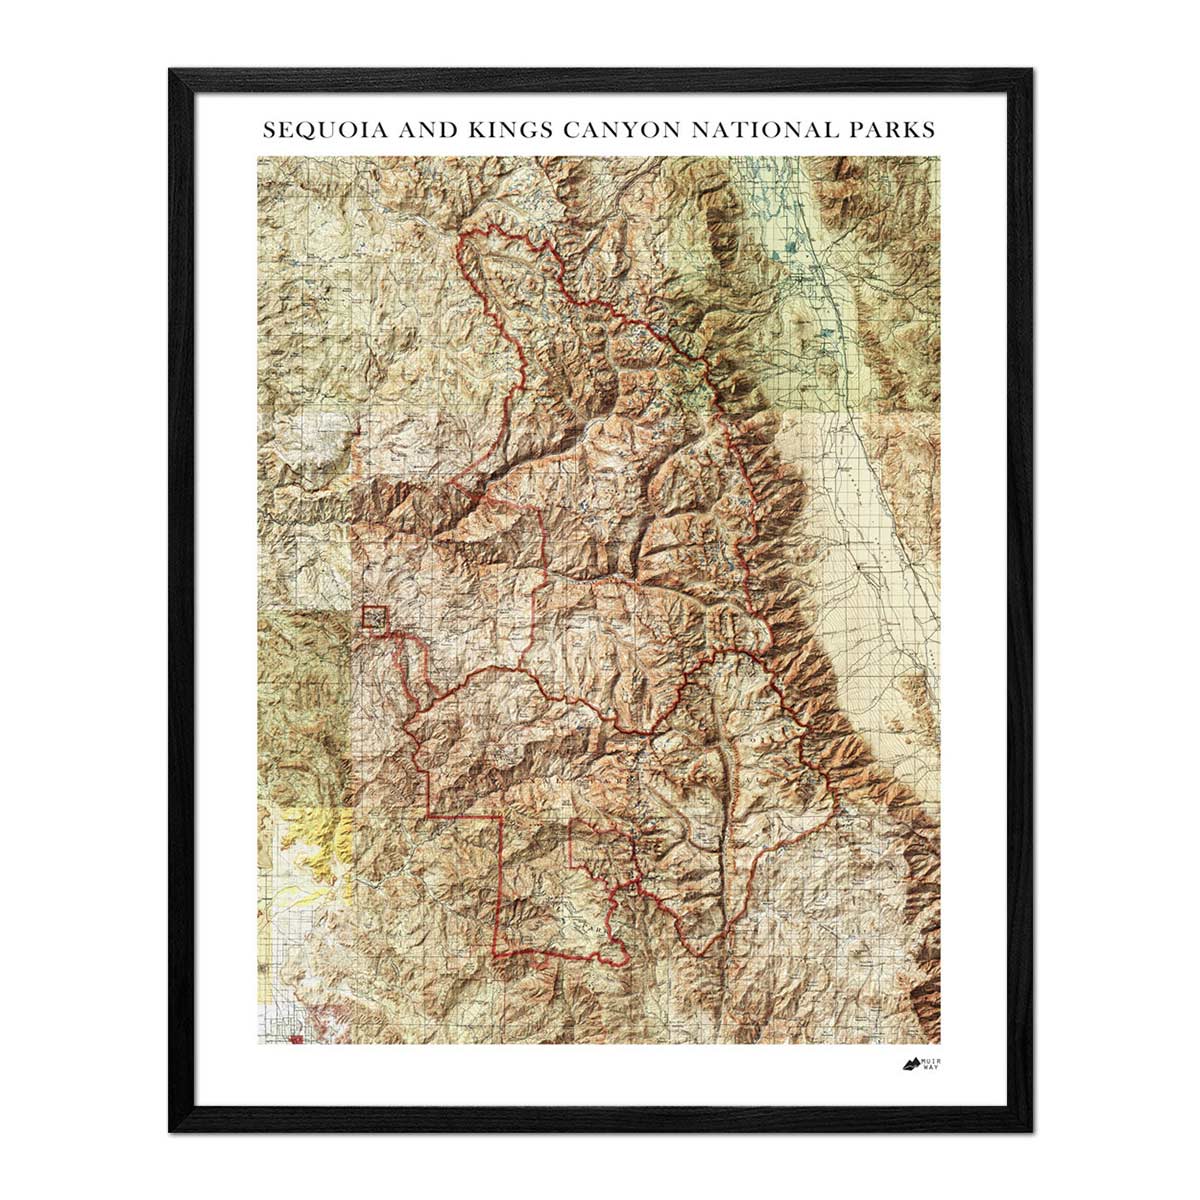
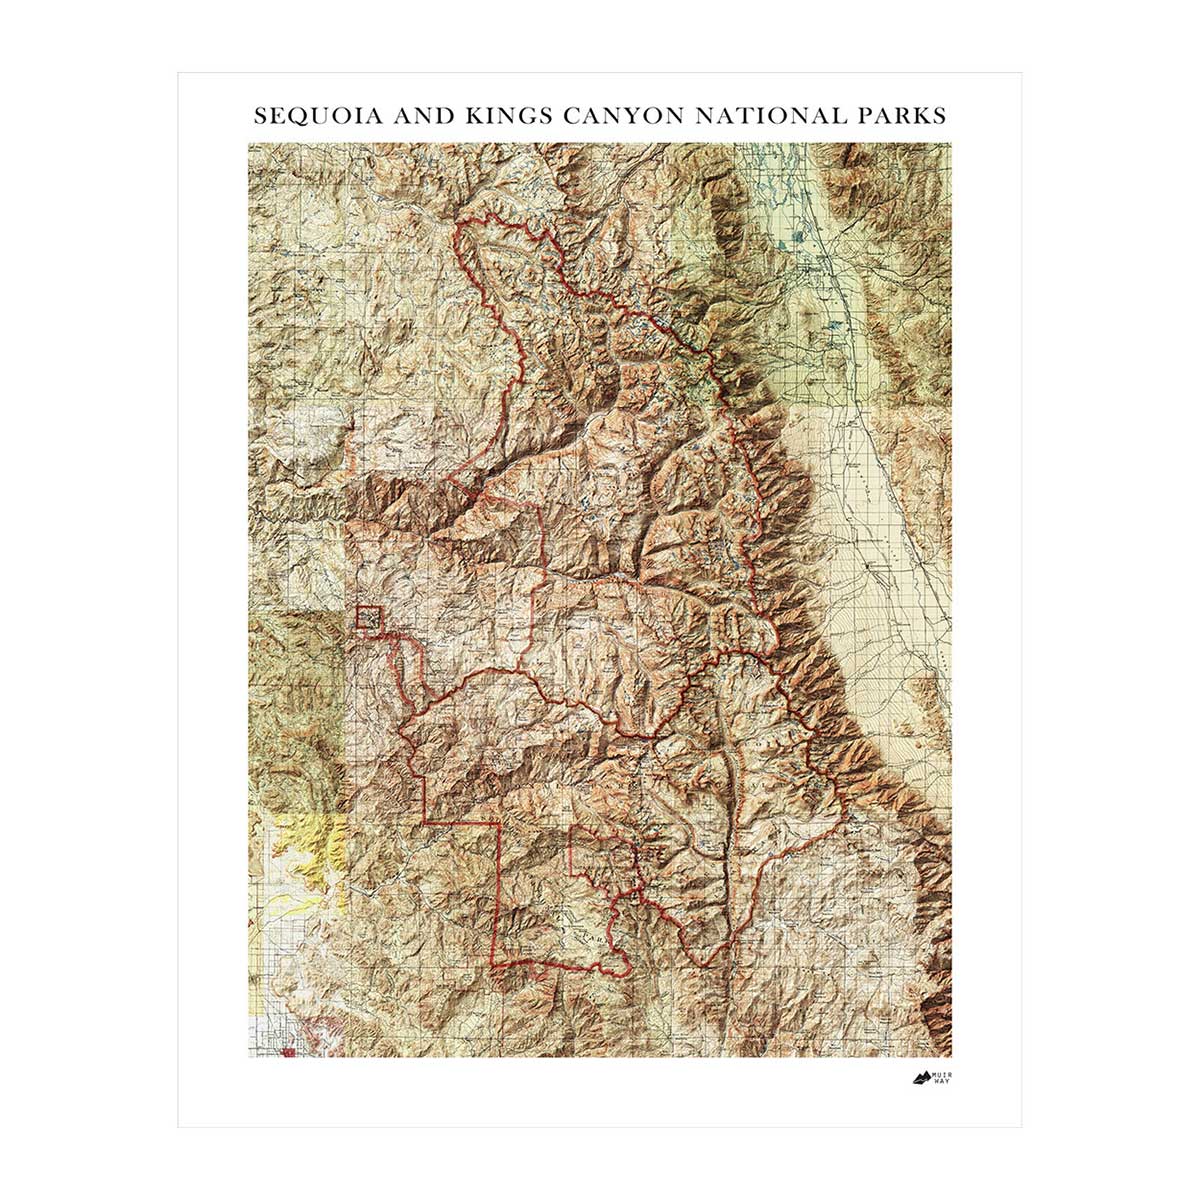
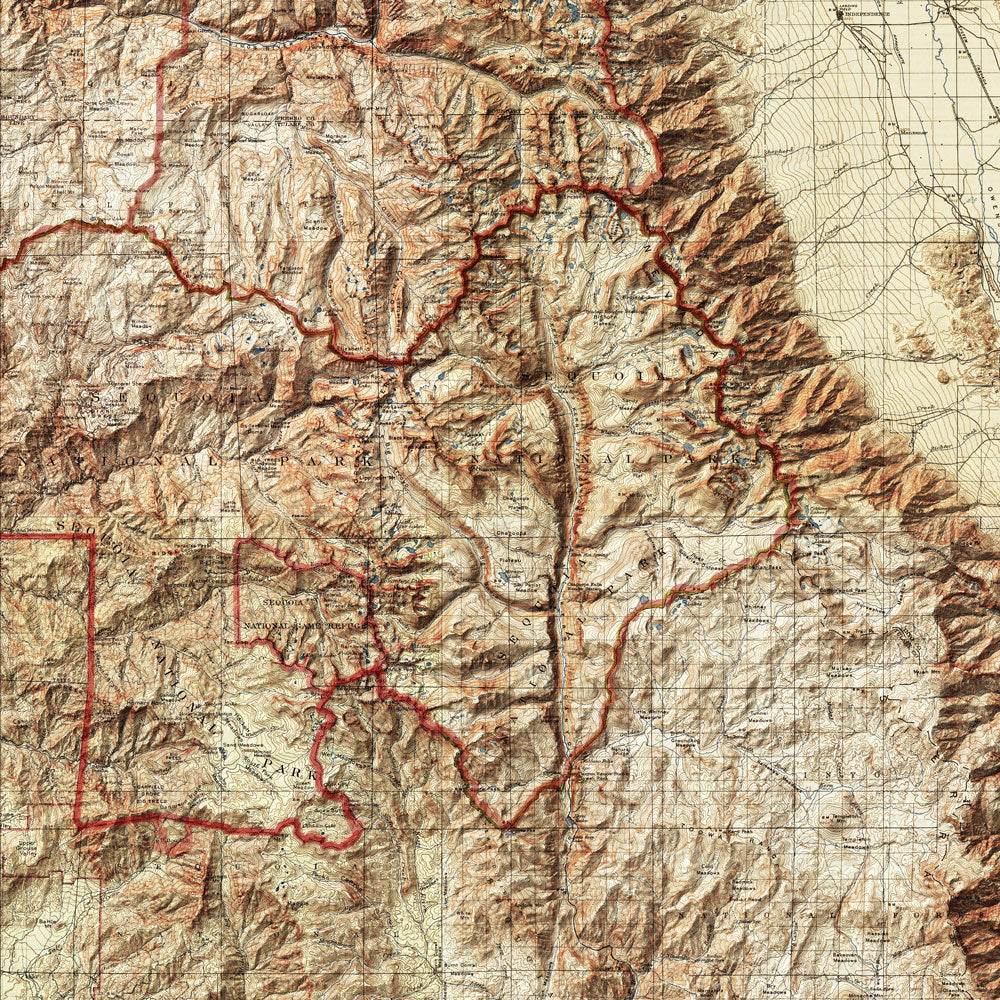
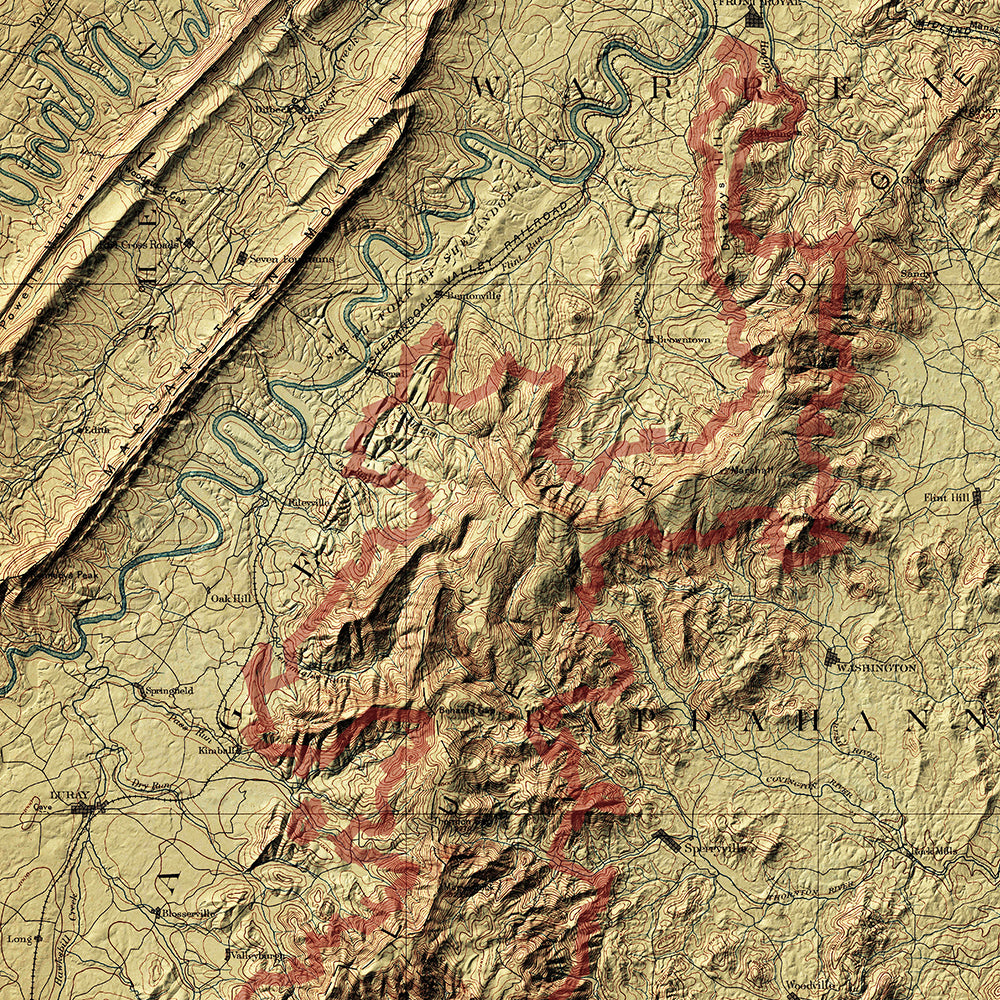
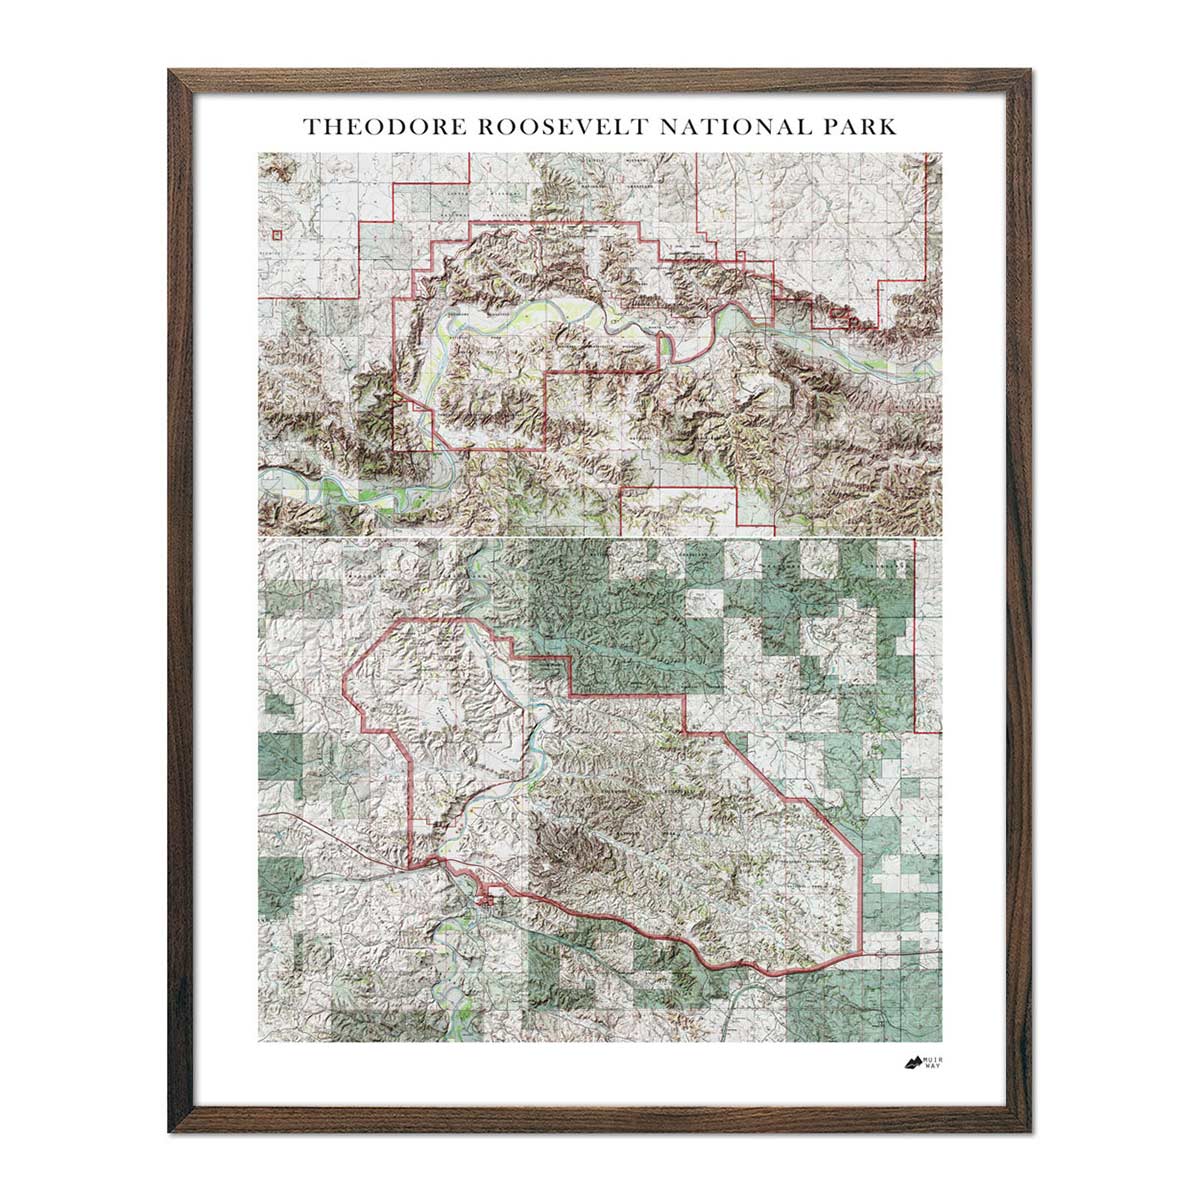
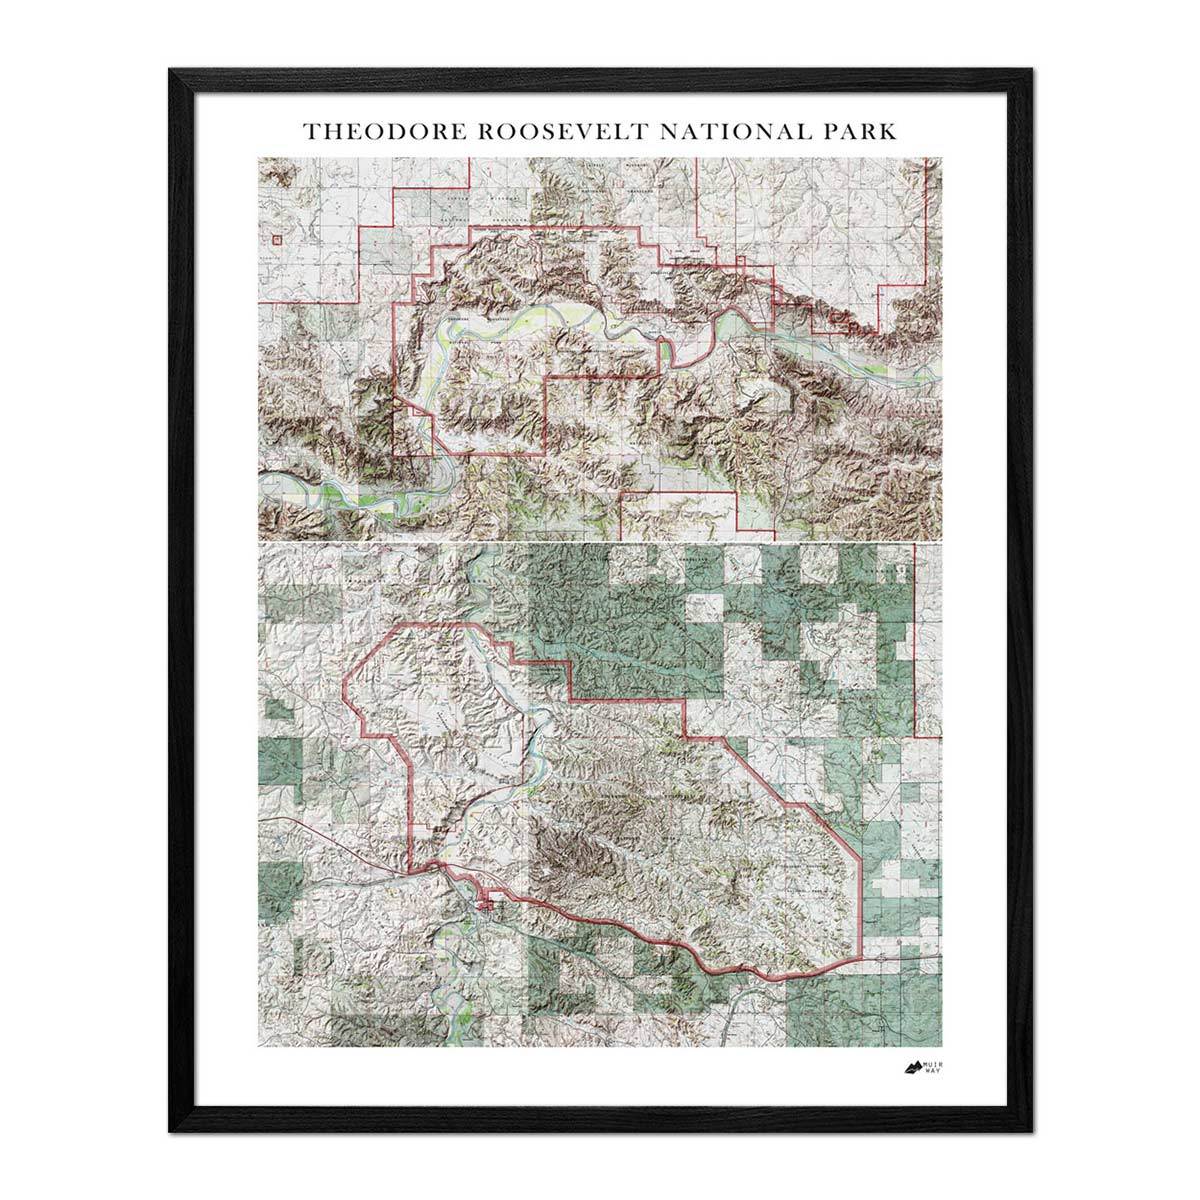
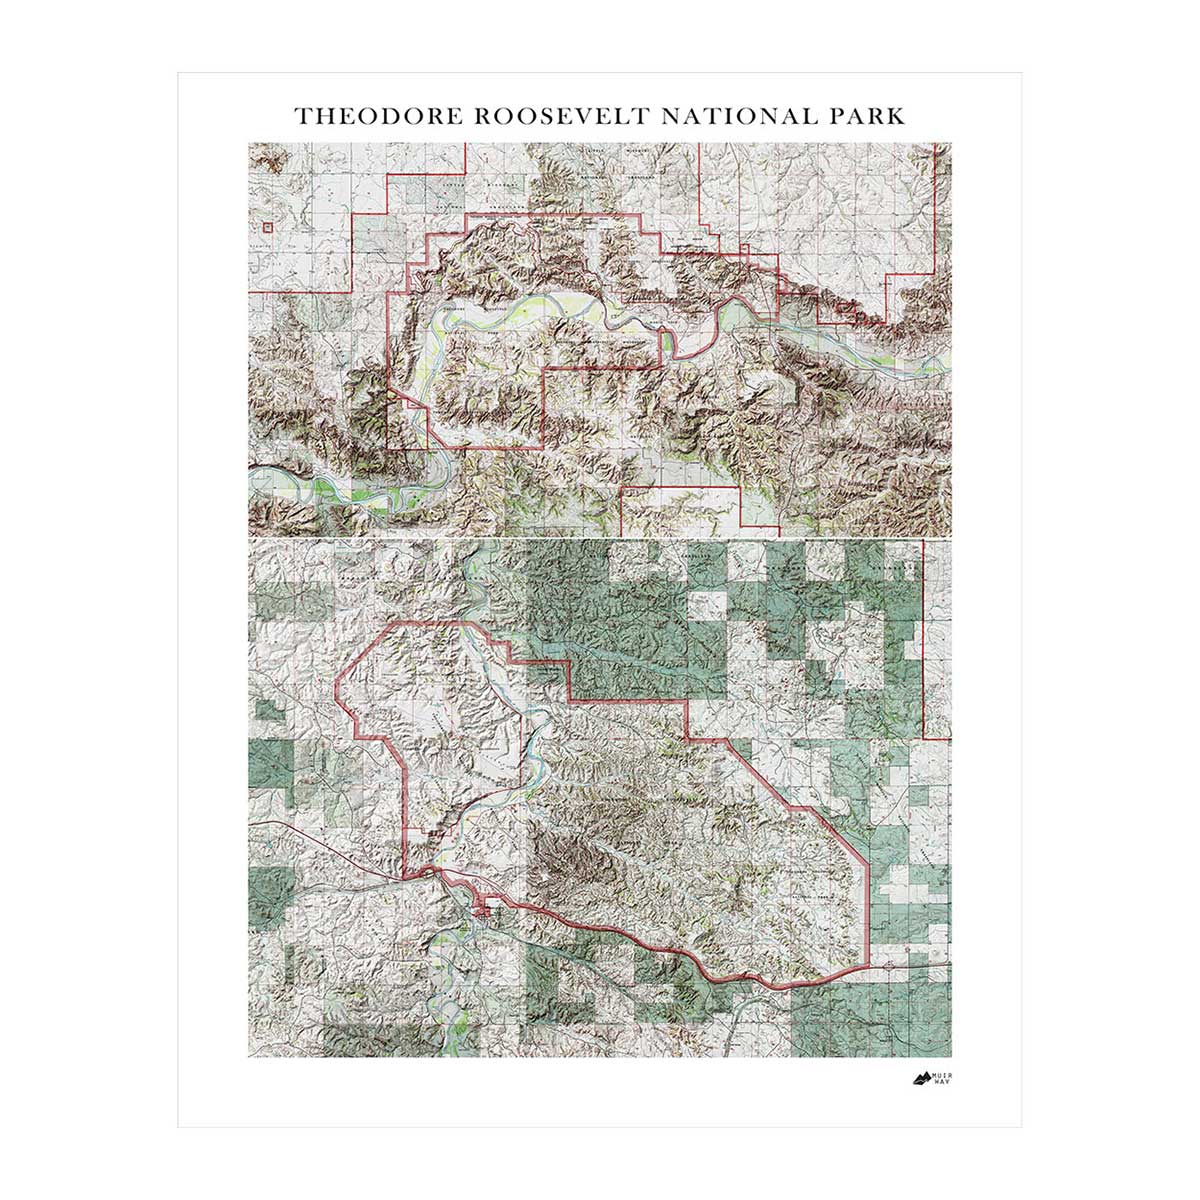
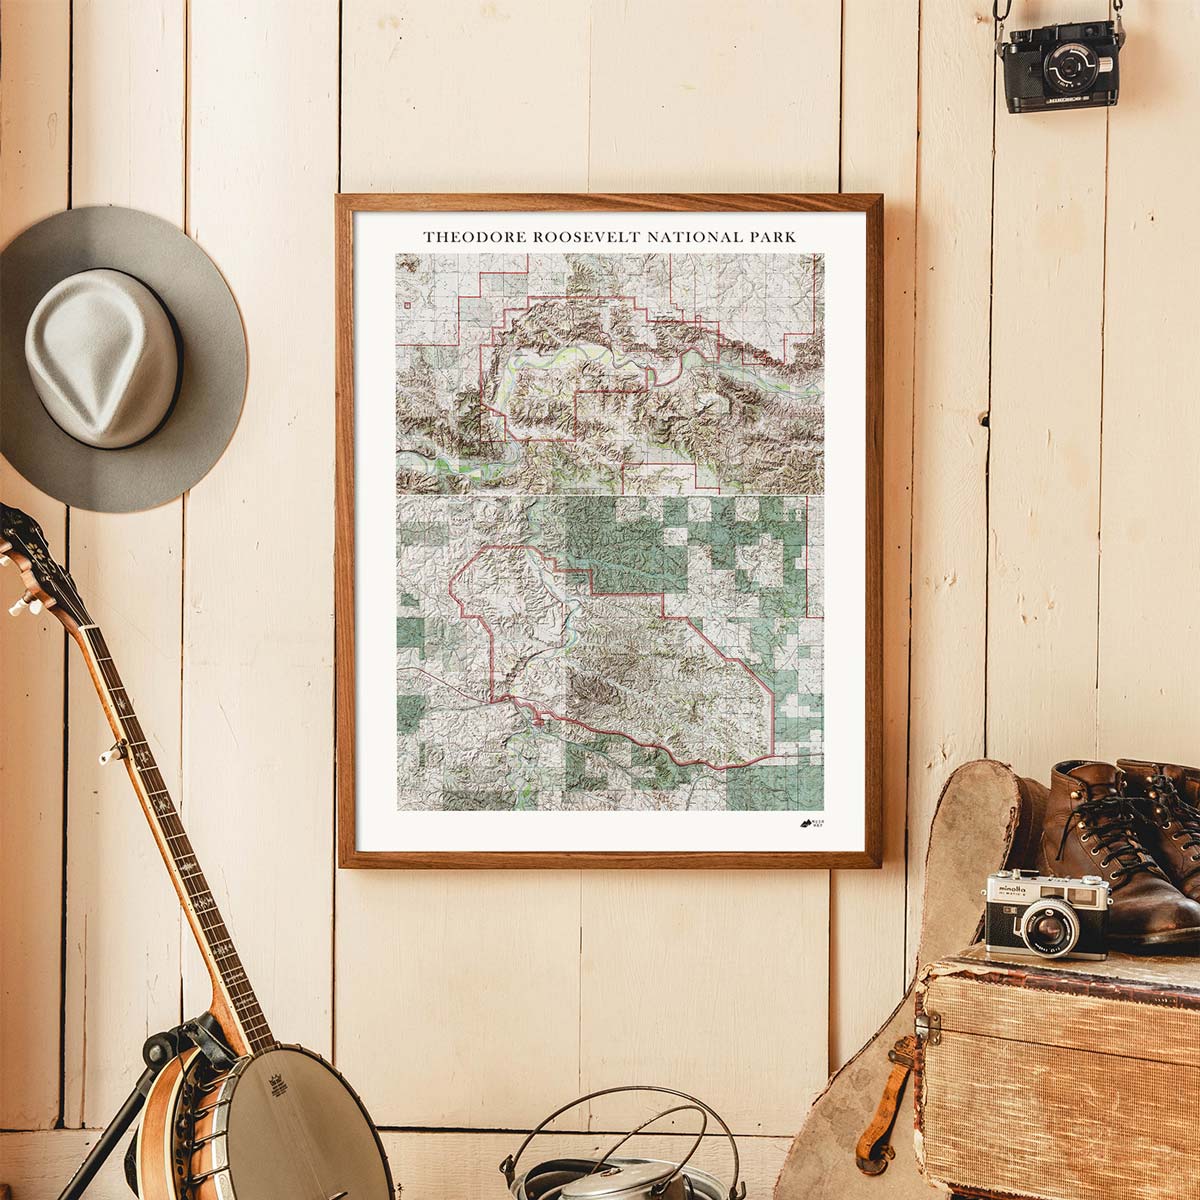
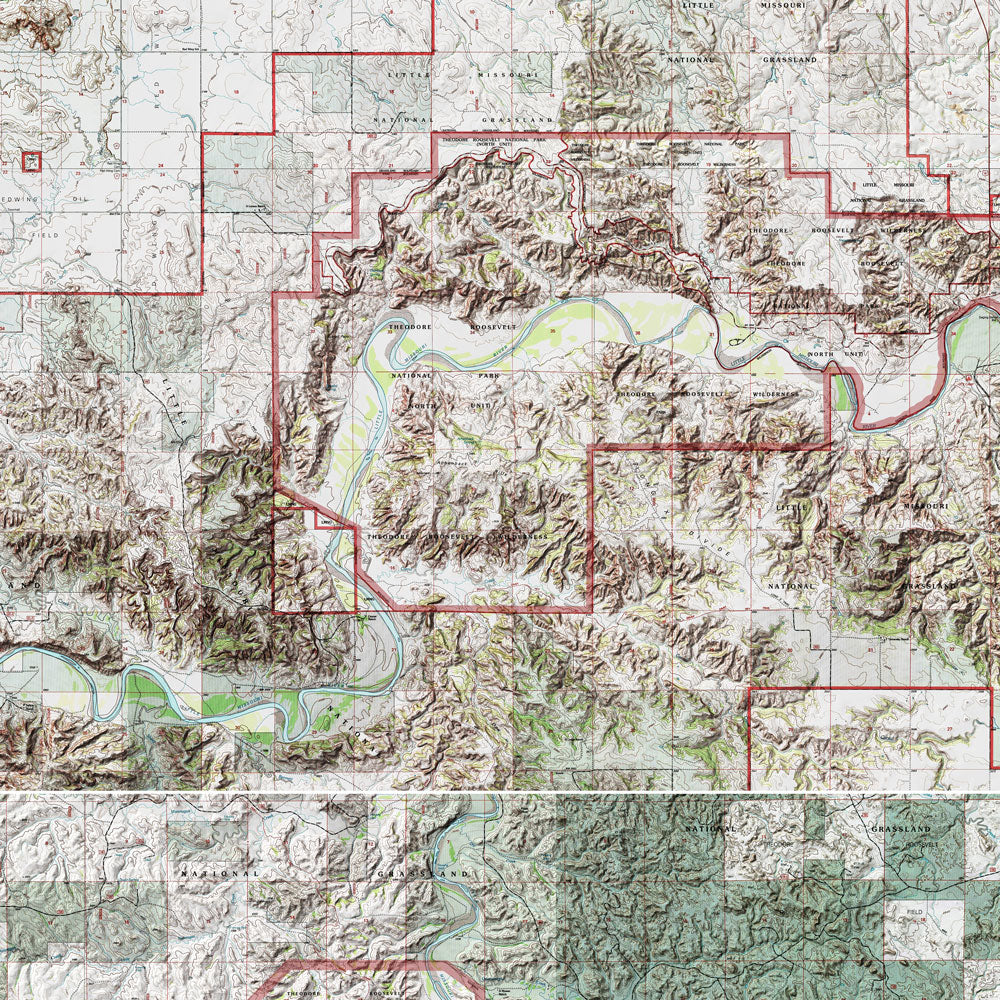
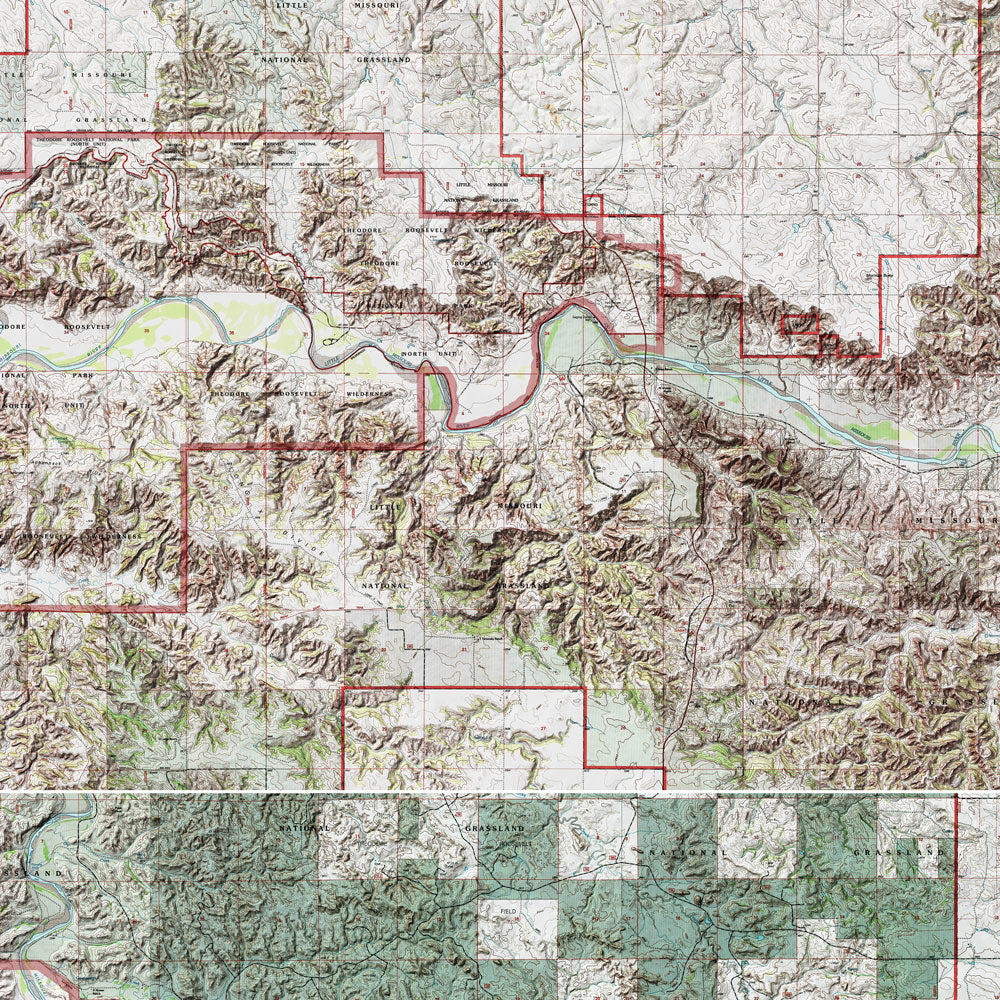
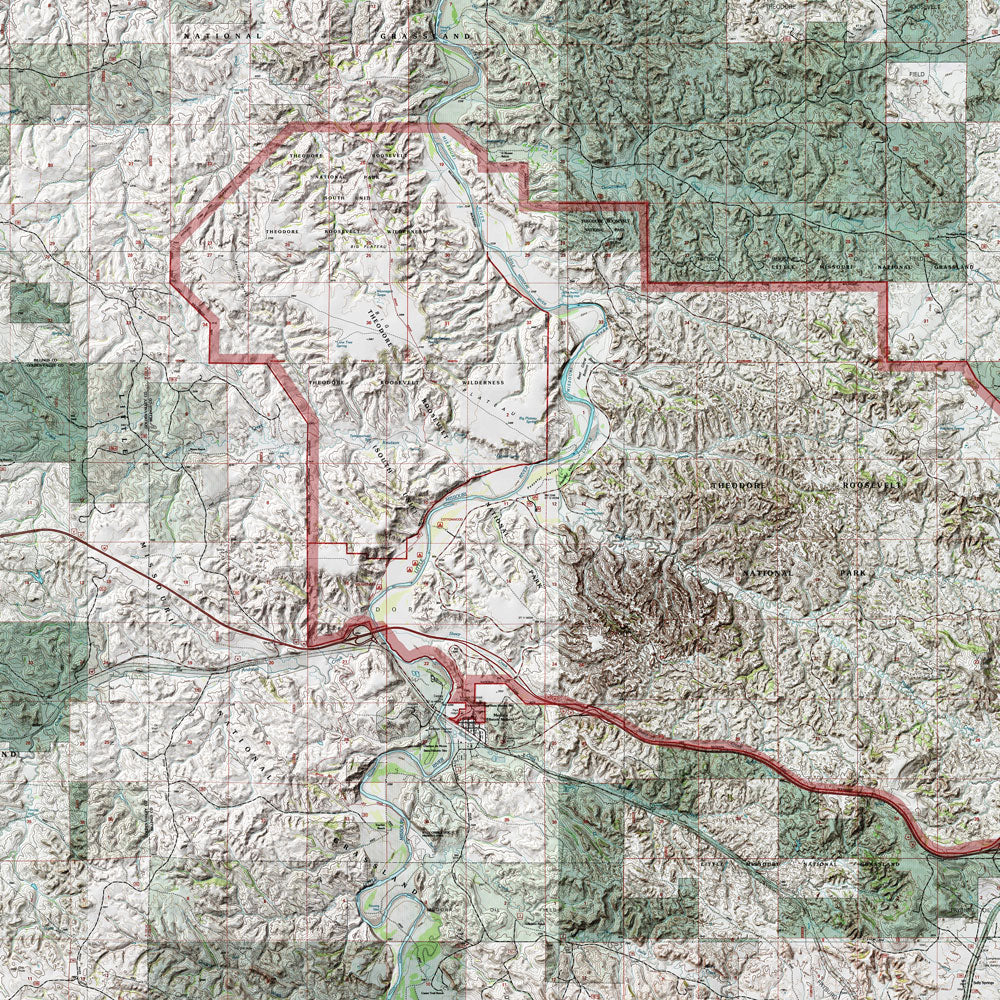
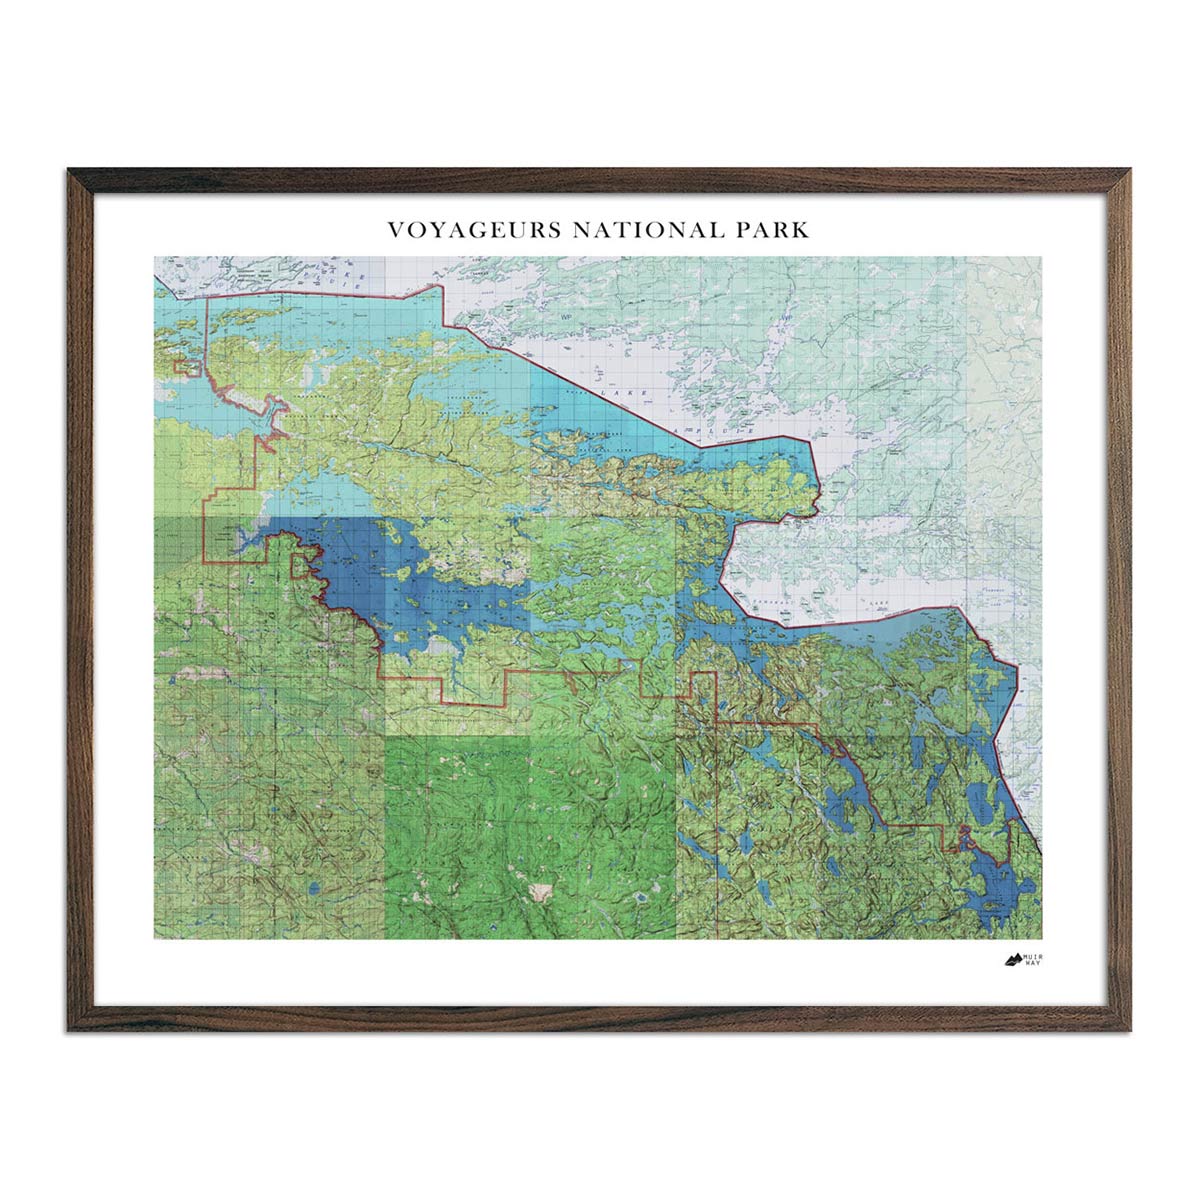
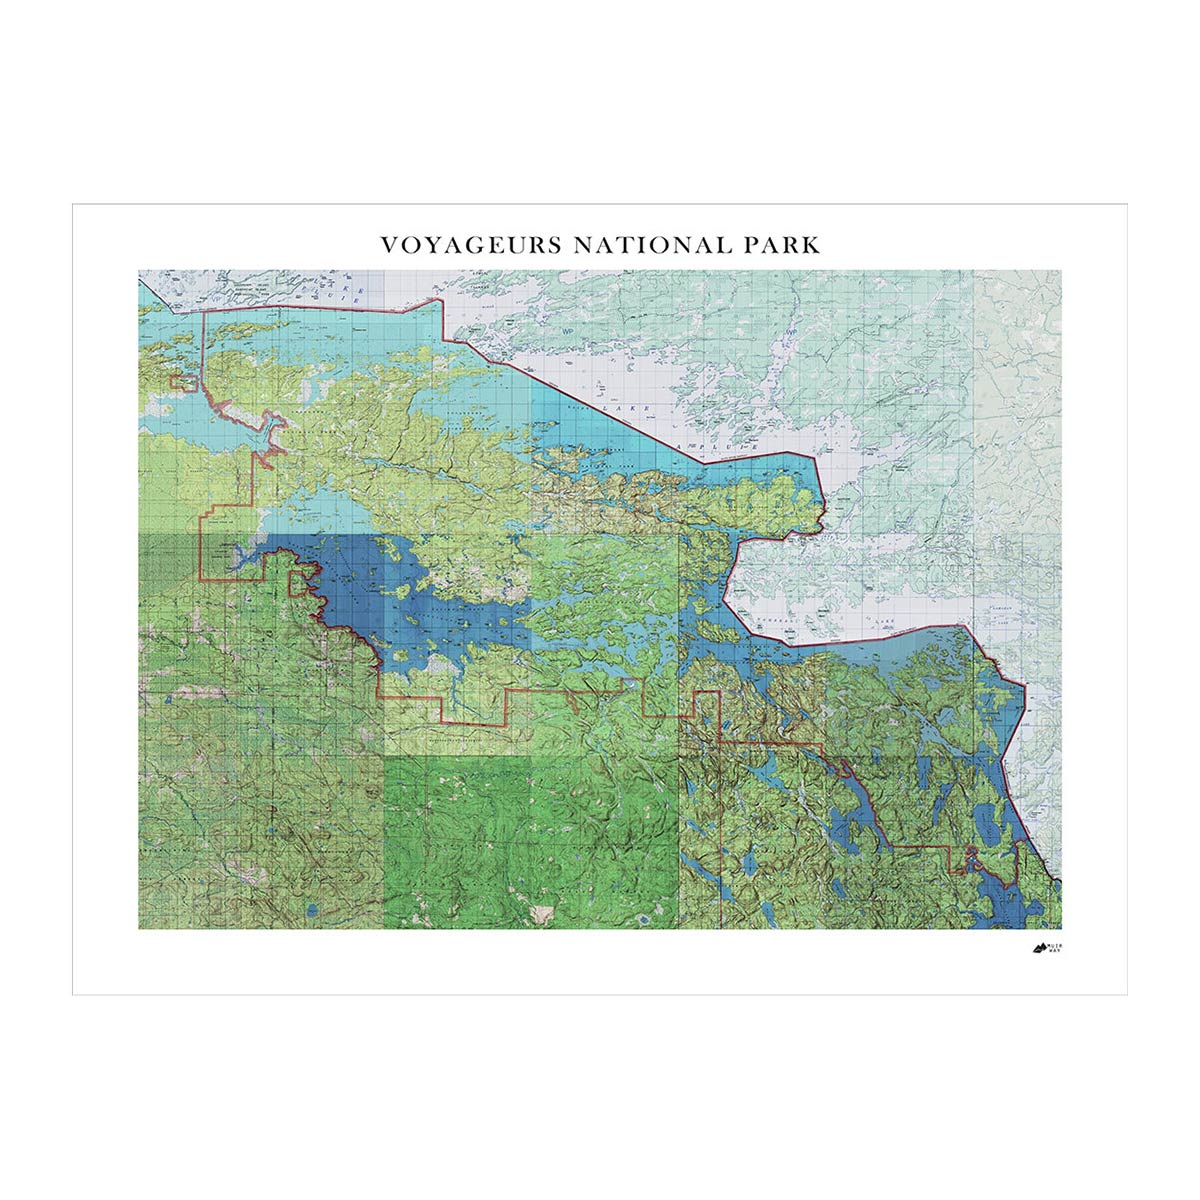
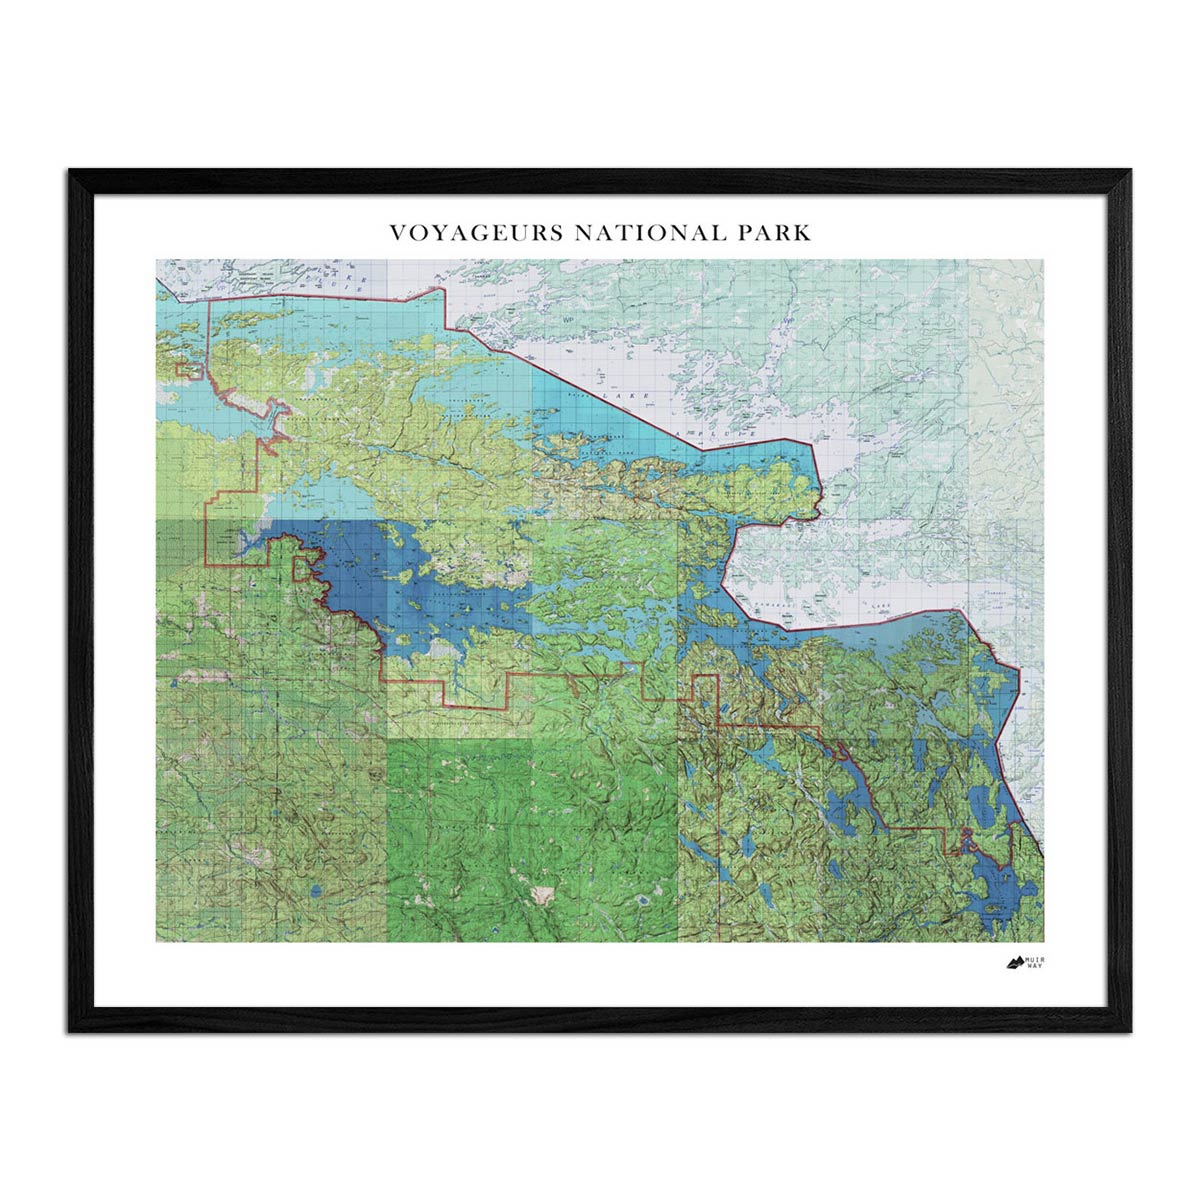
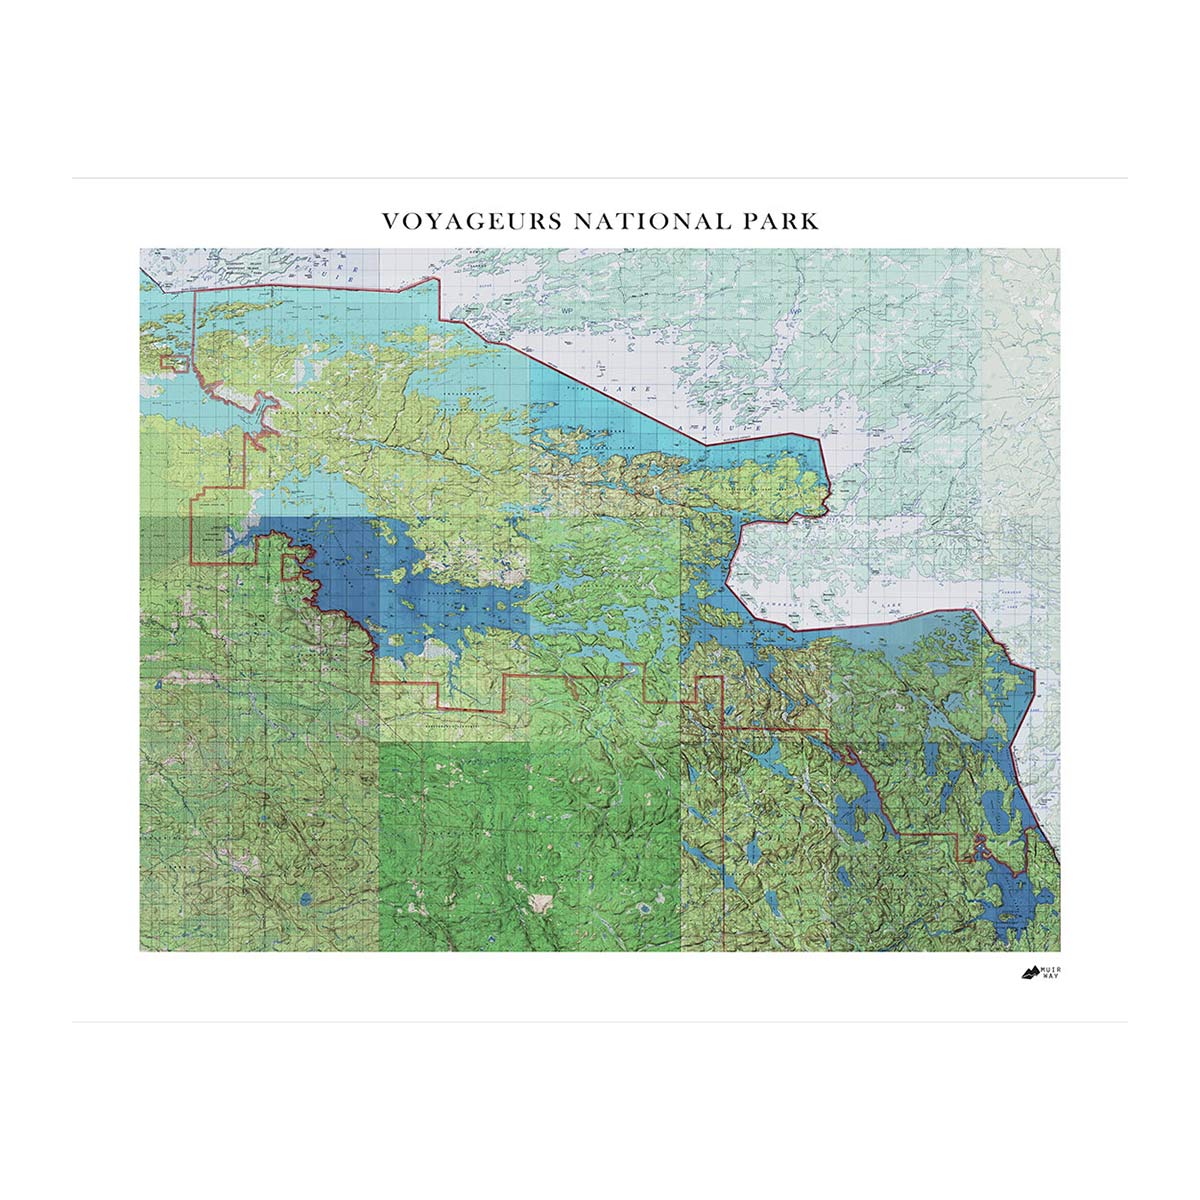
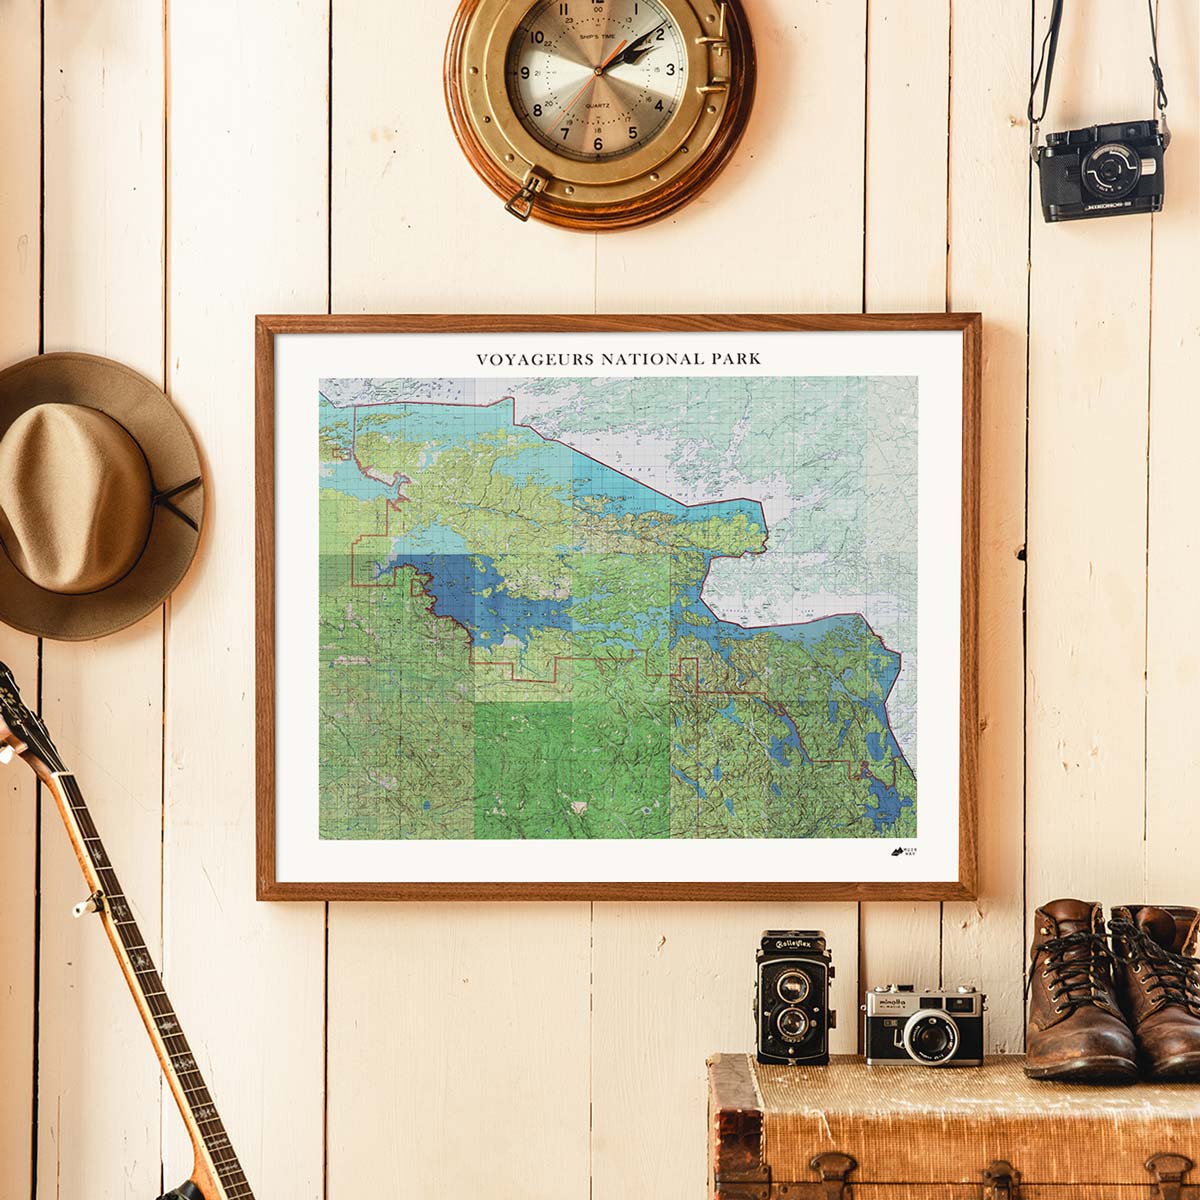
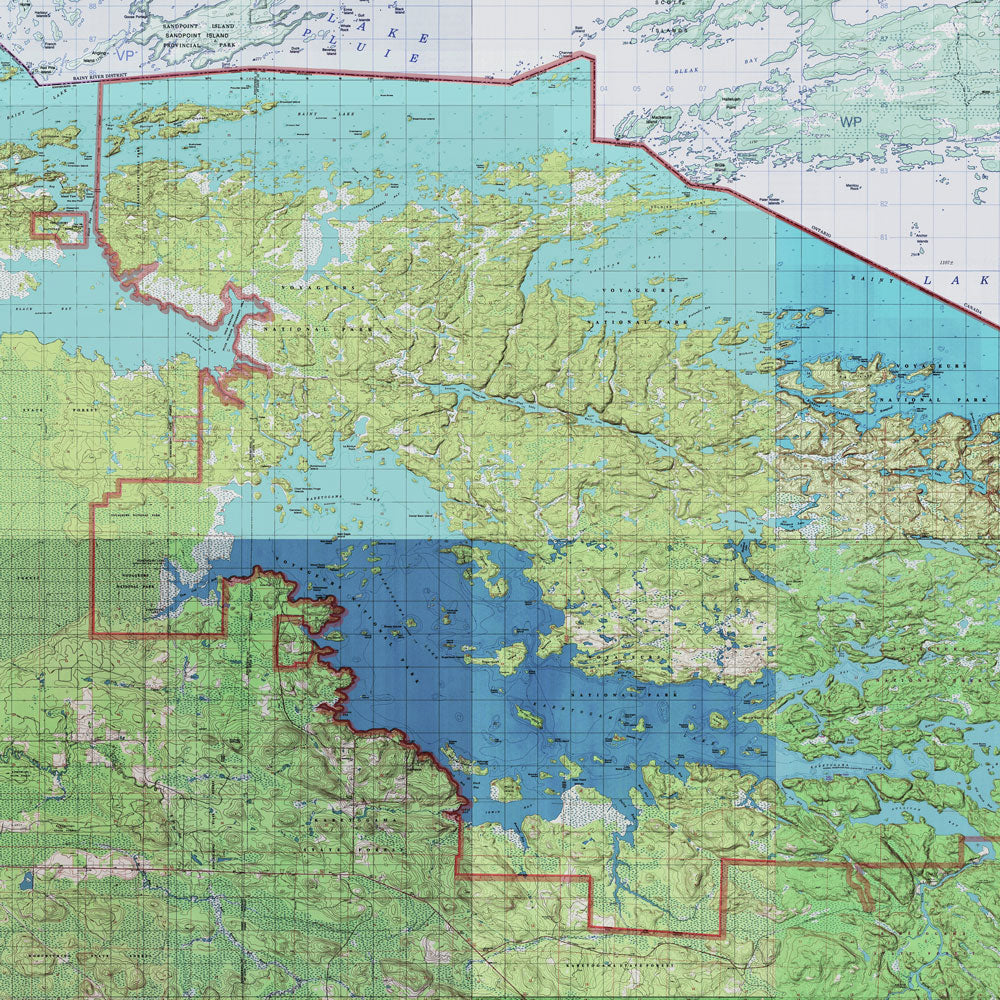
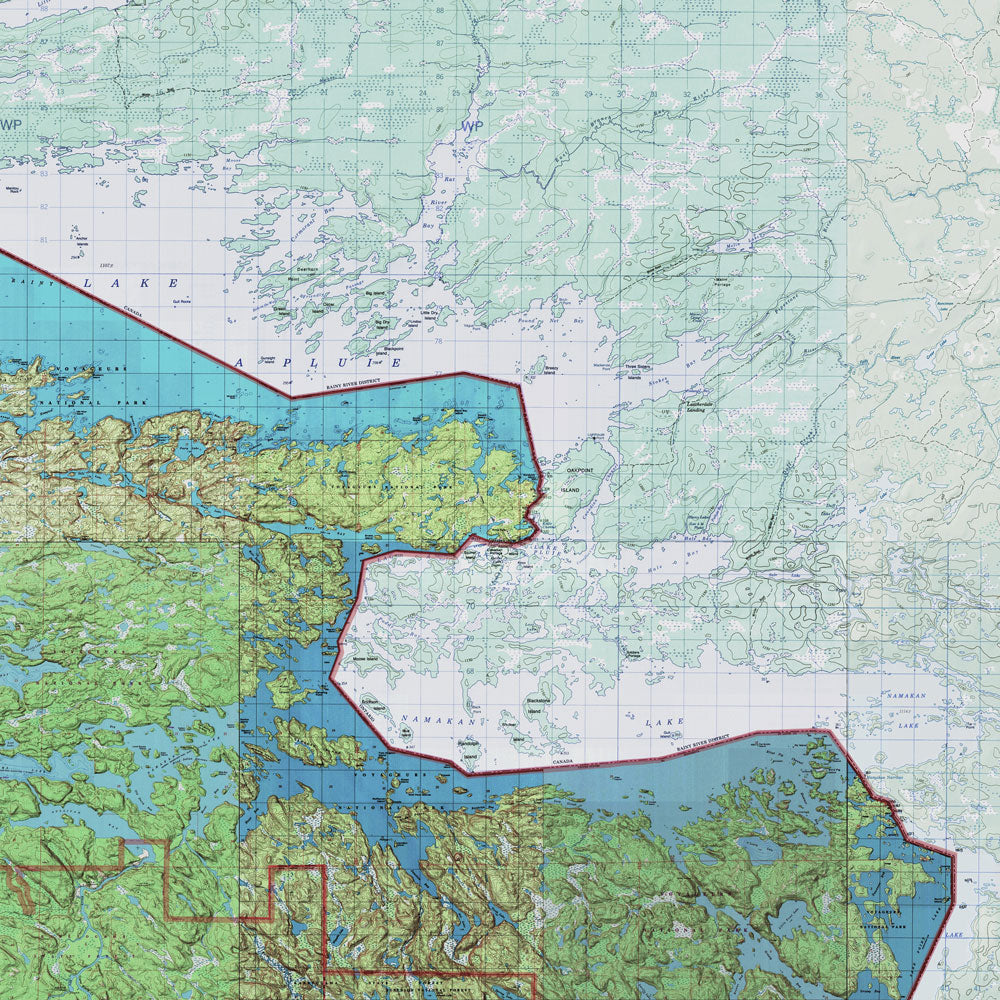
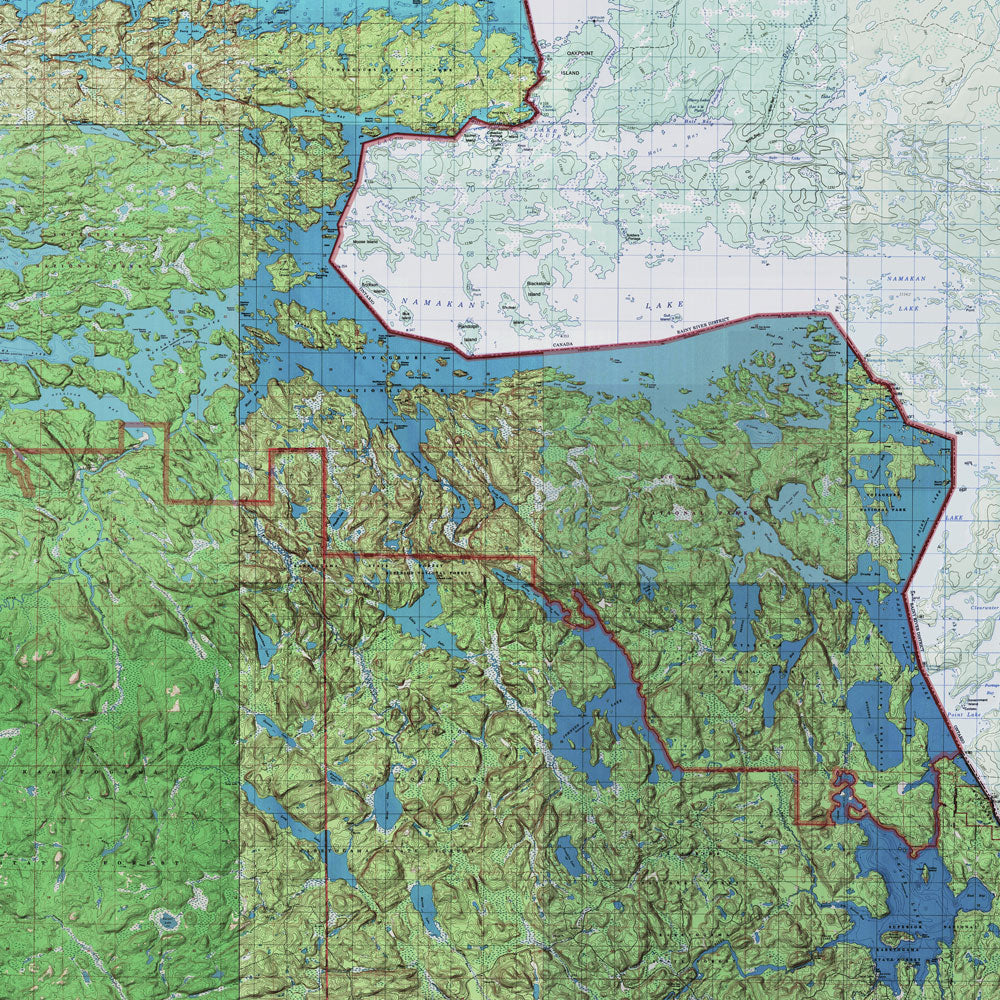
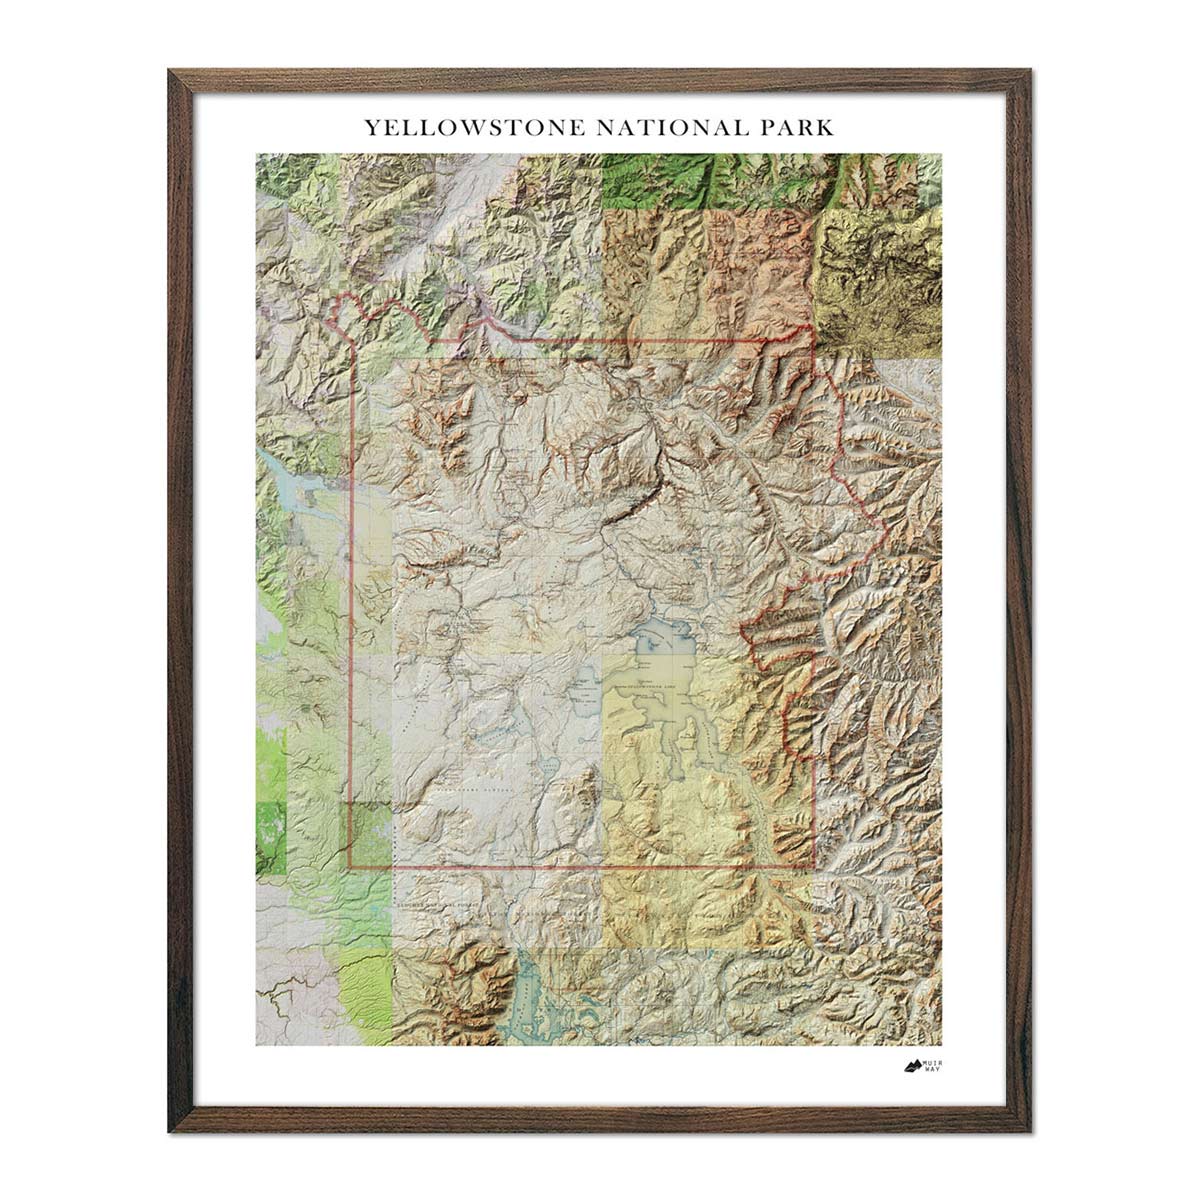
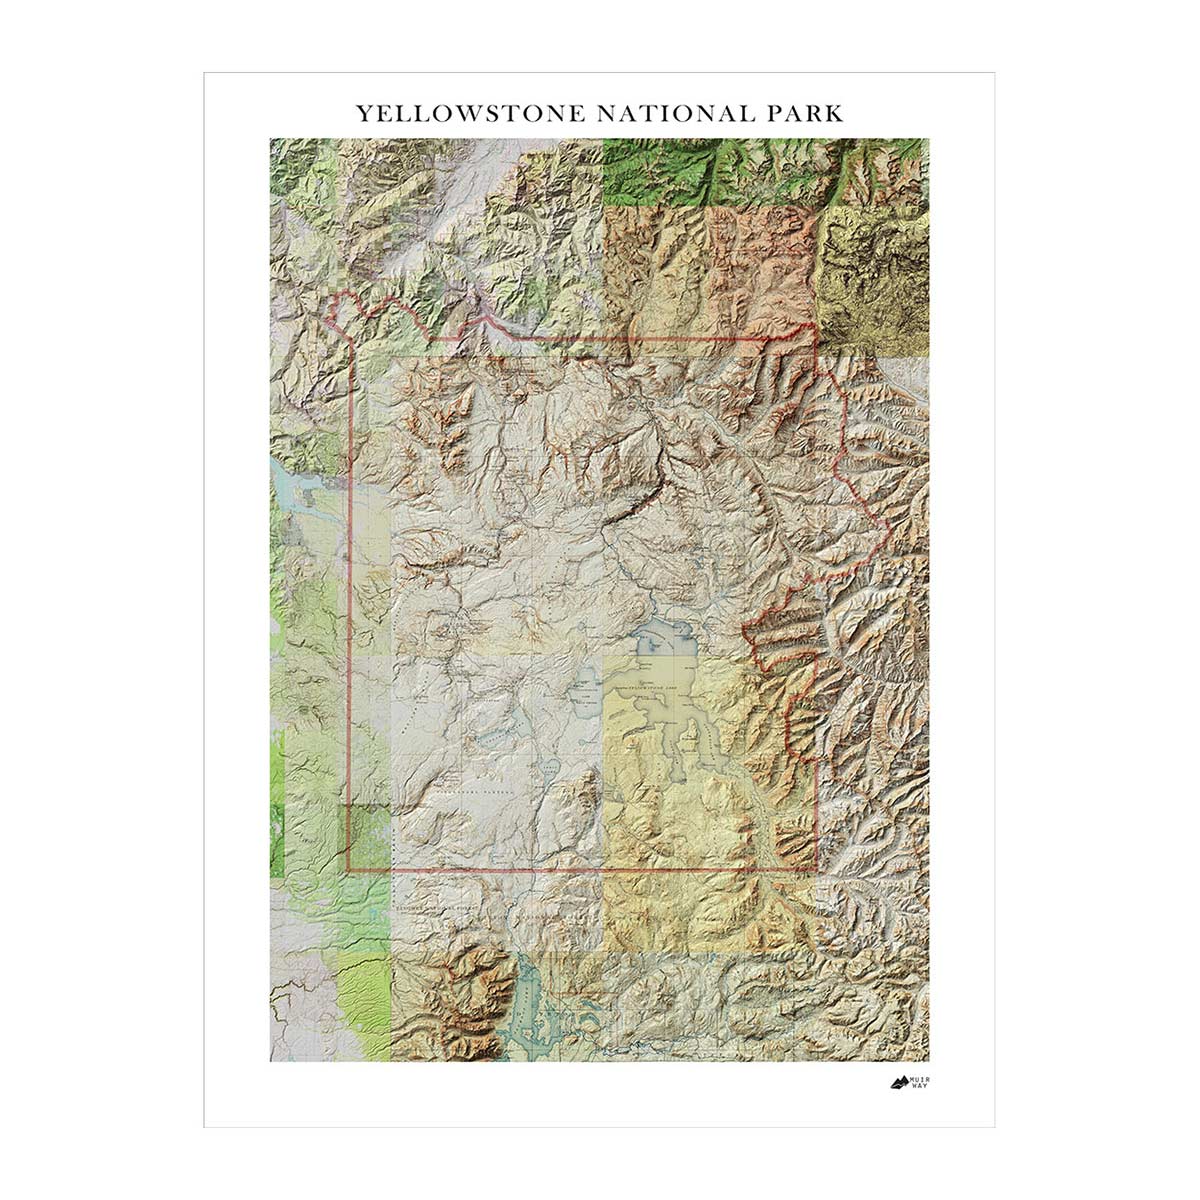
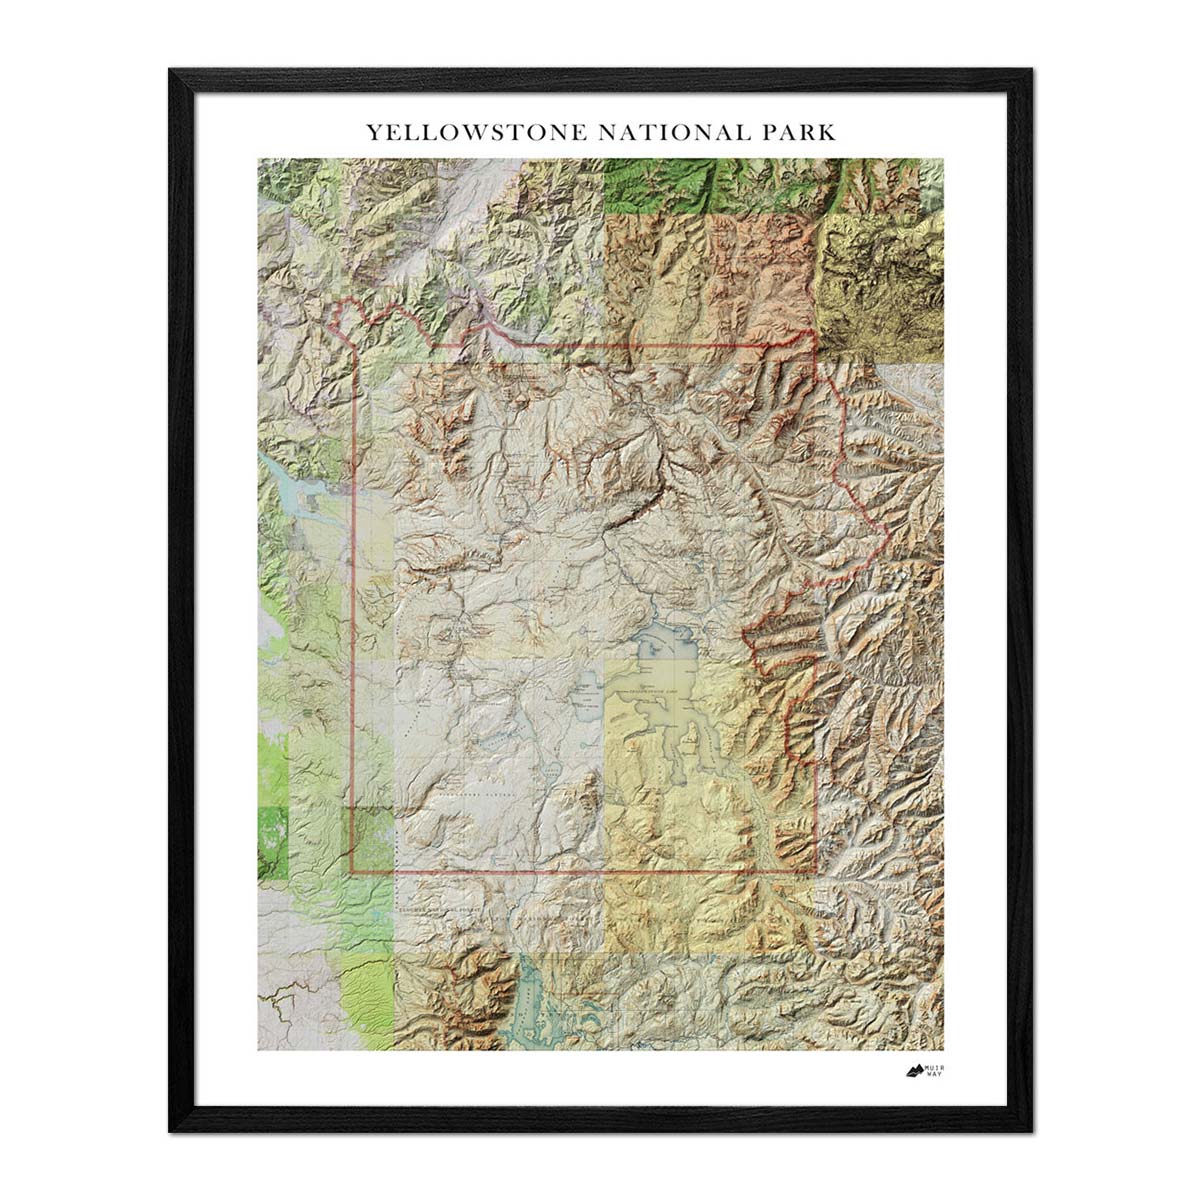
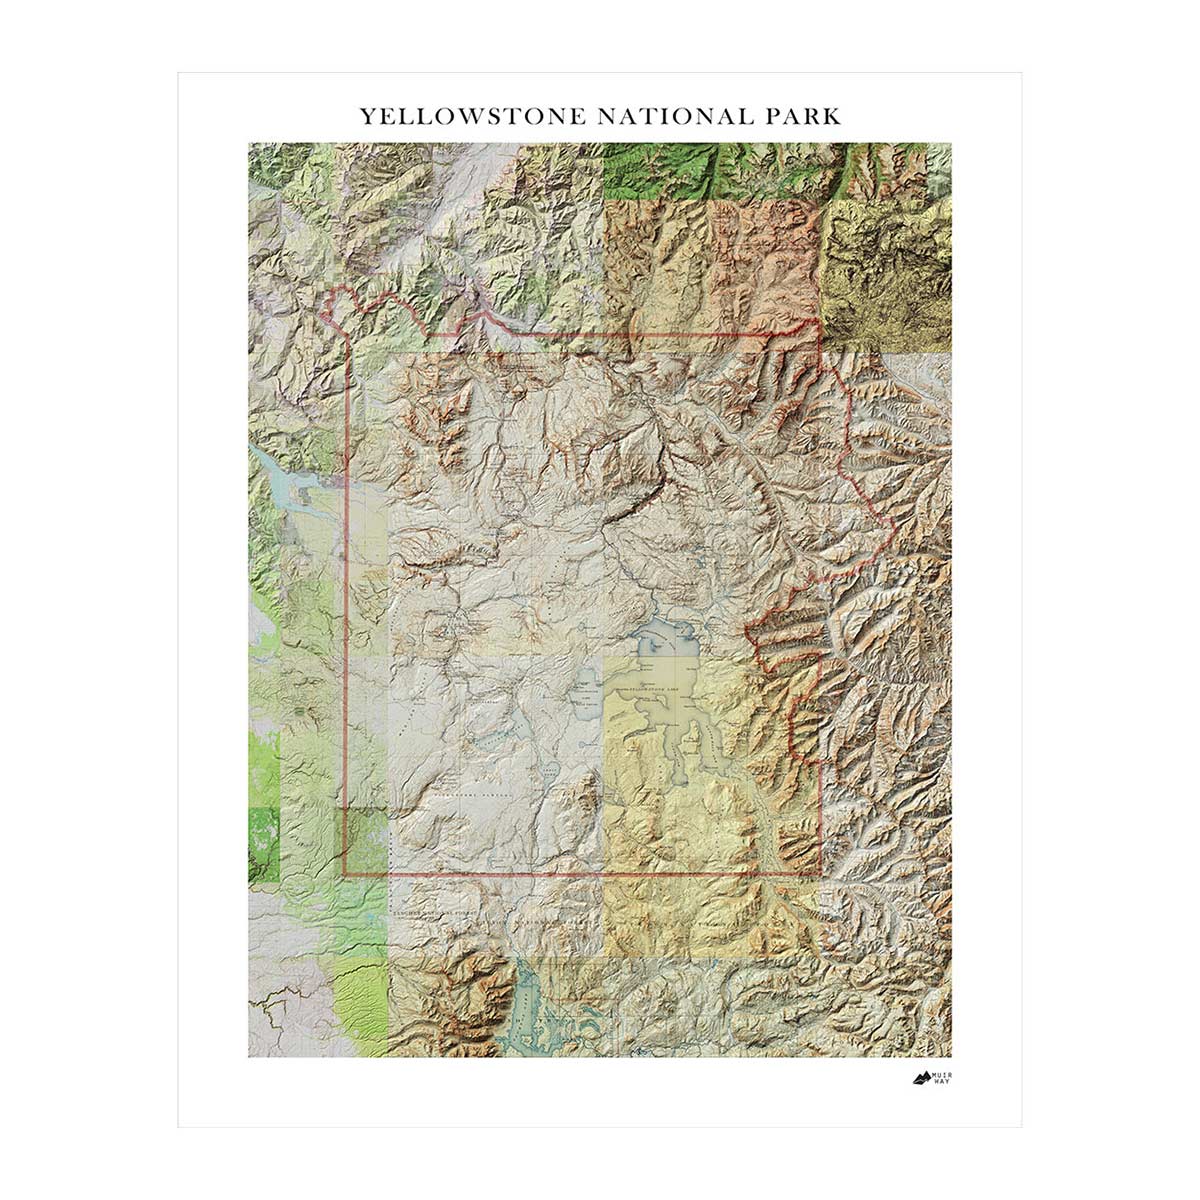
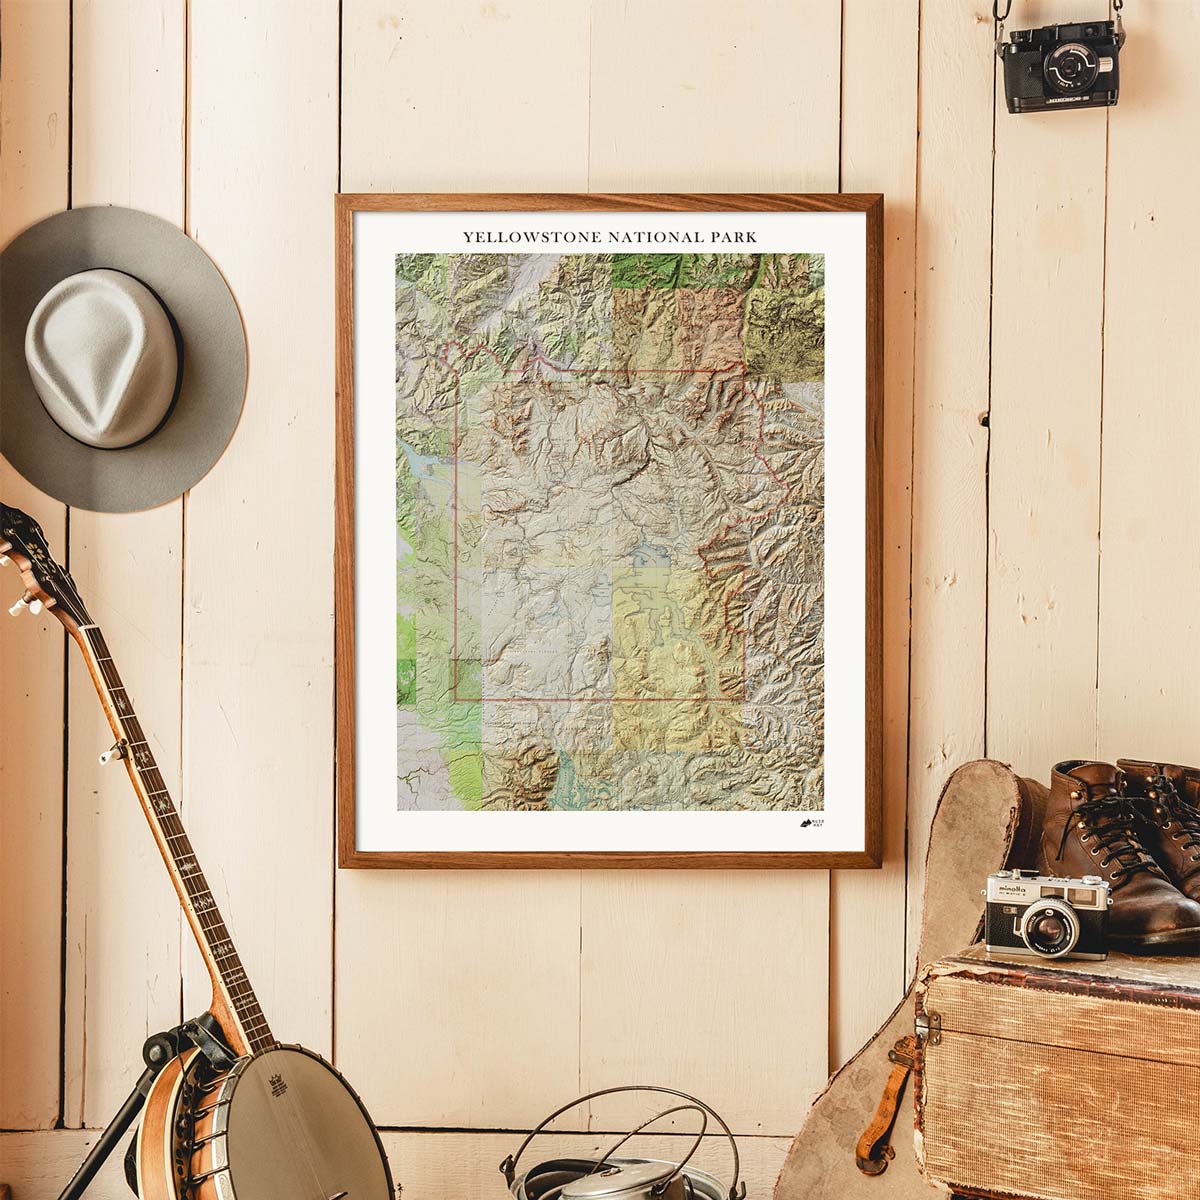
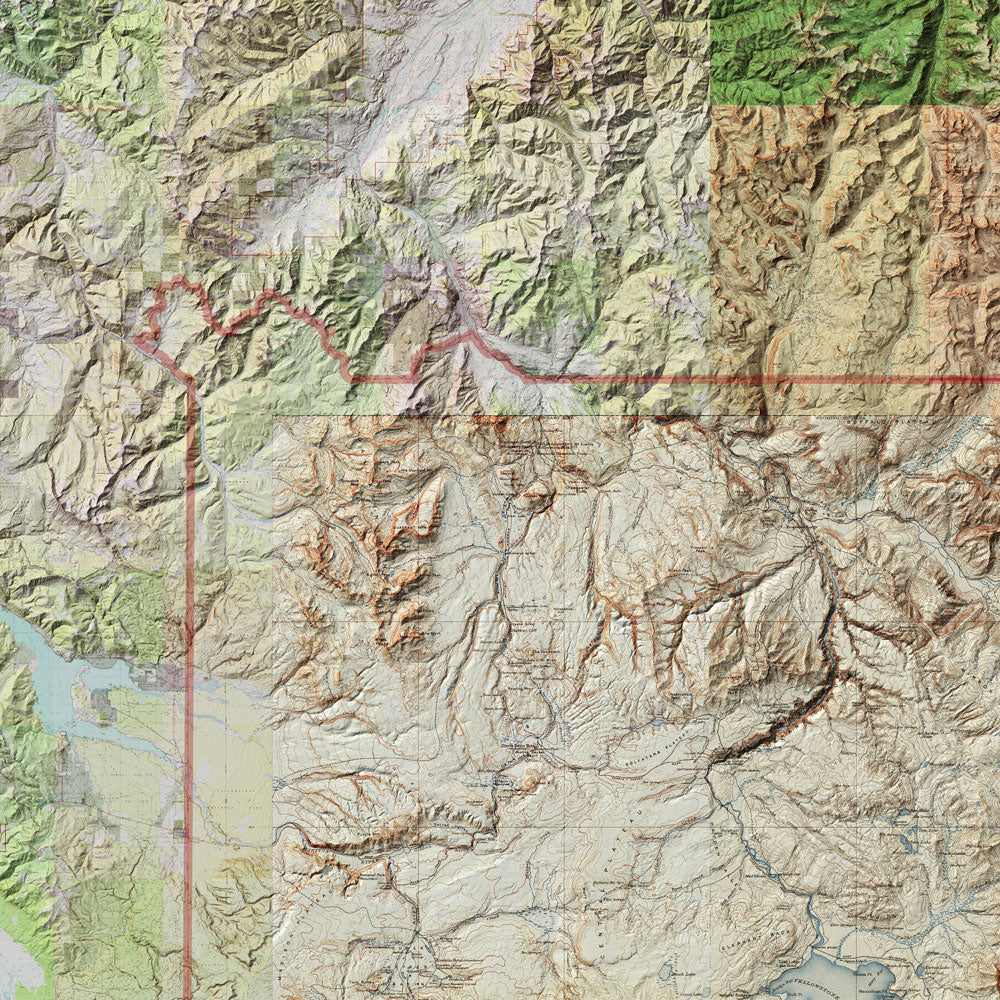
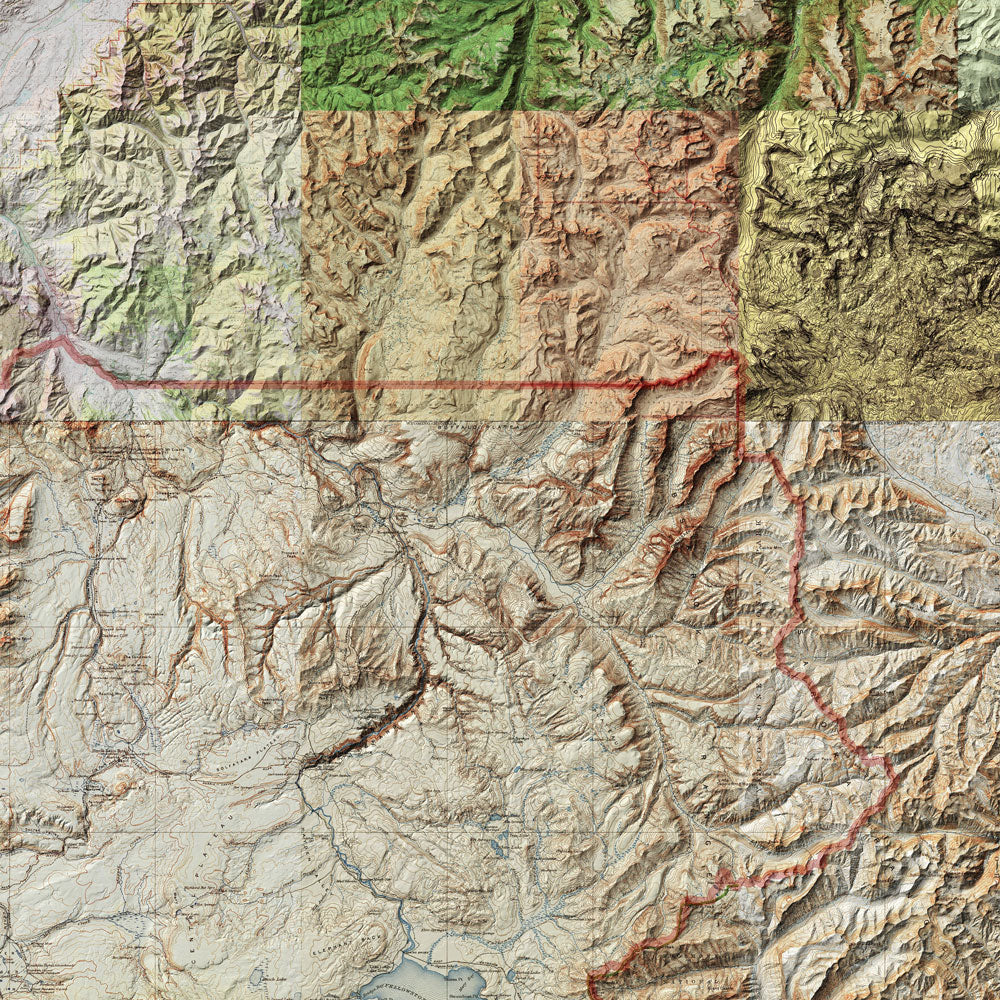
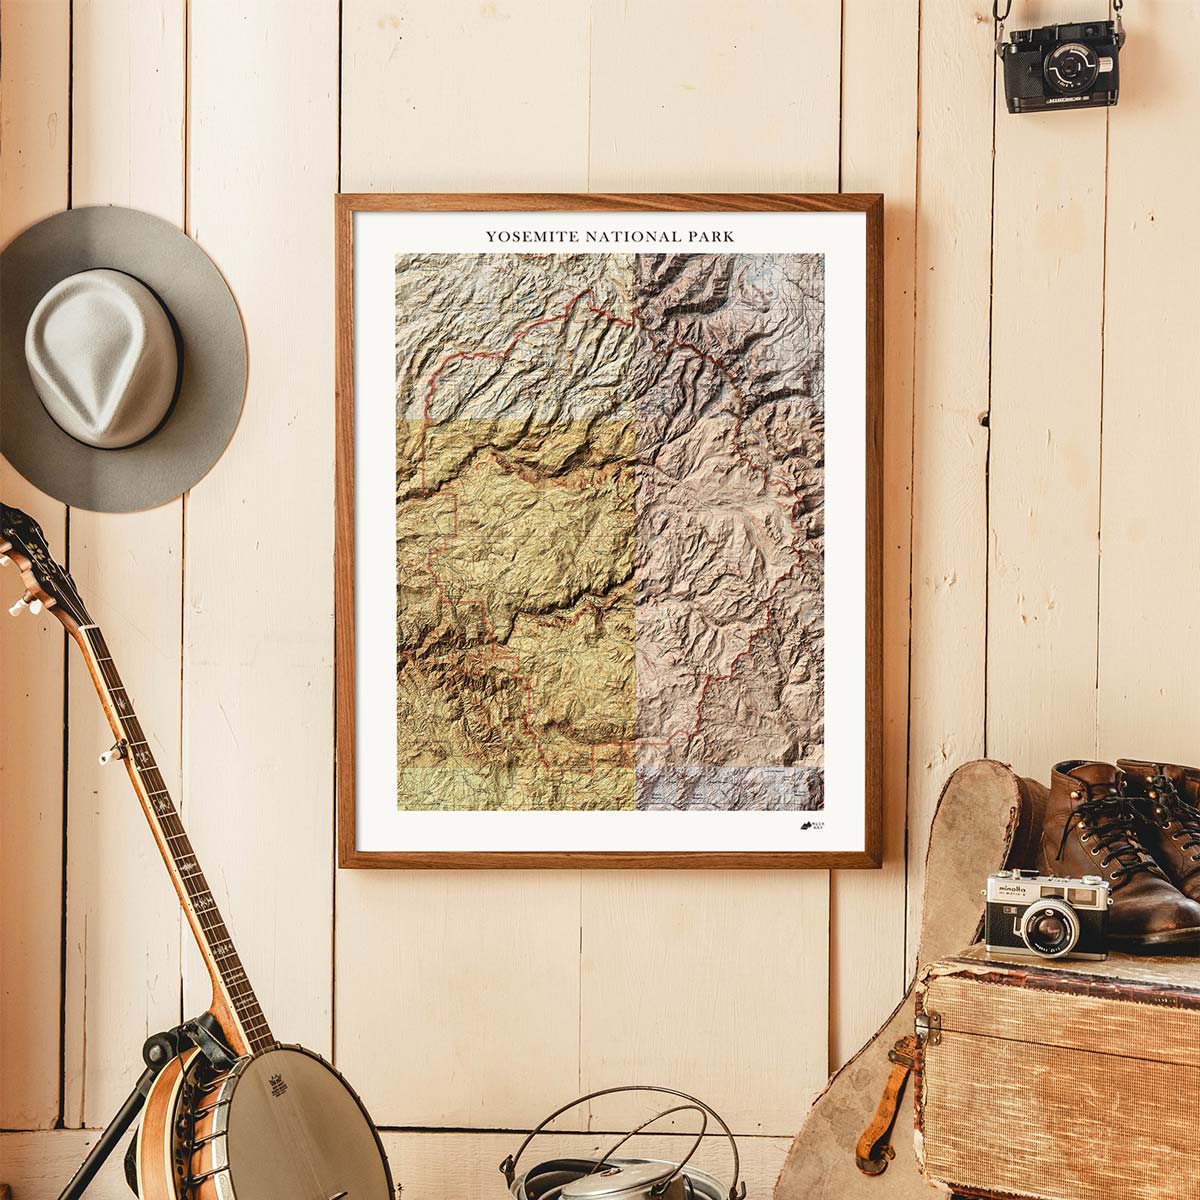
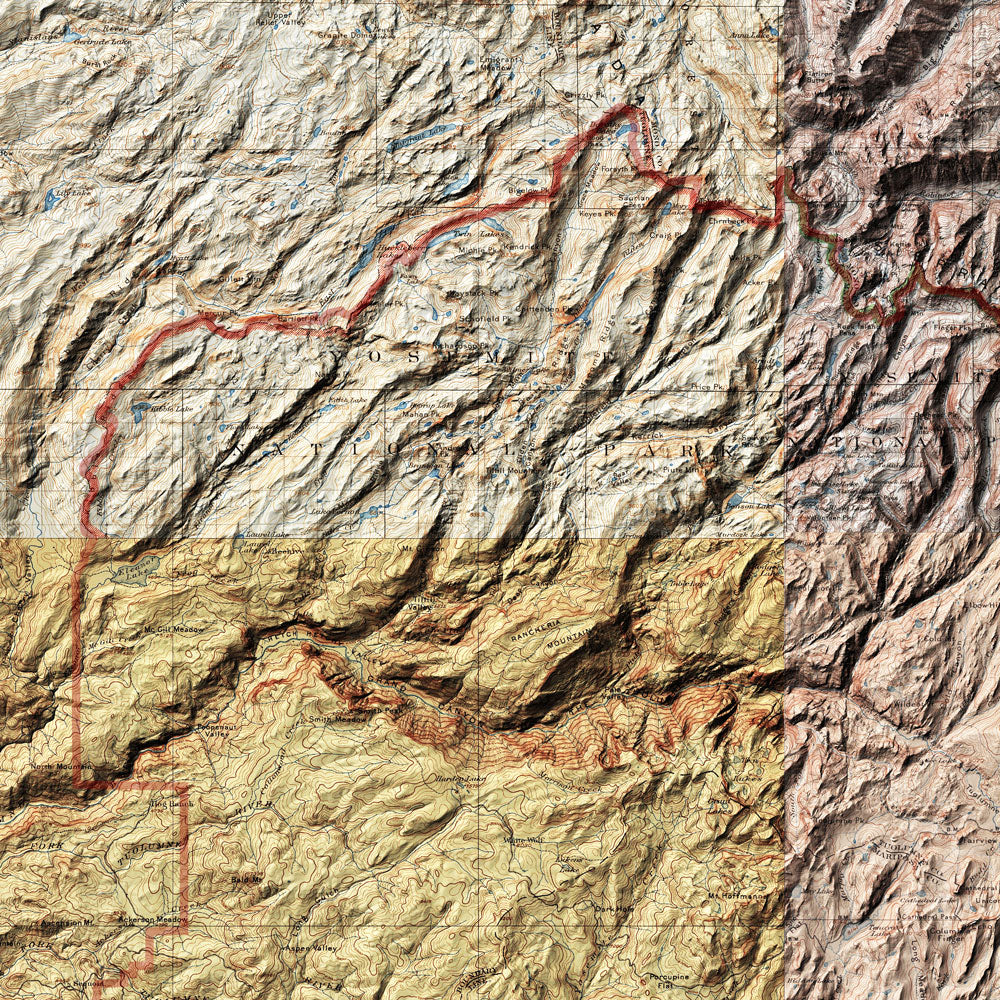
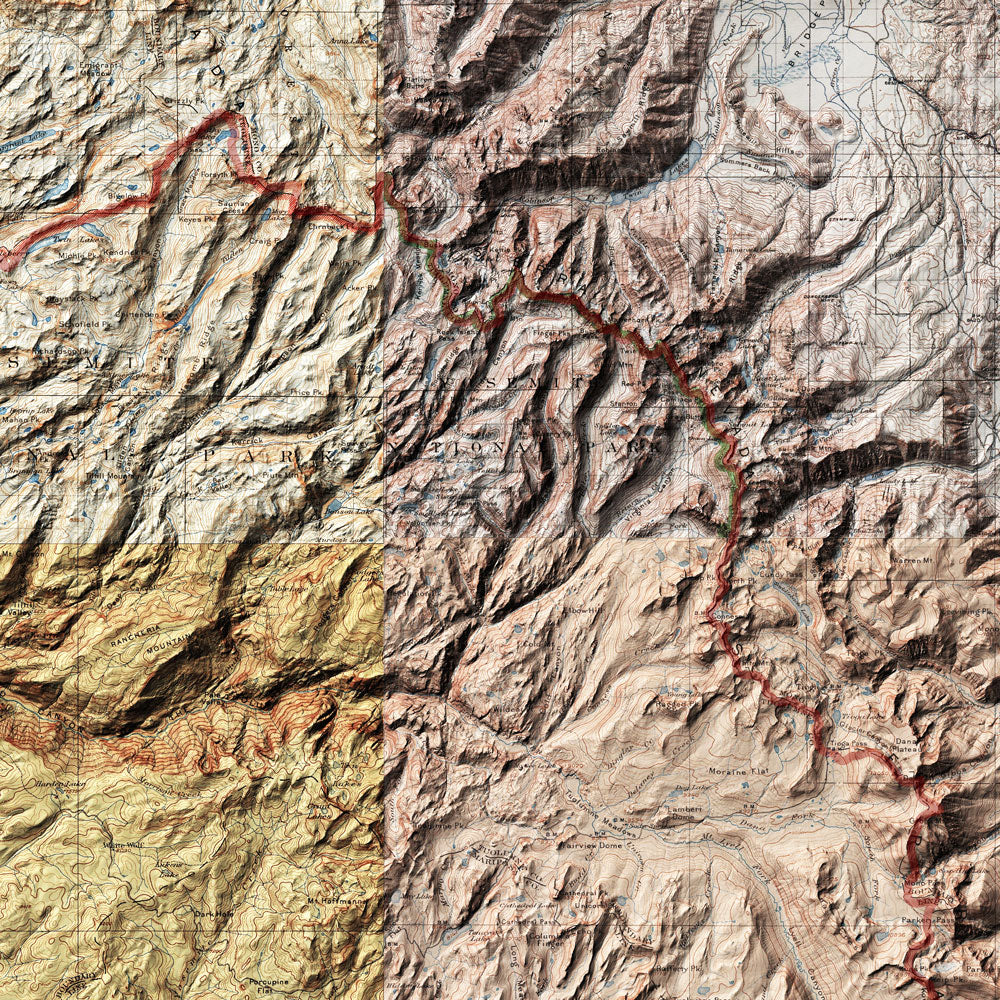
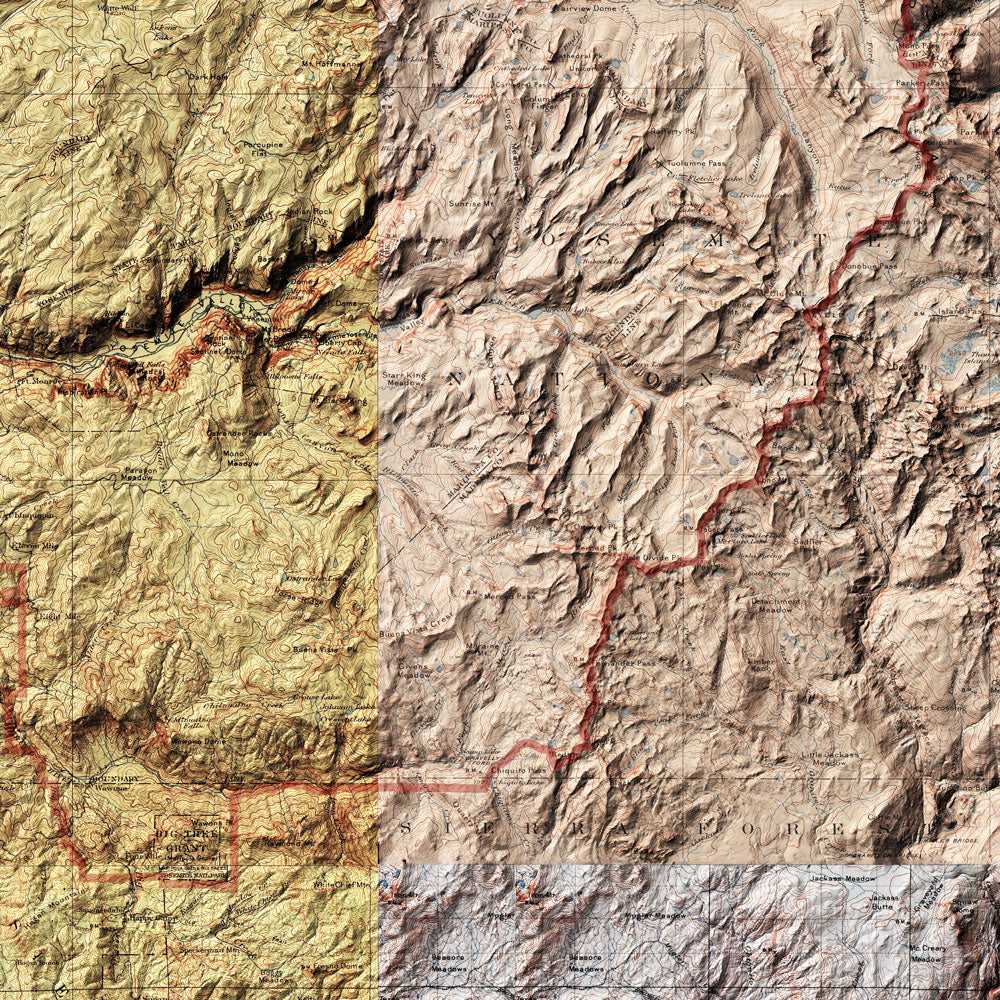
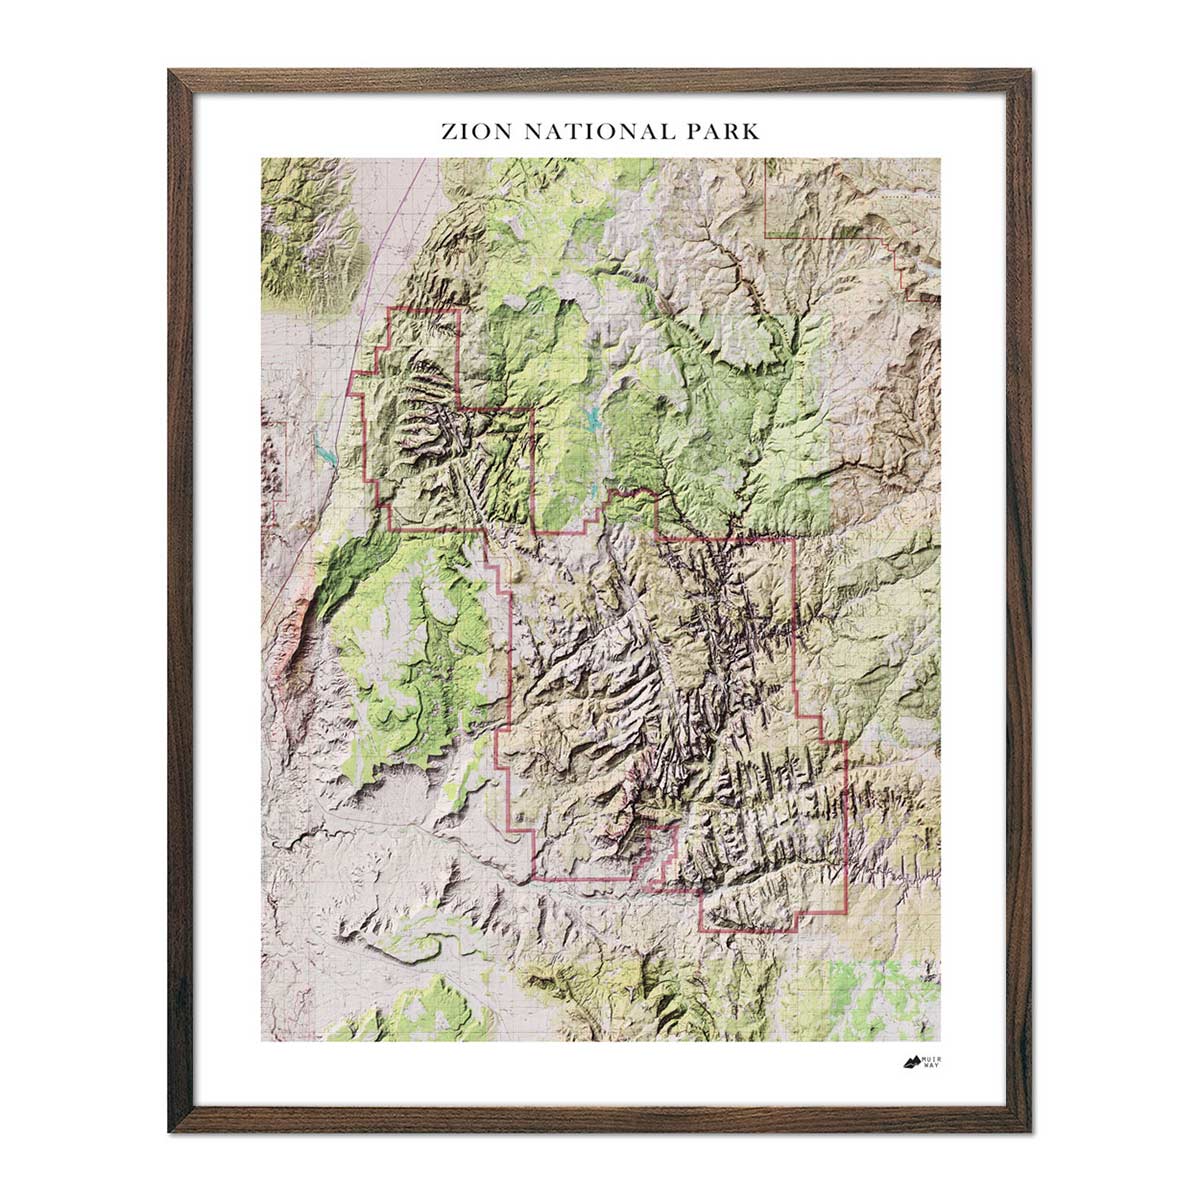
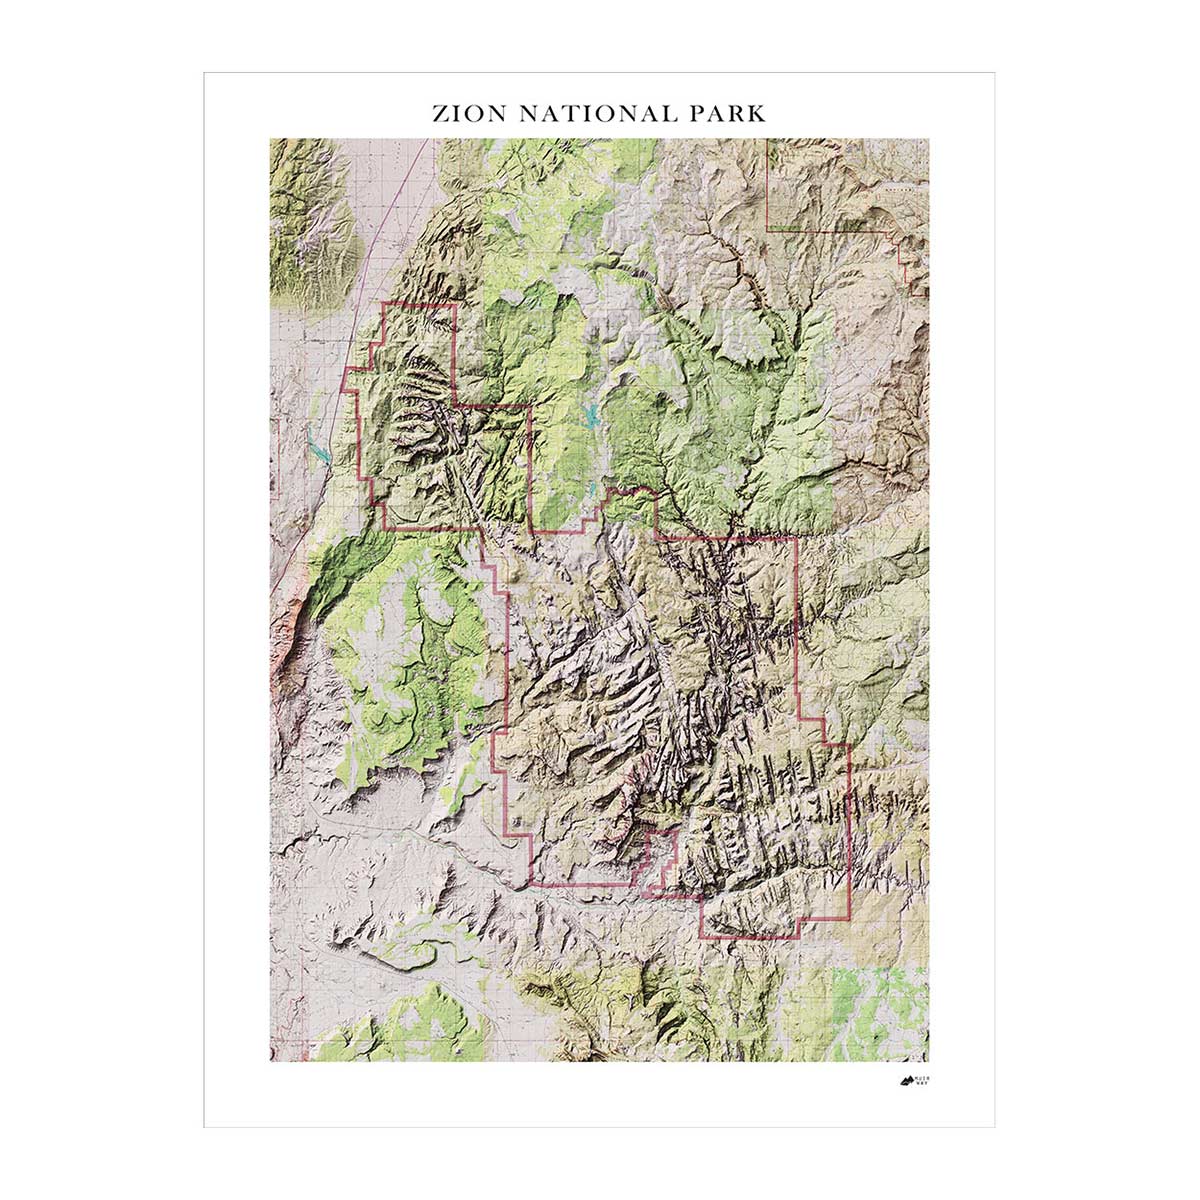
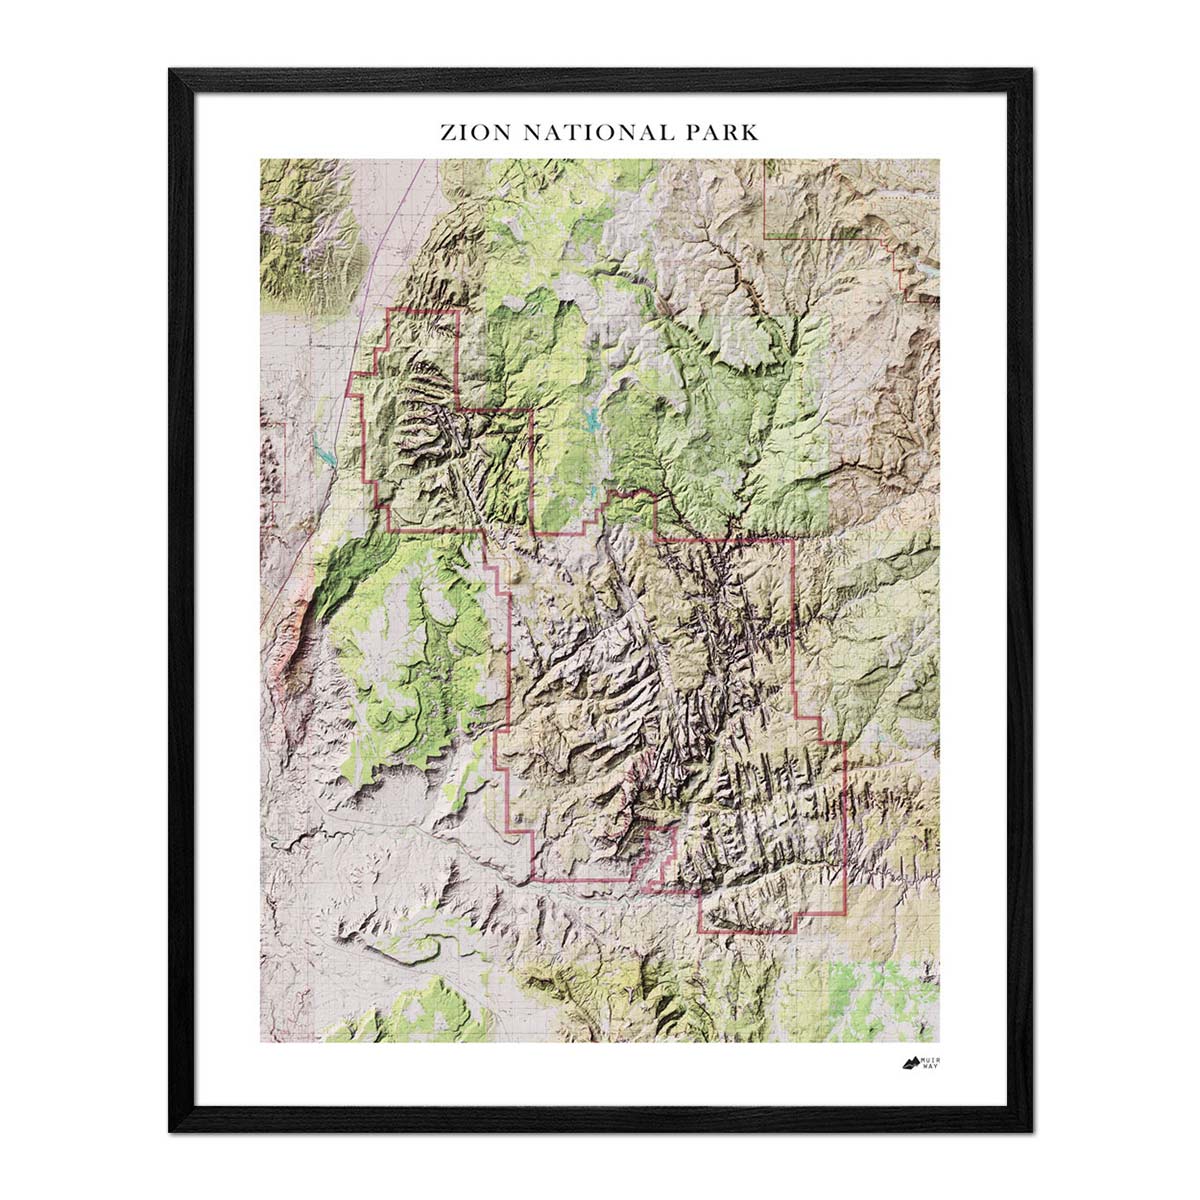
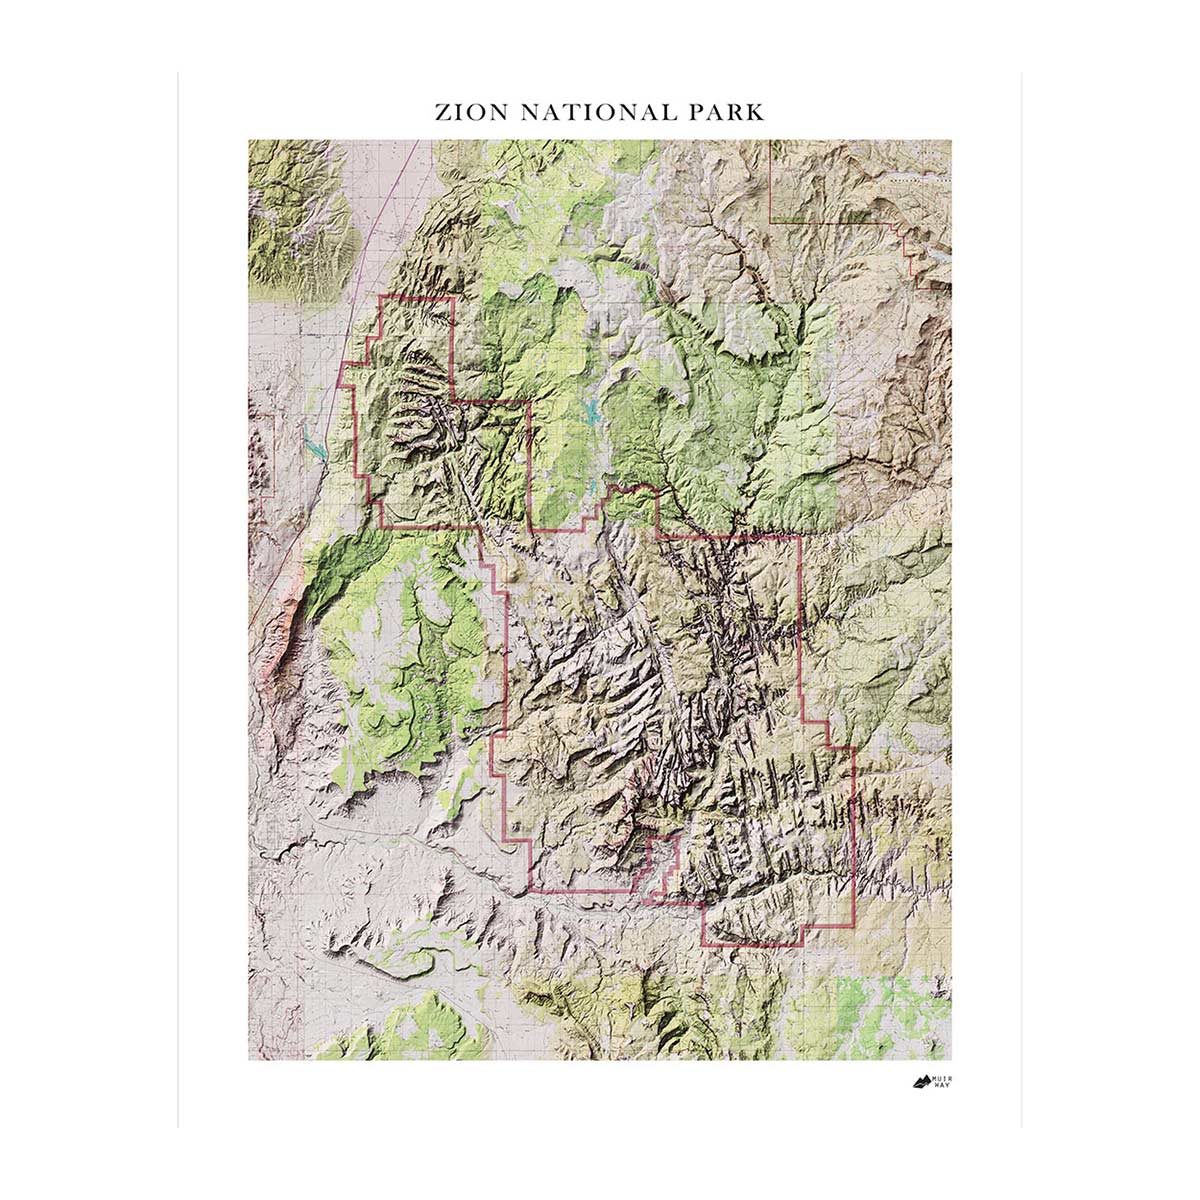
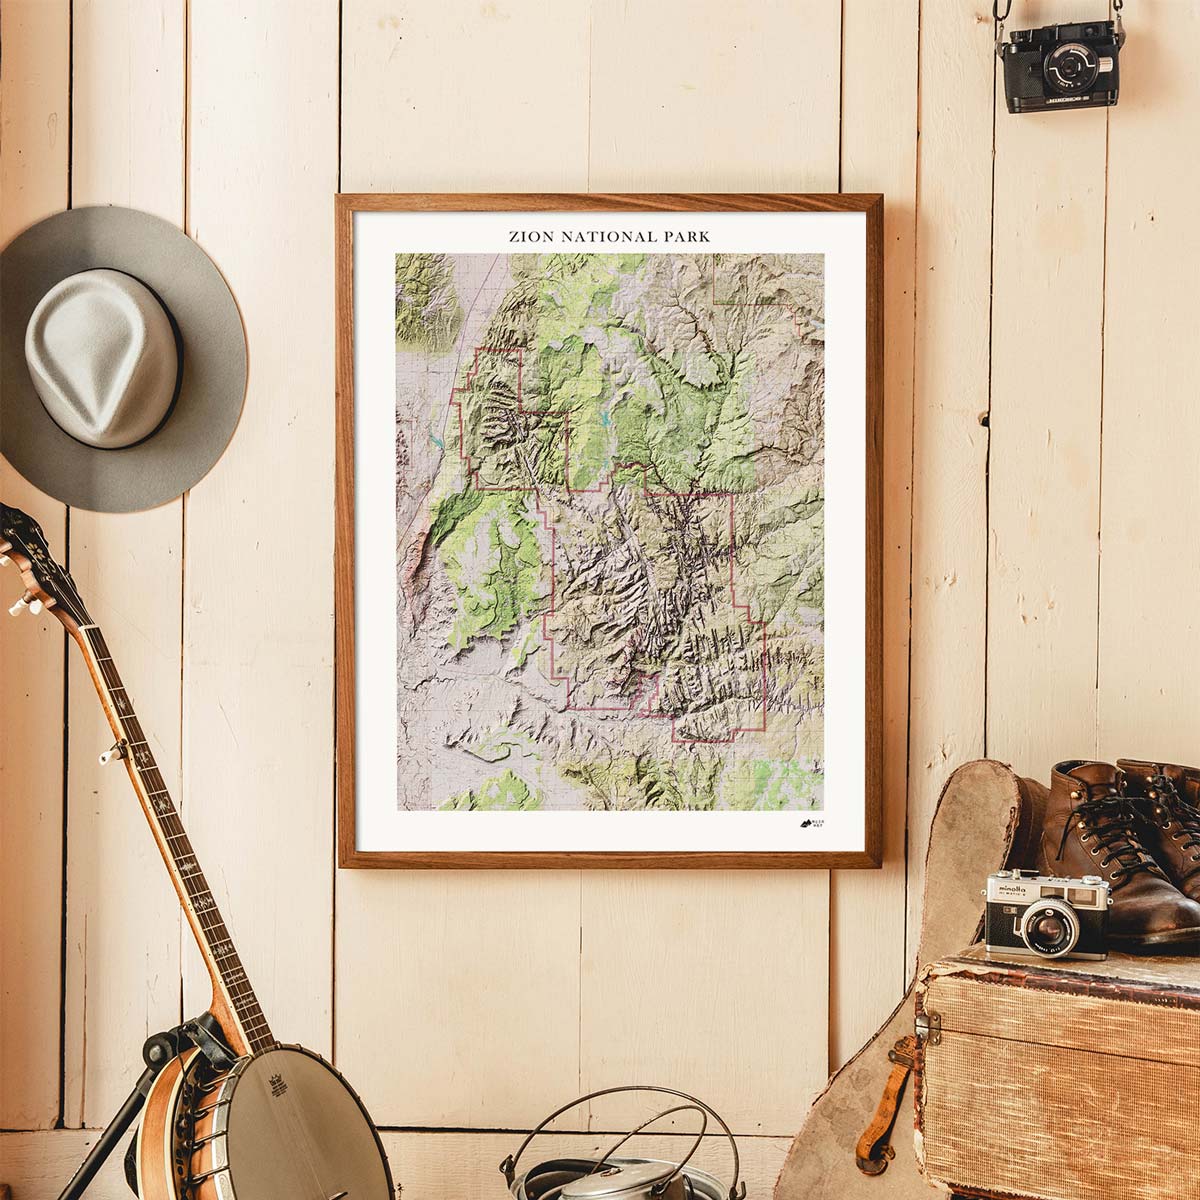
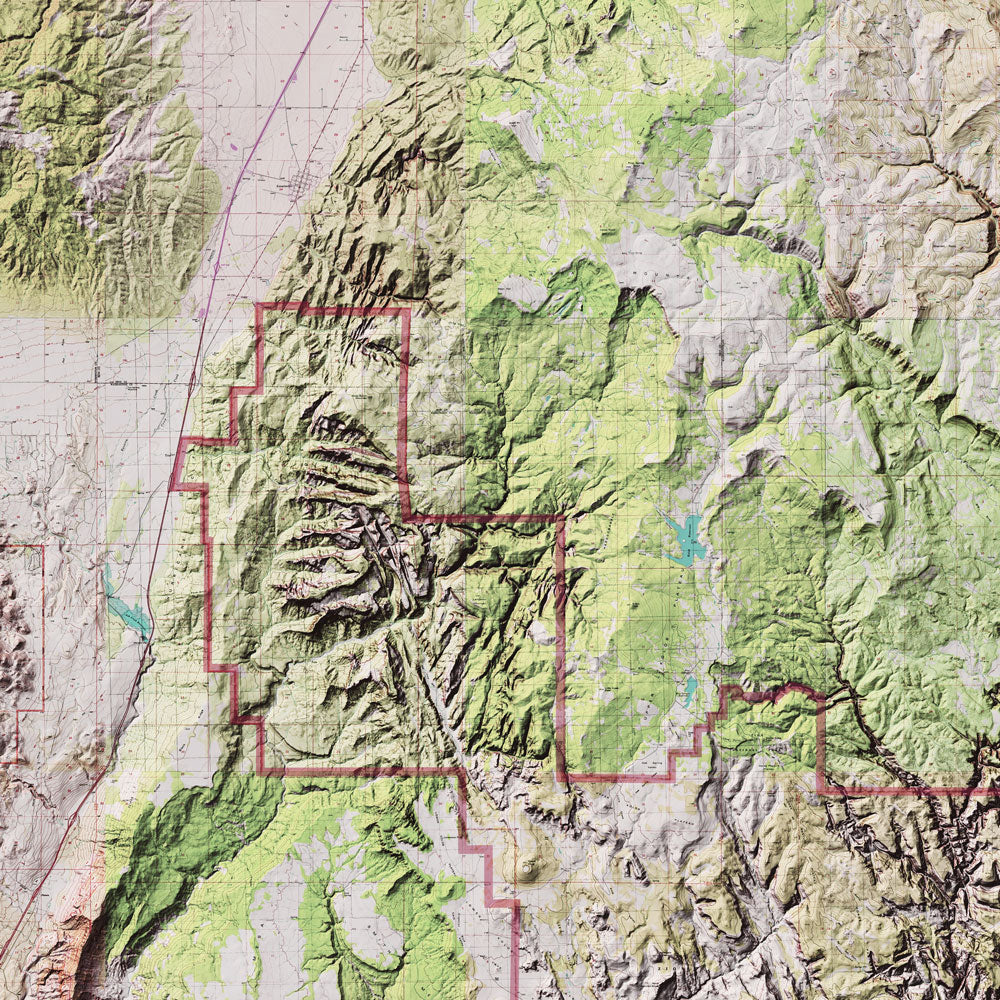
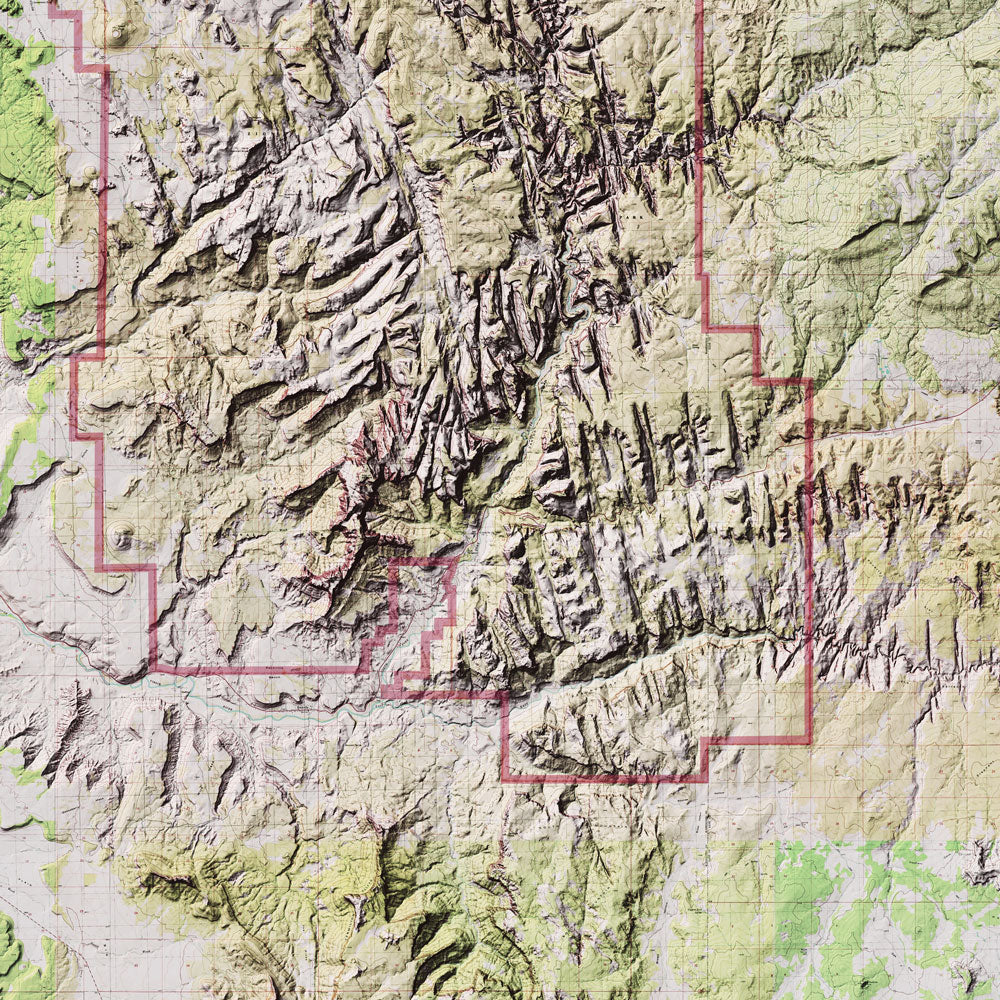
Our relief maps have an interesting mosaic aesthetic to them, as the US Geological Survey (USGS) topographic map sheets are digitally stitched together to fully represent our most beloved natural assets and national parks. Due to their topographic base maps, our relief series displays both natural and manmade features in vivid detail, scale dependent. Our range includes relief maps for sale of the USA and relief maps of Europe, from national parks to maps of a regional and continental scale.
What is a Relief Map Used for?
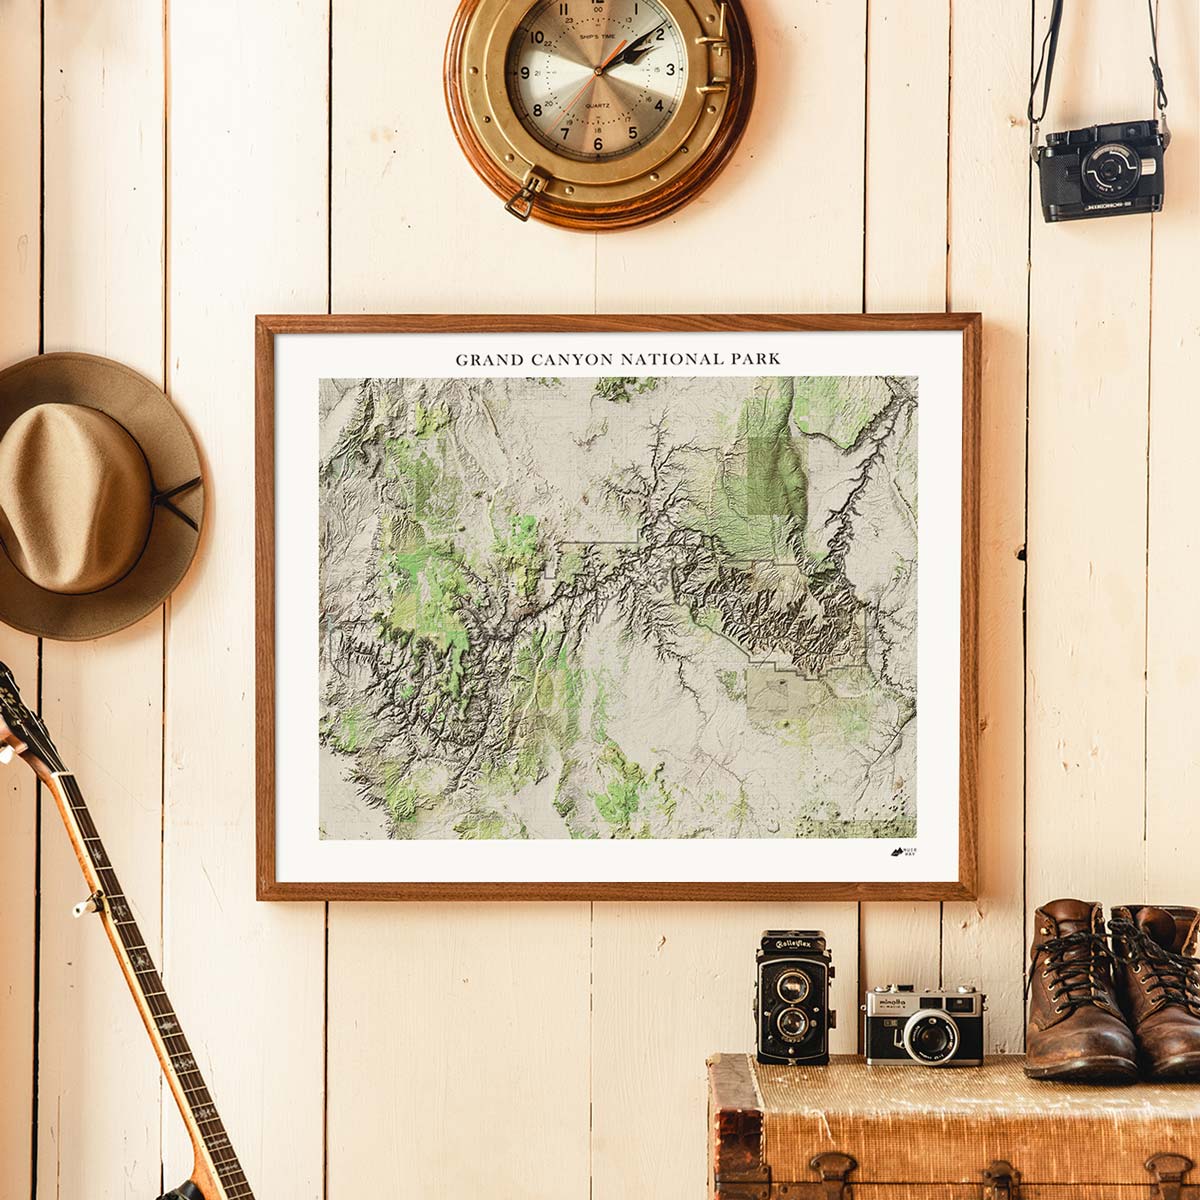
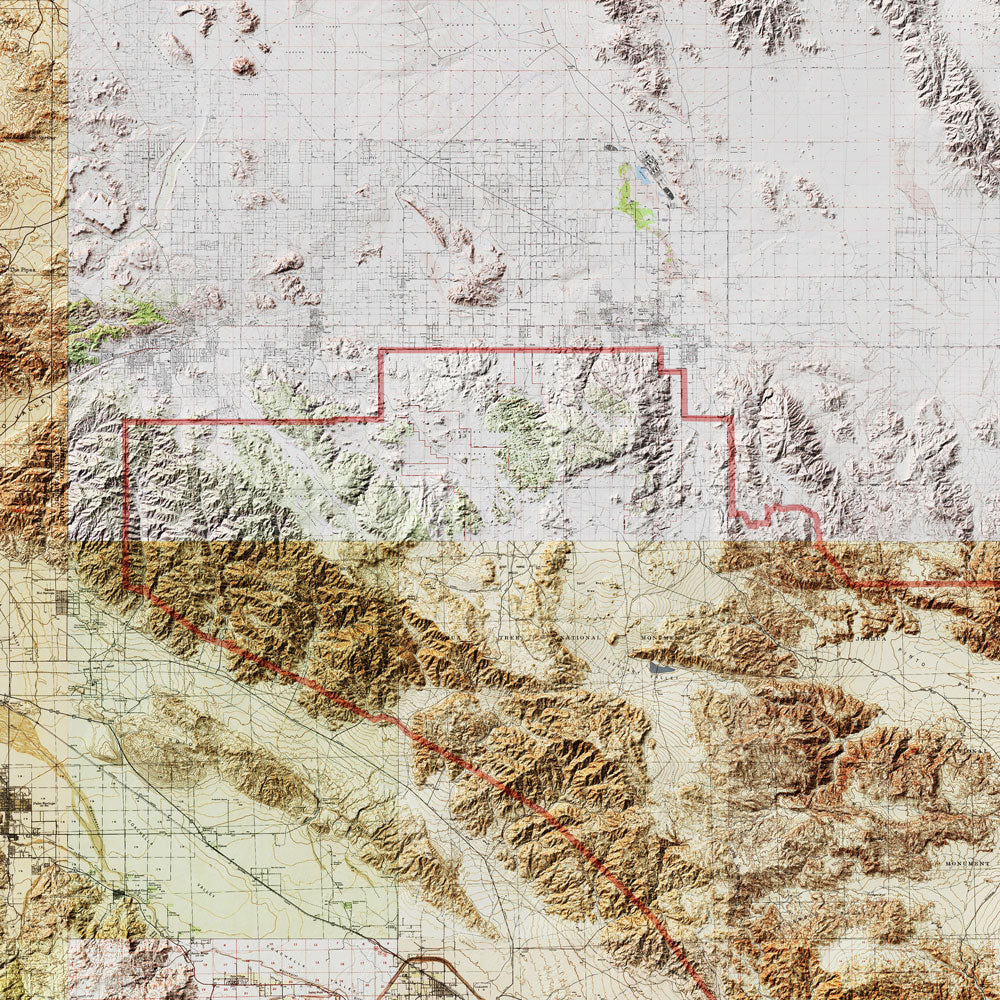
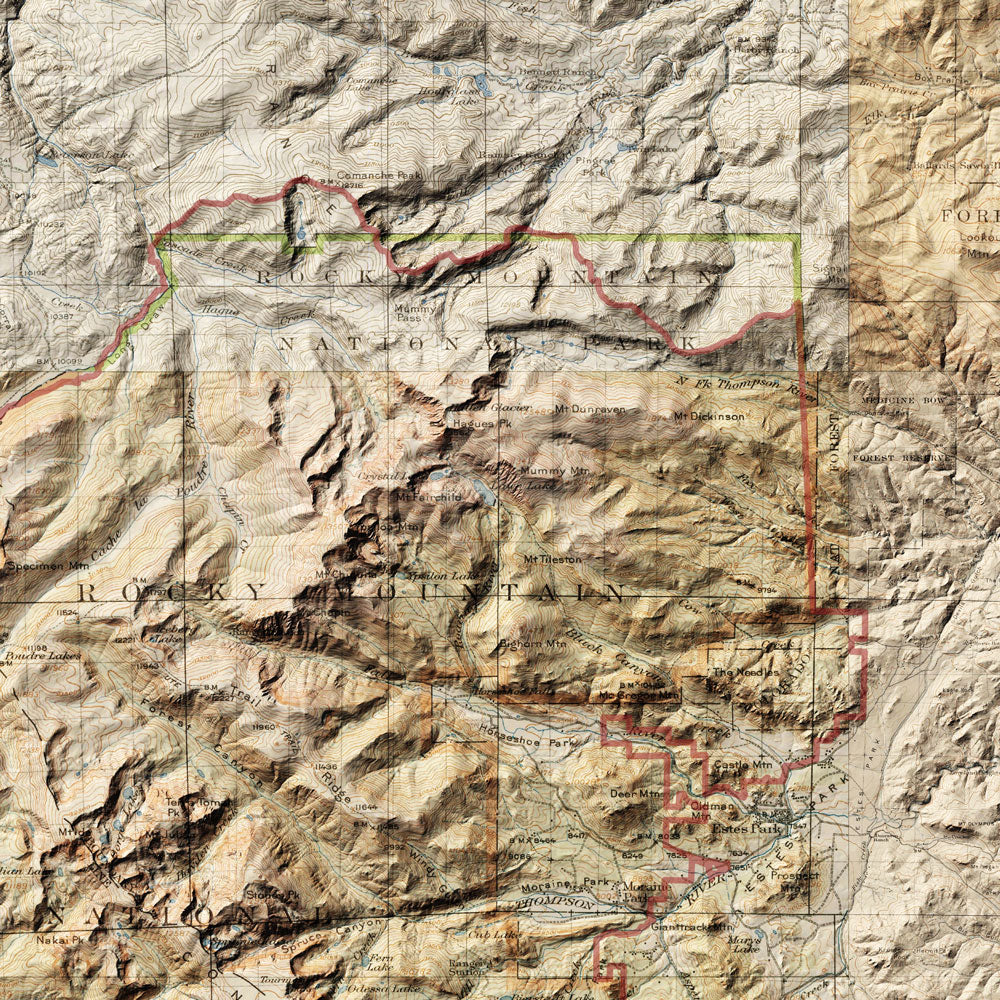
Relief maps are generally used to depict the physical lay of the land, displaying mountains, hills, plains, valleys, and other landforms. They often do not have contours on them, but use the contour and elevation data in the background to create the elevation shading or hillshading to display relief. Whether contours are included (in USGS maps) or omitted is dependent on map scale. Relief maps of the US and Europe are great for display purposes, but are essential to hikers, outdoor enthusiasts, and wilderness guides. For field applications, we advise getting the newest USGS maps or using updated GPS maps.
What is a Relief Map in Geography?
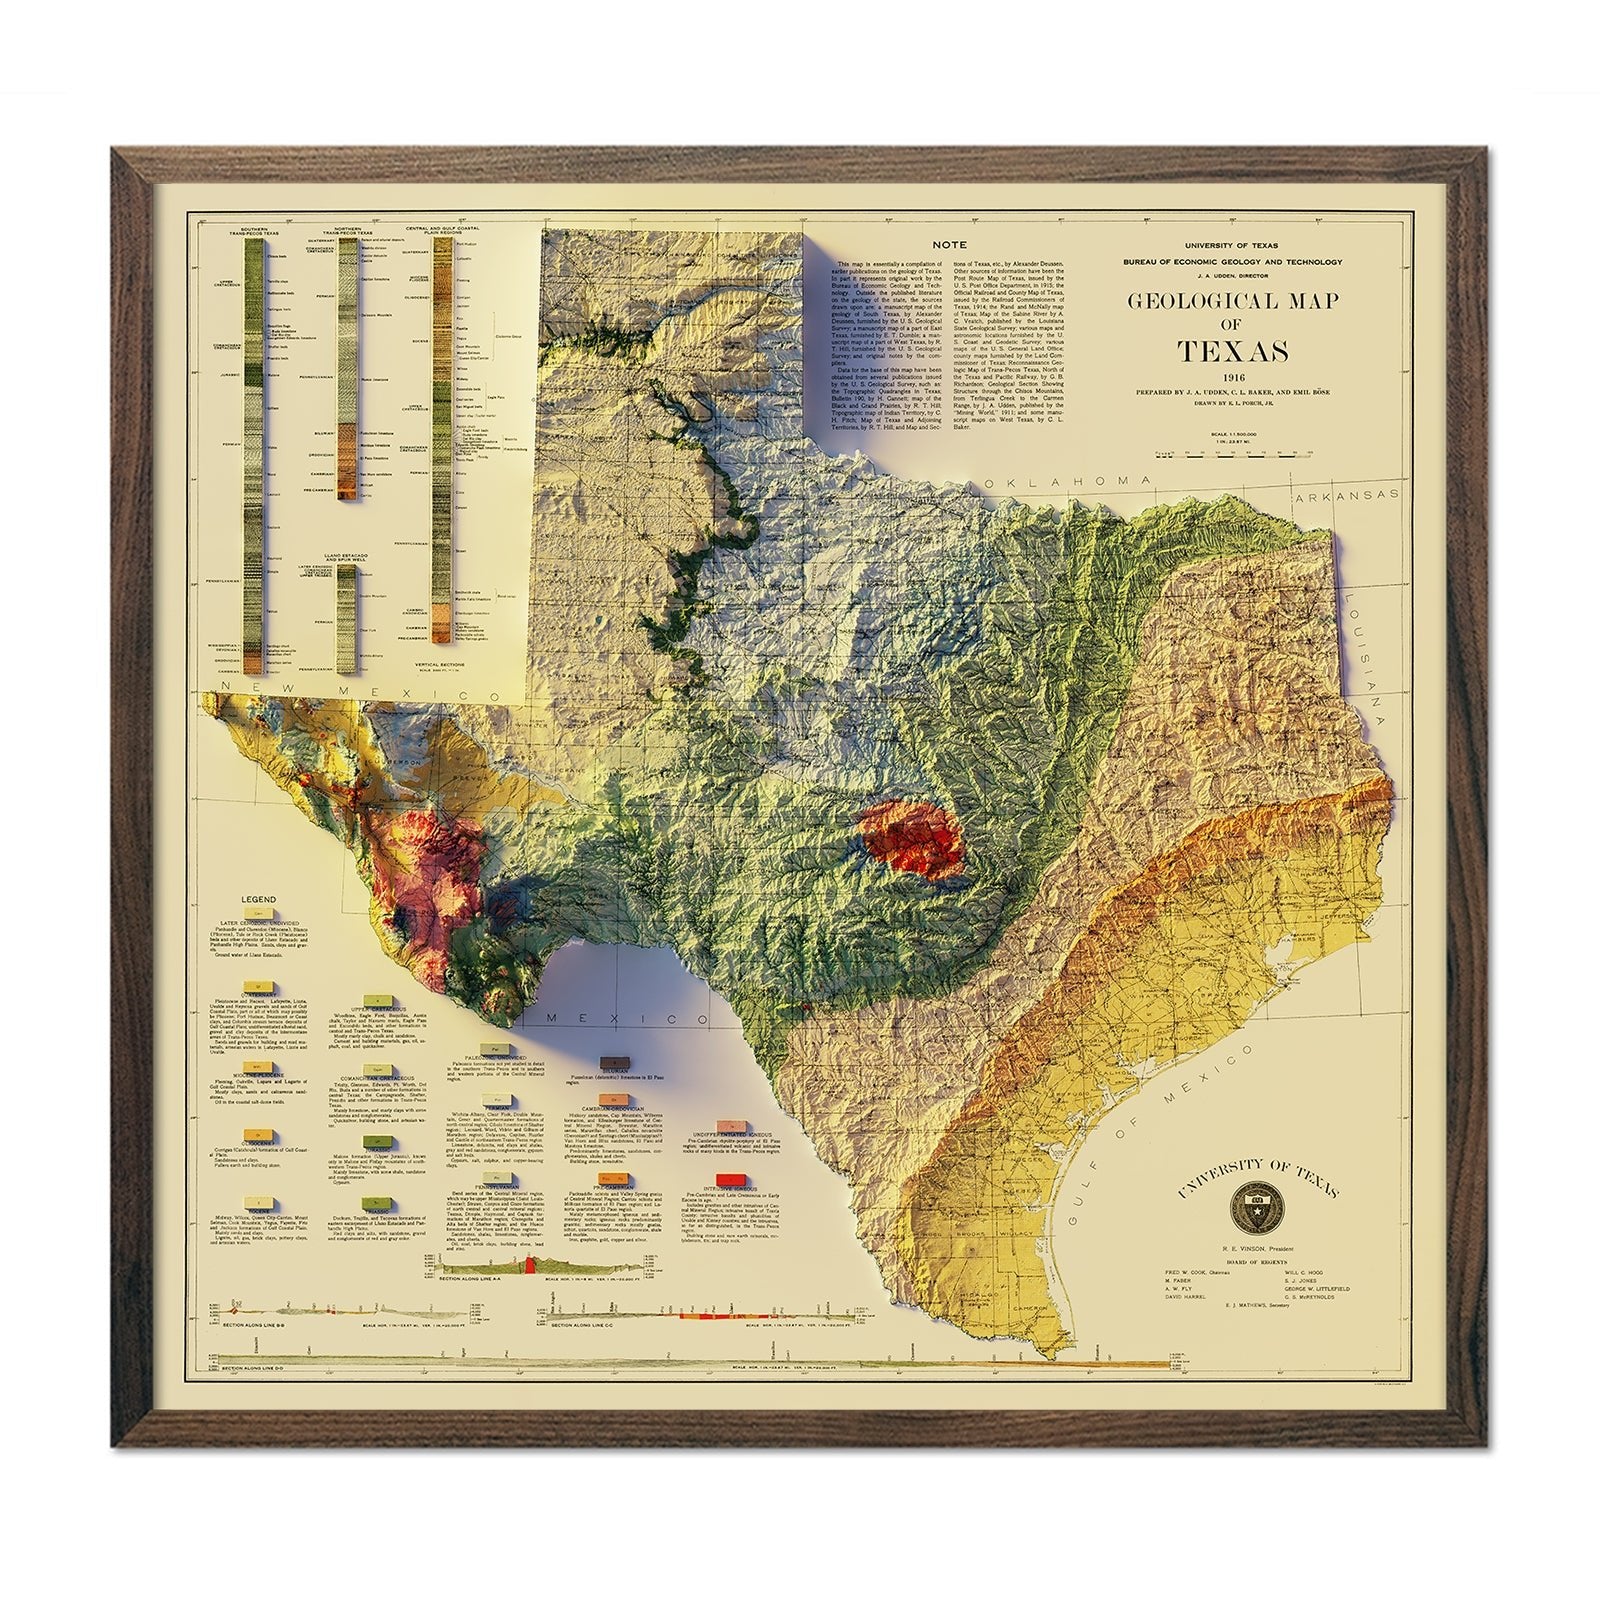
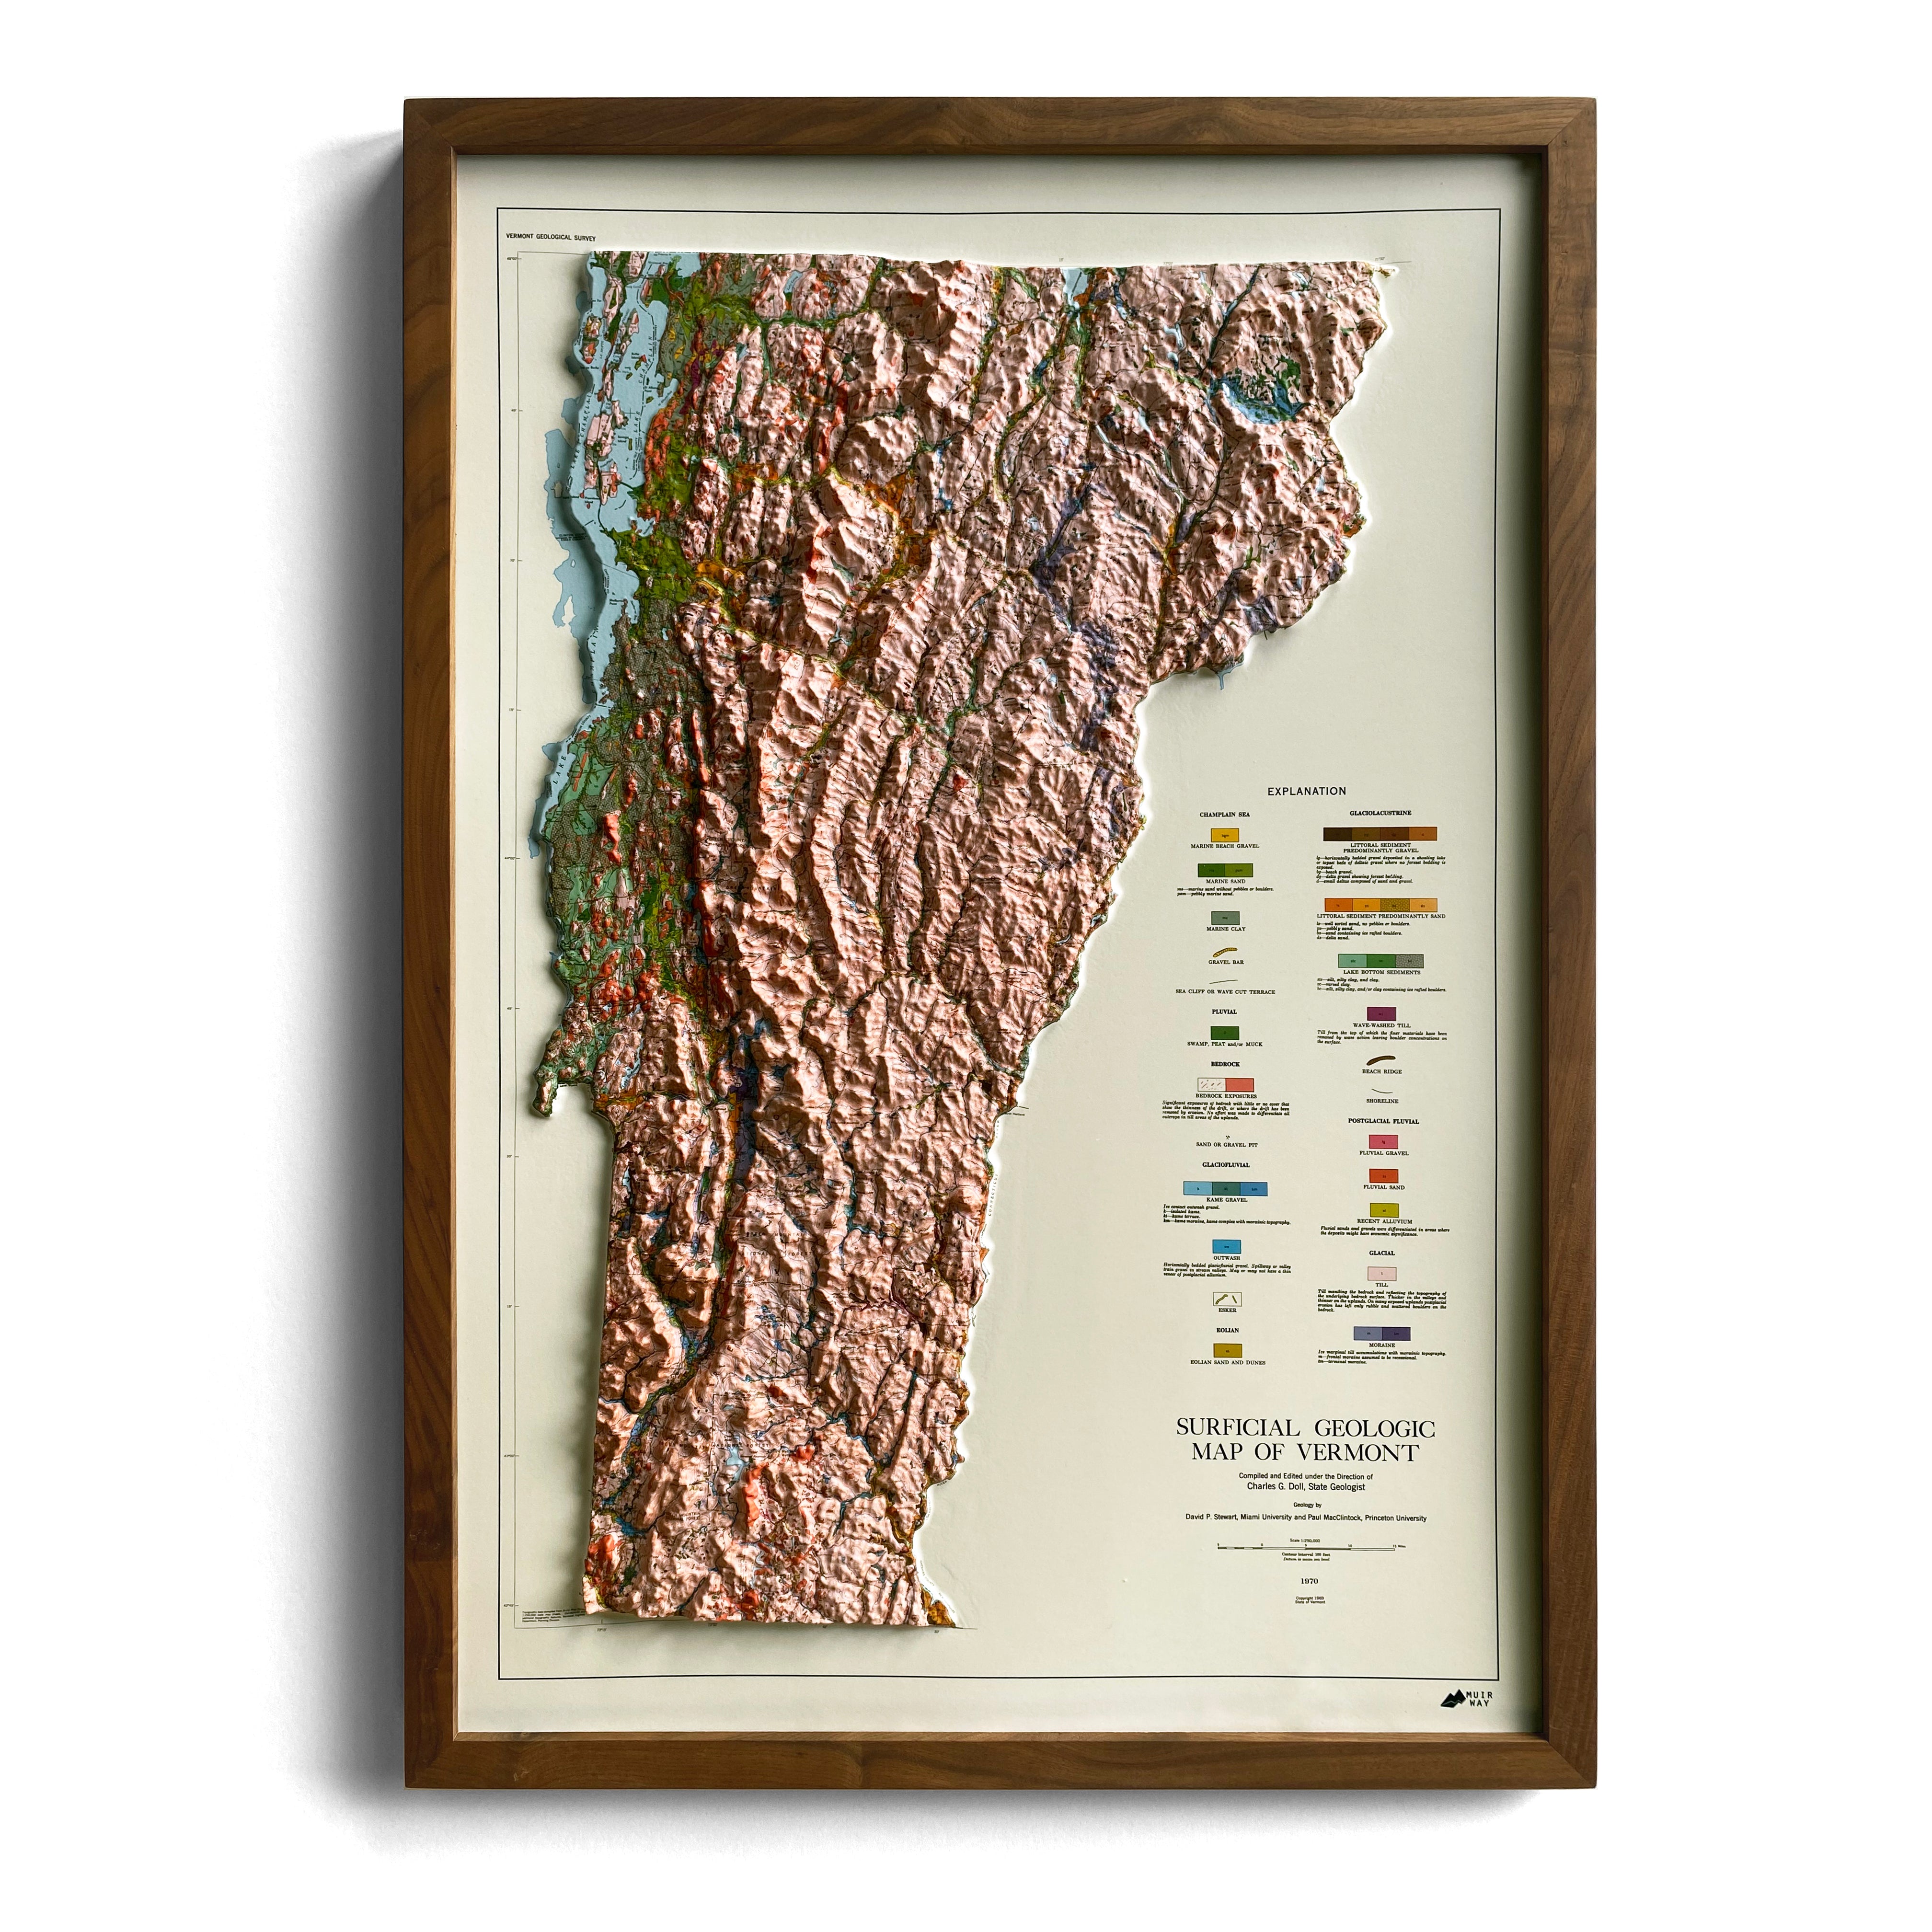
A relief map is the cartographic representation of physical relief in paper or digital form, often using hillshading with color-coded relief and/or contours to accurately depict varying heights and representing landforms.
What are Examples of Best Selling Relief Maps?
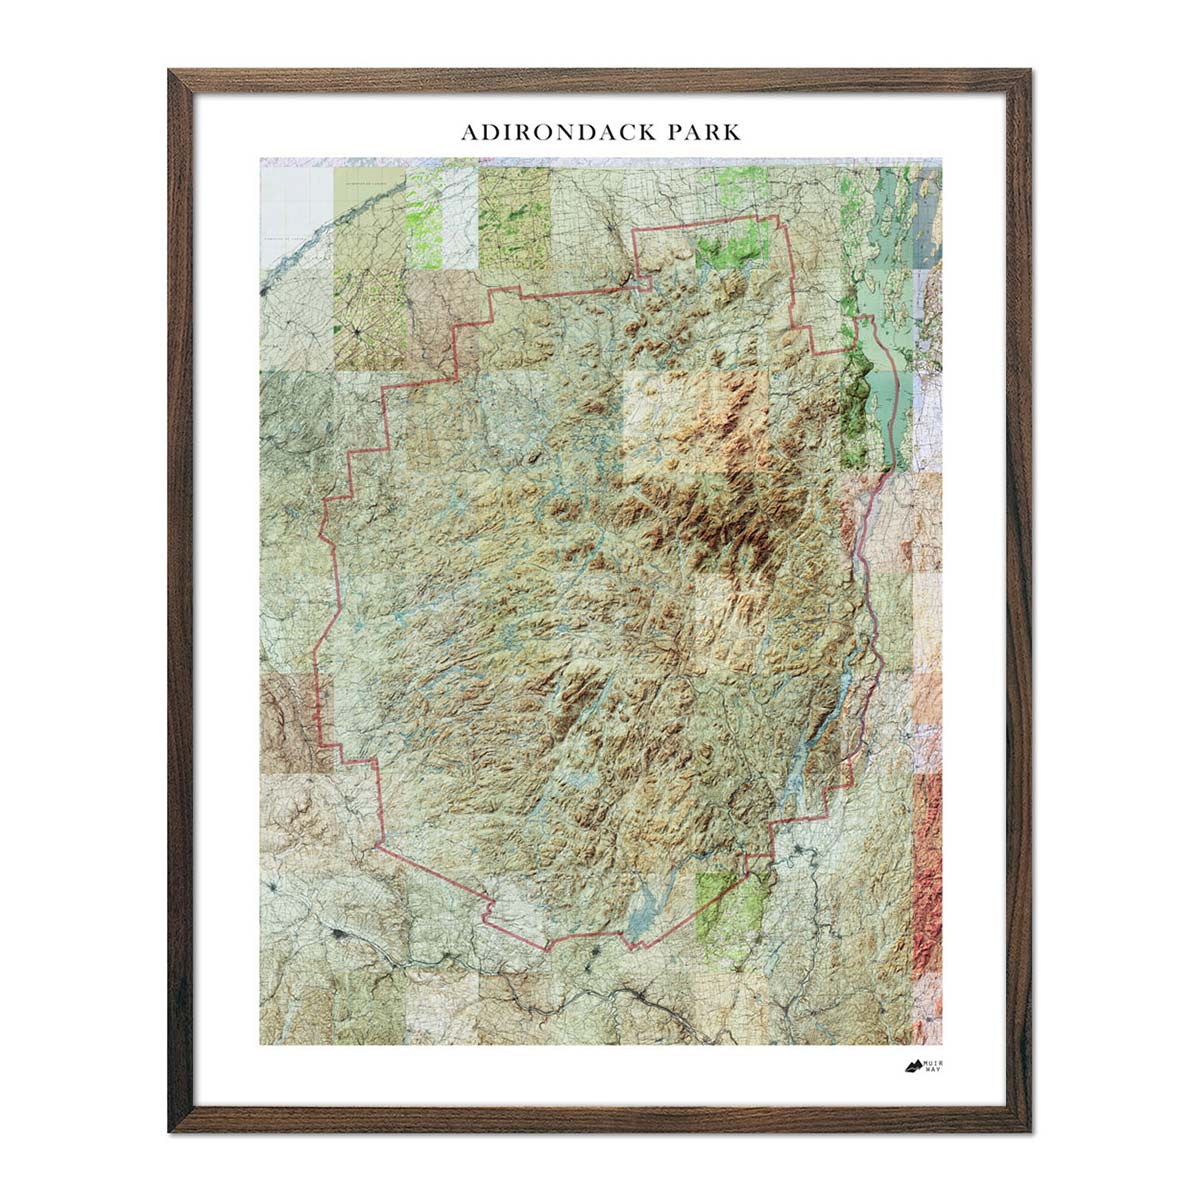
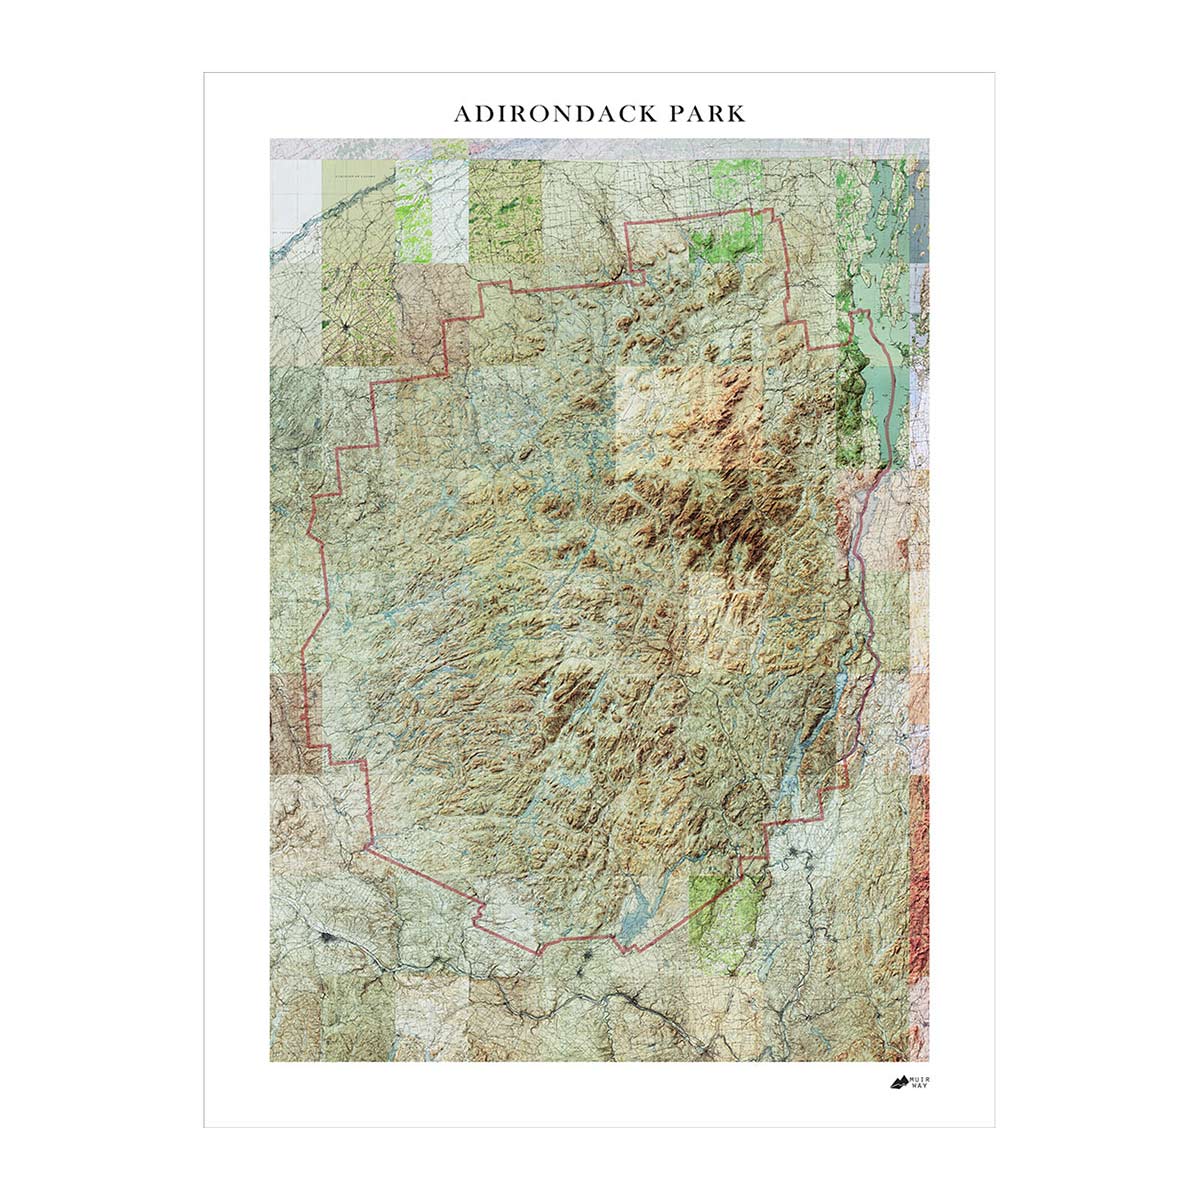
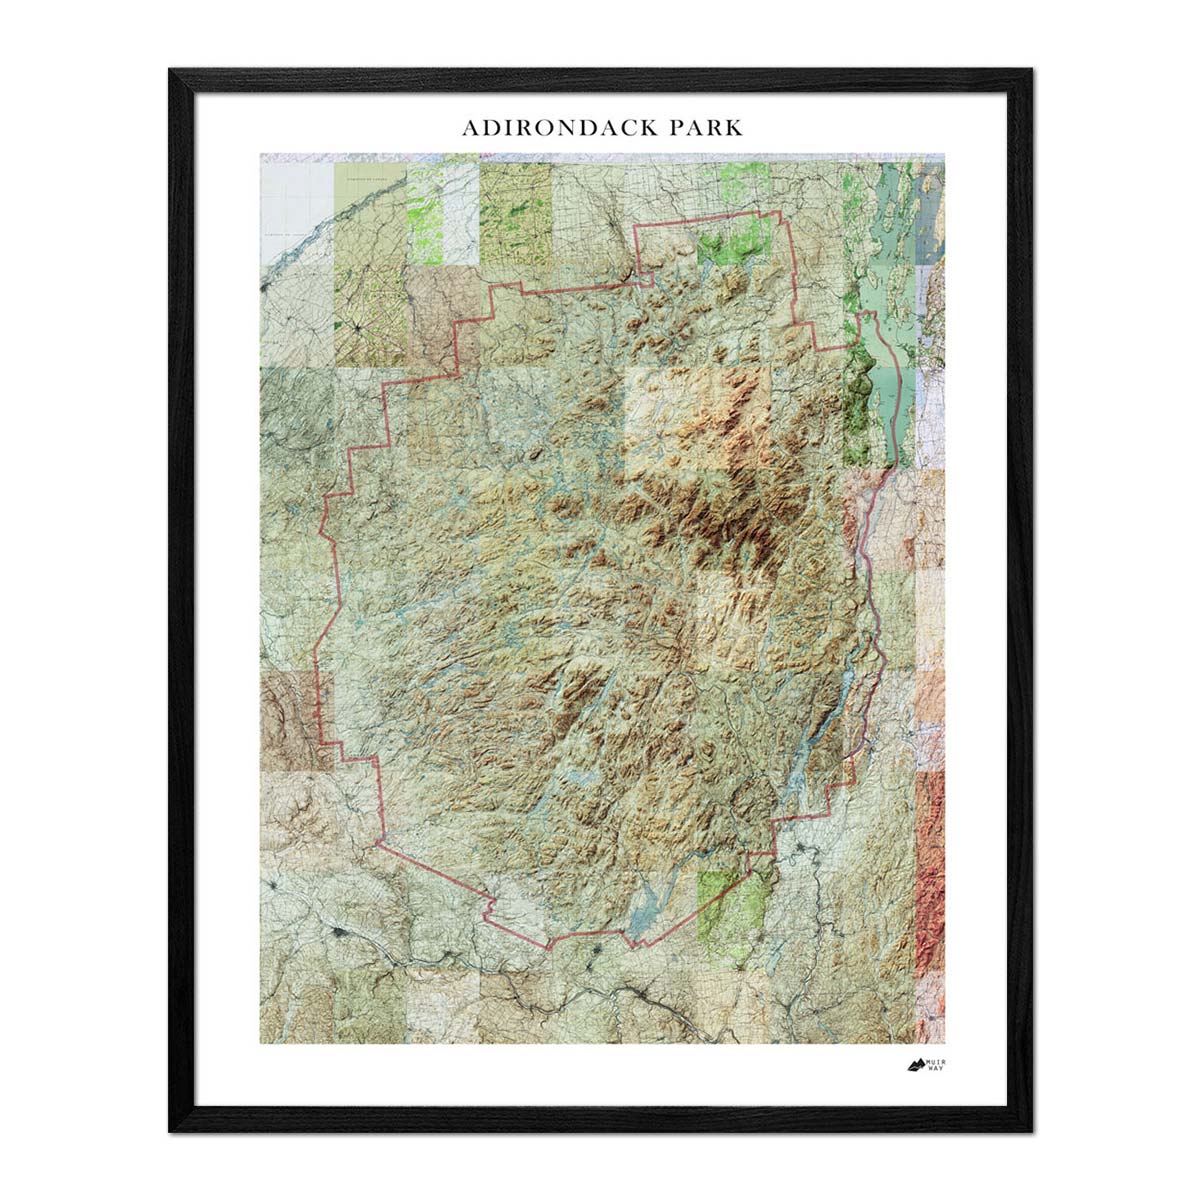
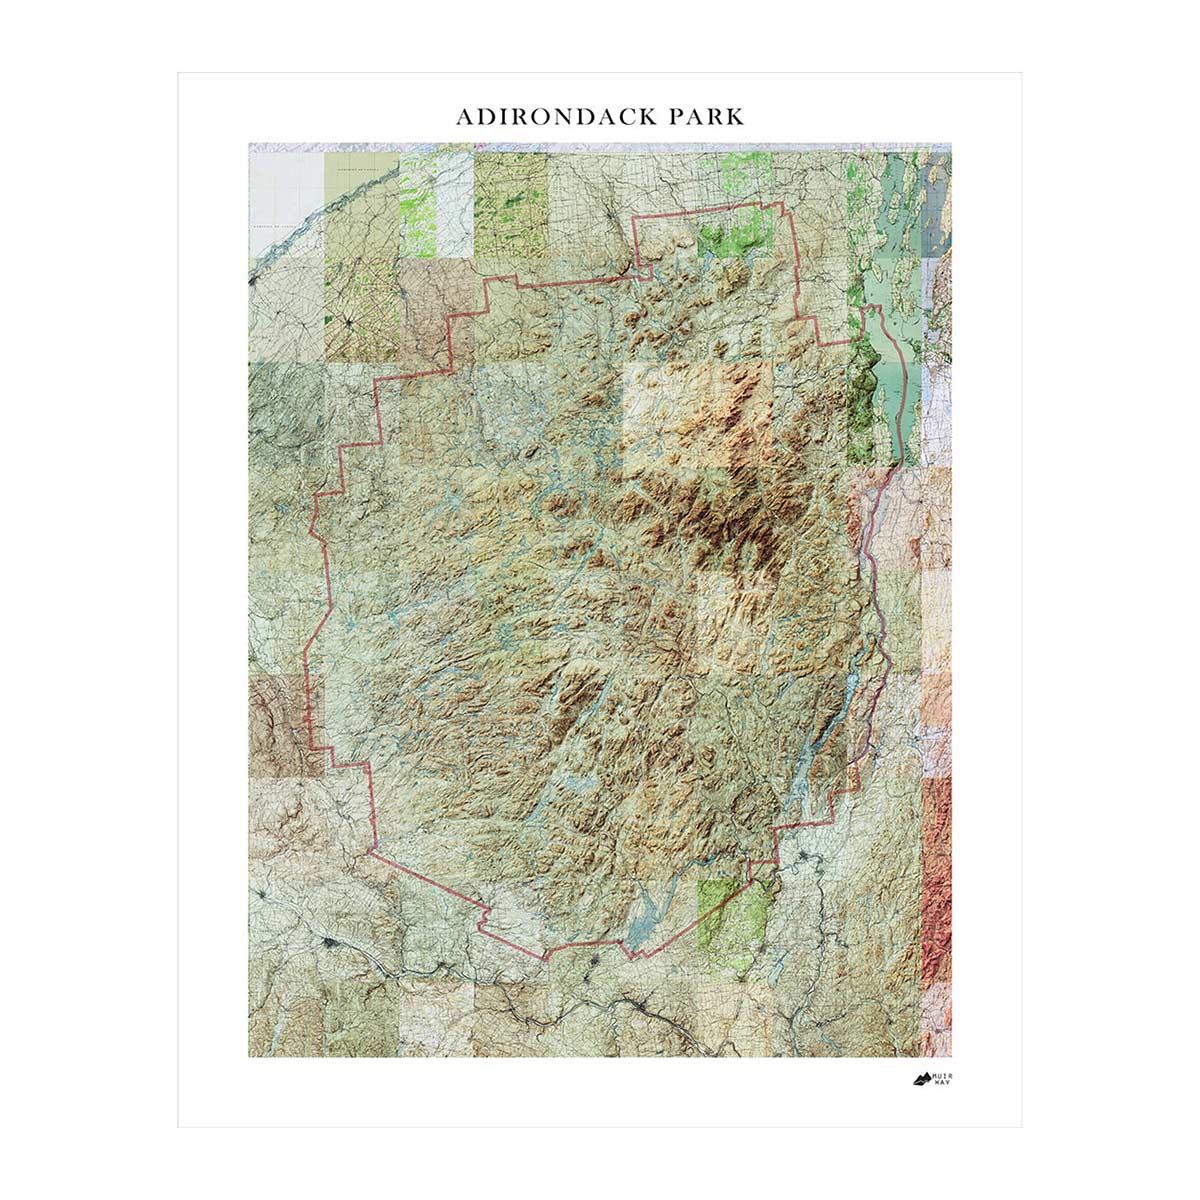
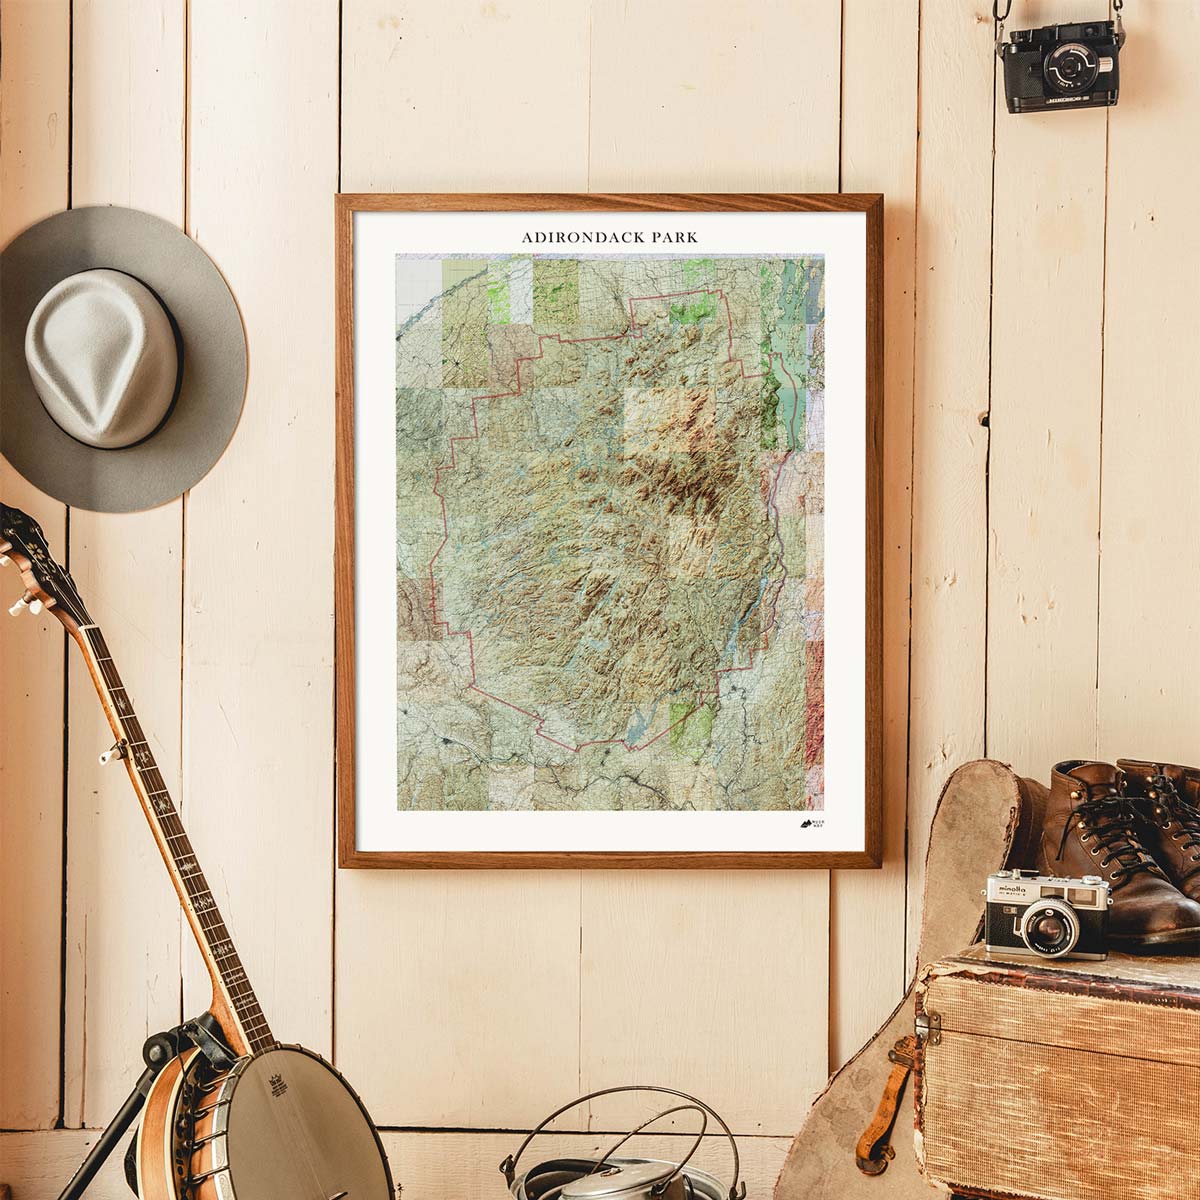
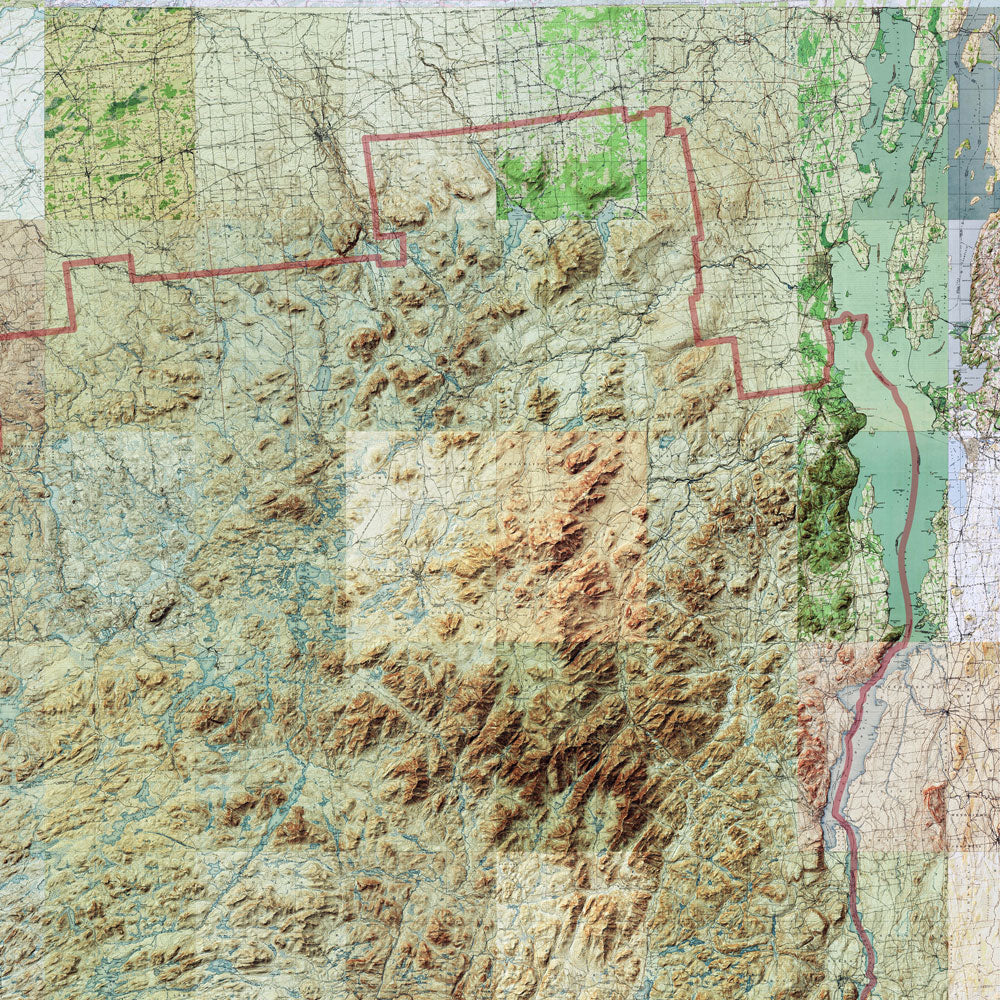
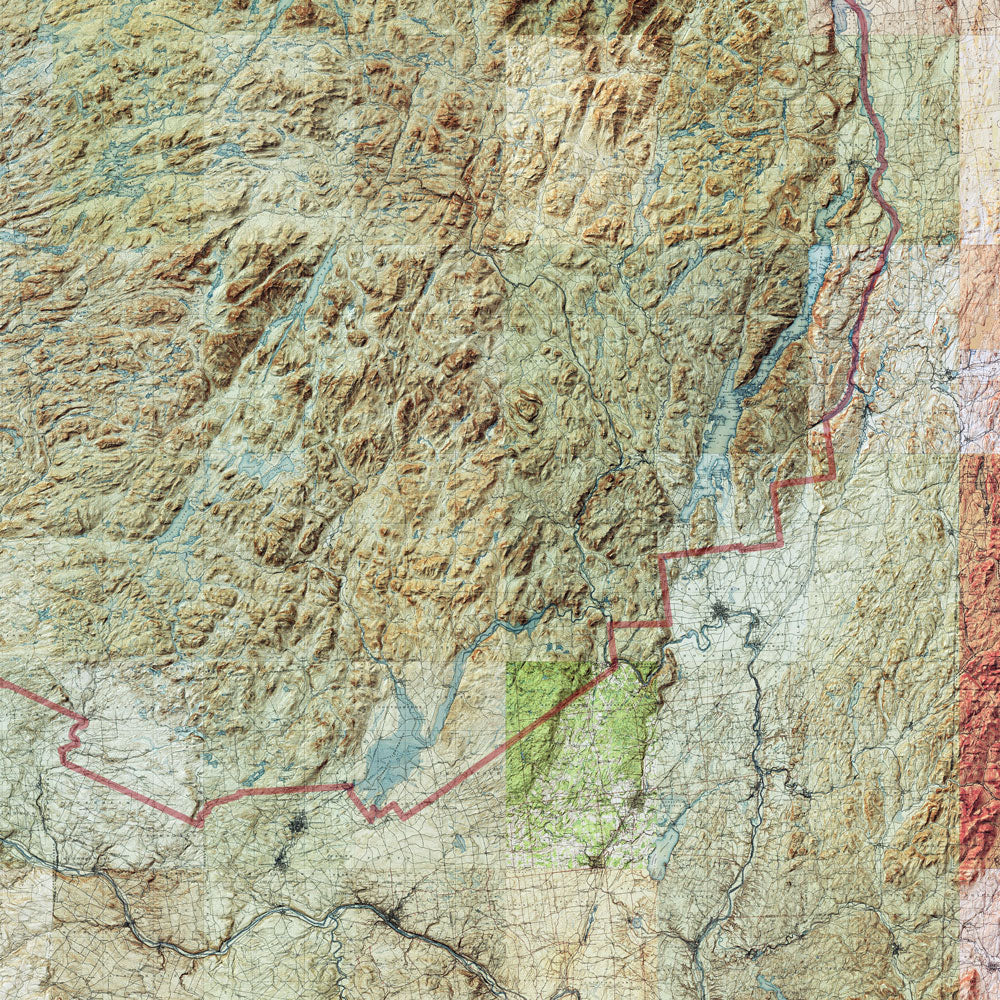
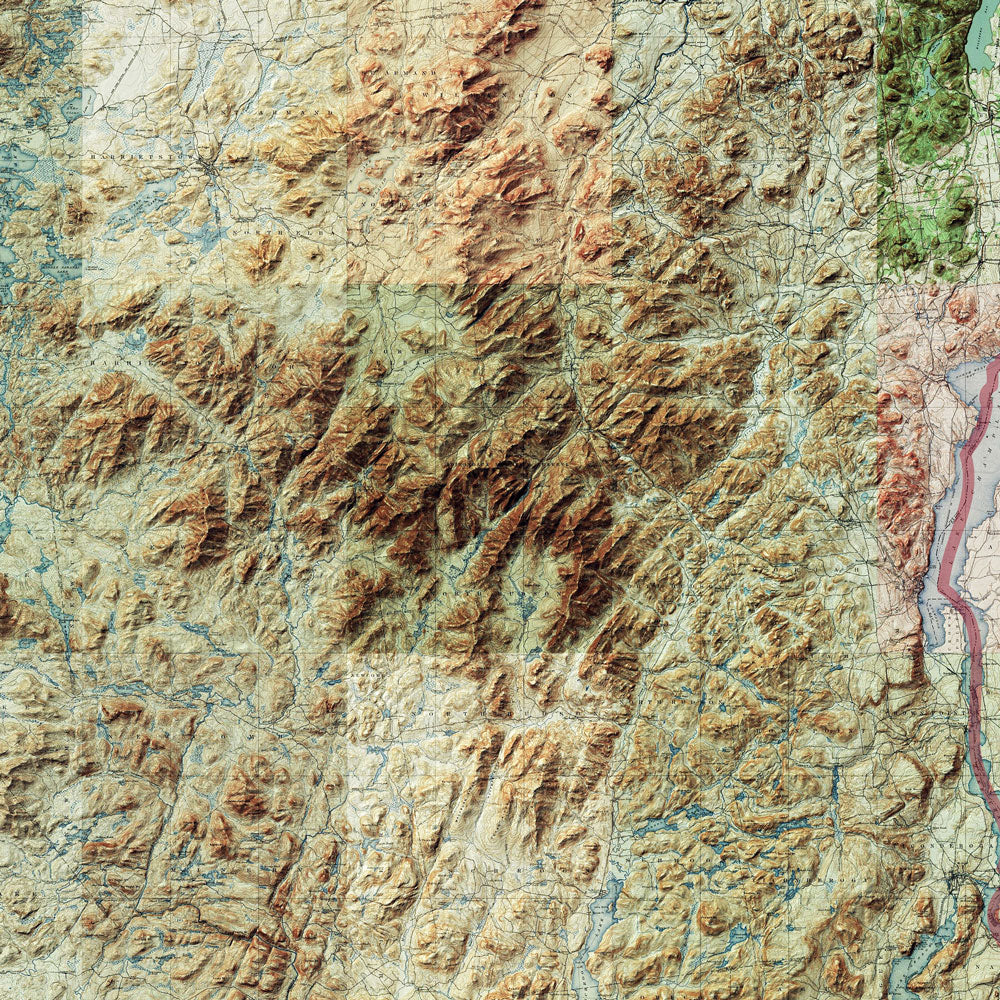
- The Adirondack Park Relief Map
The Adirondack Park Relief Map is a mosaic of US Geological Survey (USGS) topographic map sheets that are digitally stitched together and overlaid with accurate hillshading to artfully represent relief and landforms. Located in upstate New York, the Adirondack Mountains are a unique, dome-shaped range associated with the ancient rock of the Canadian Shield. The park contains Mt. Marcy, NY state’s highest point. -
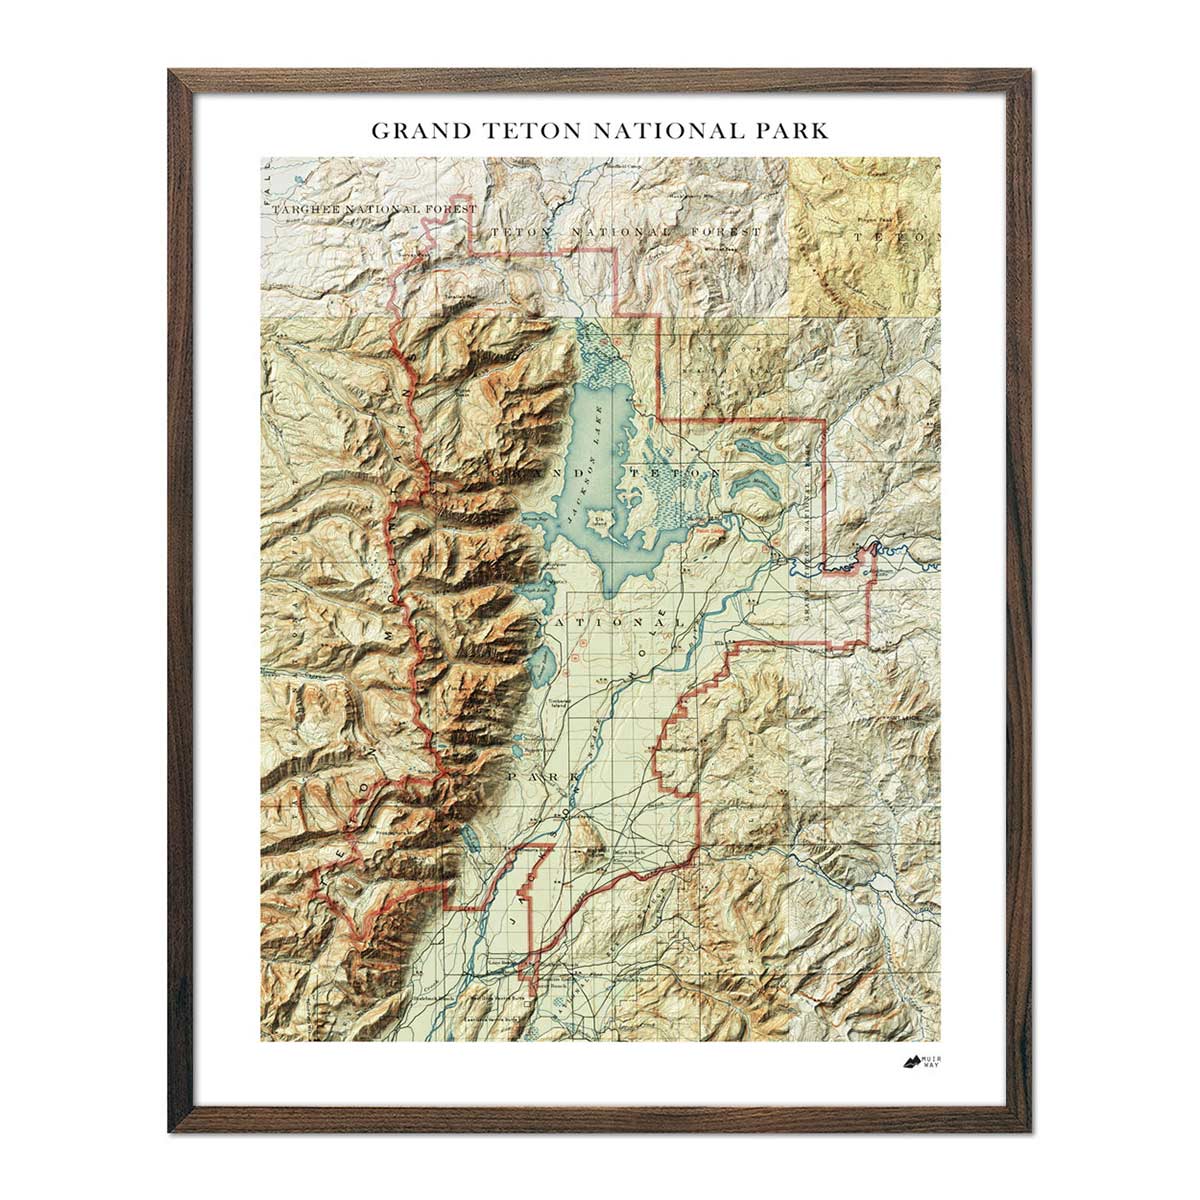
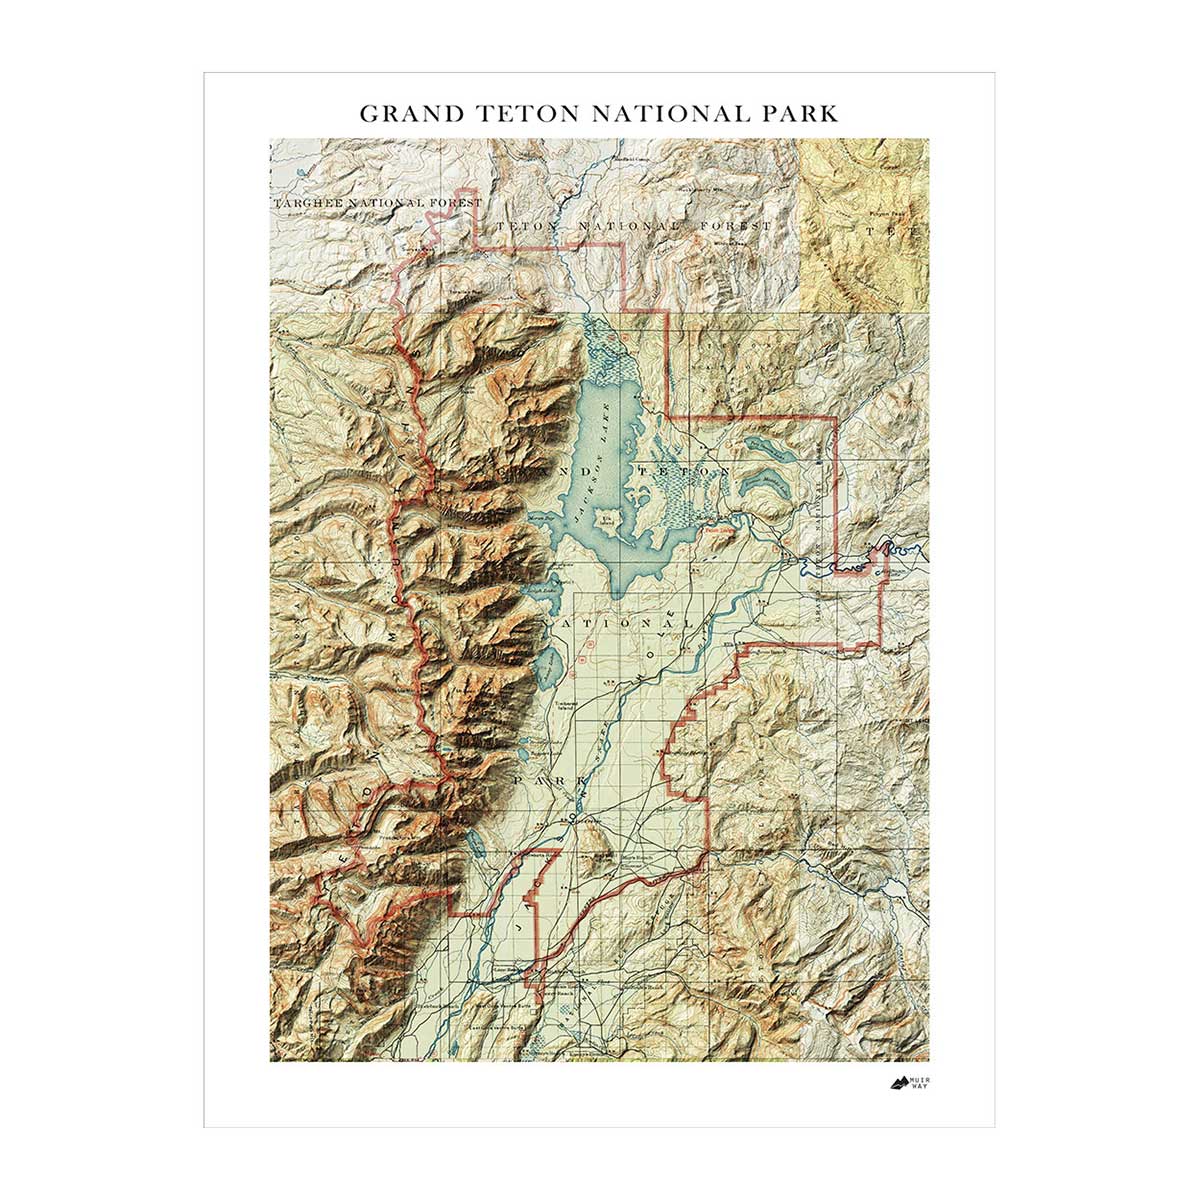
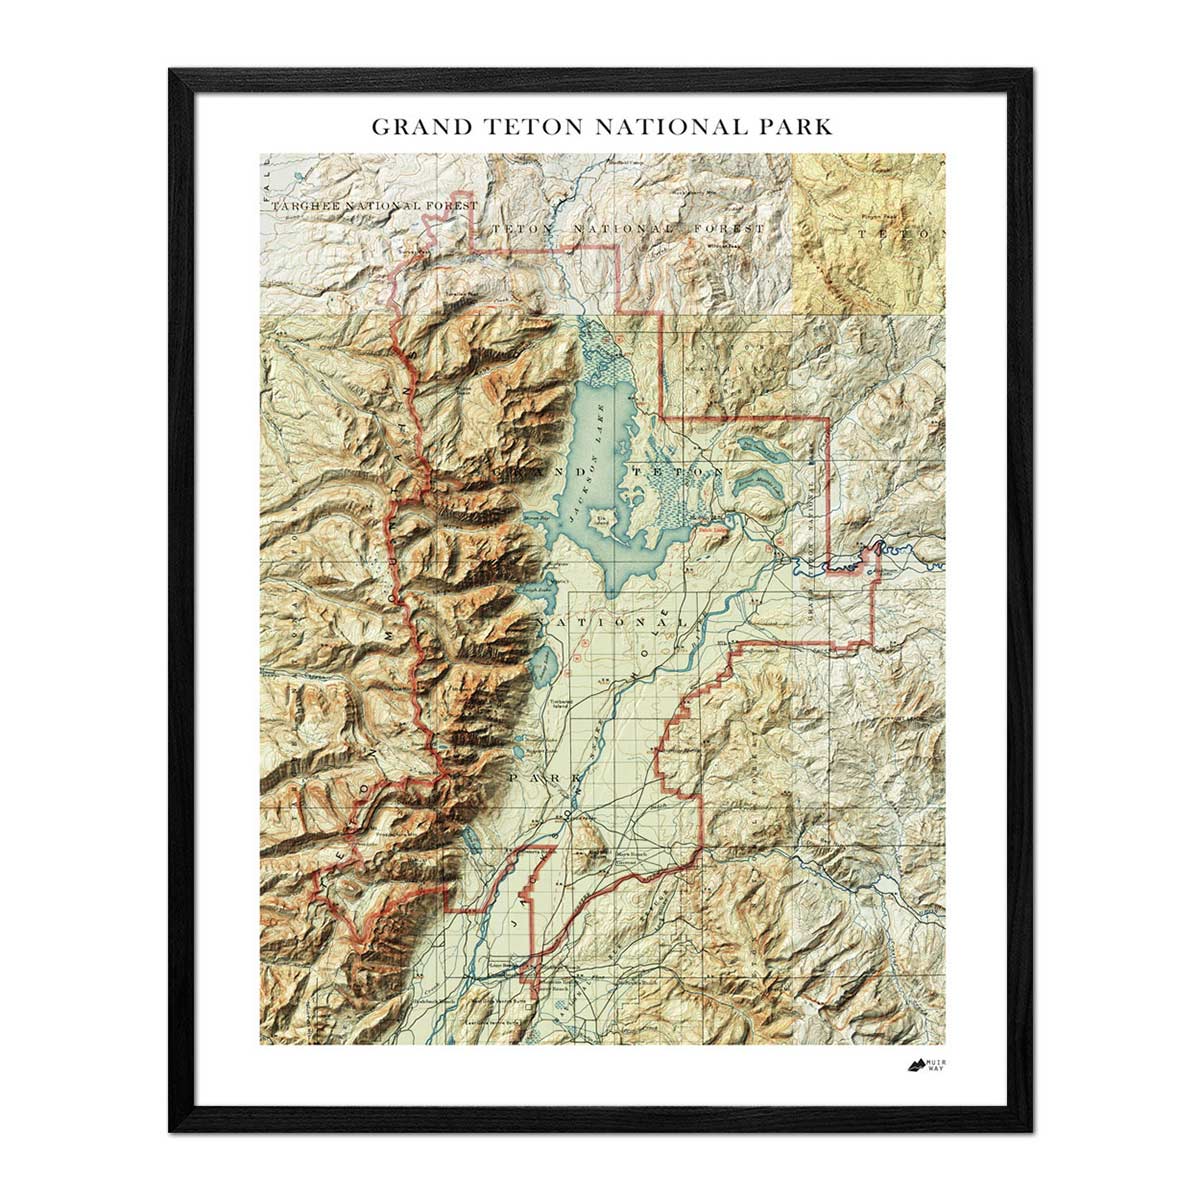
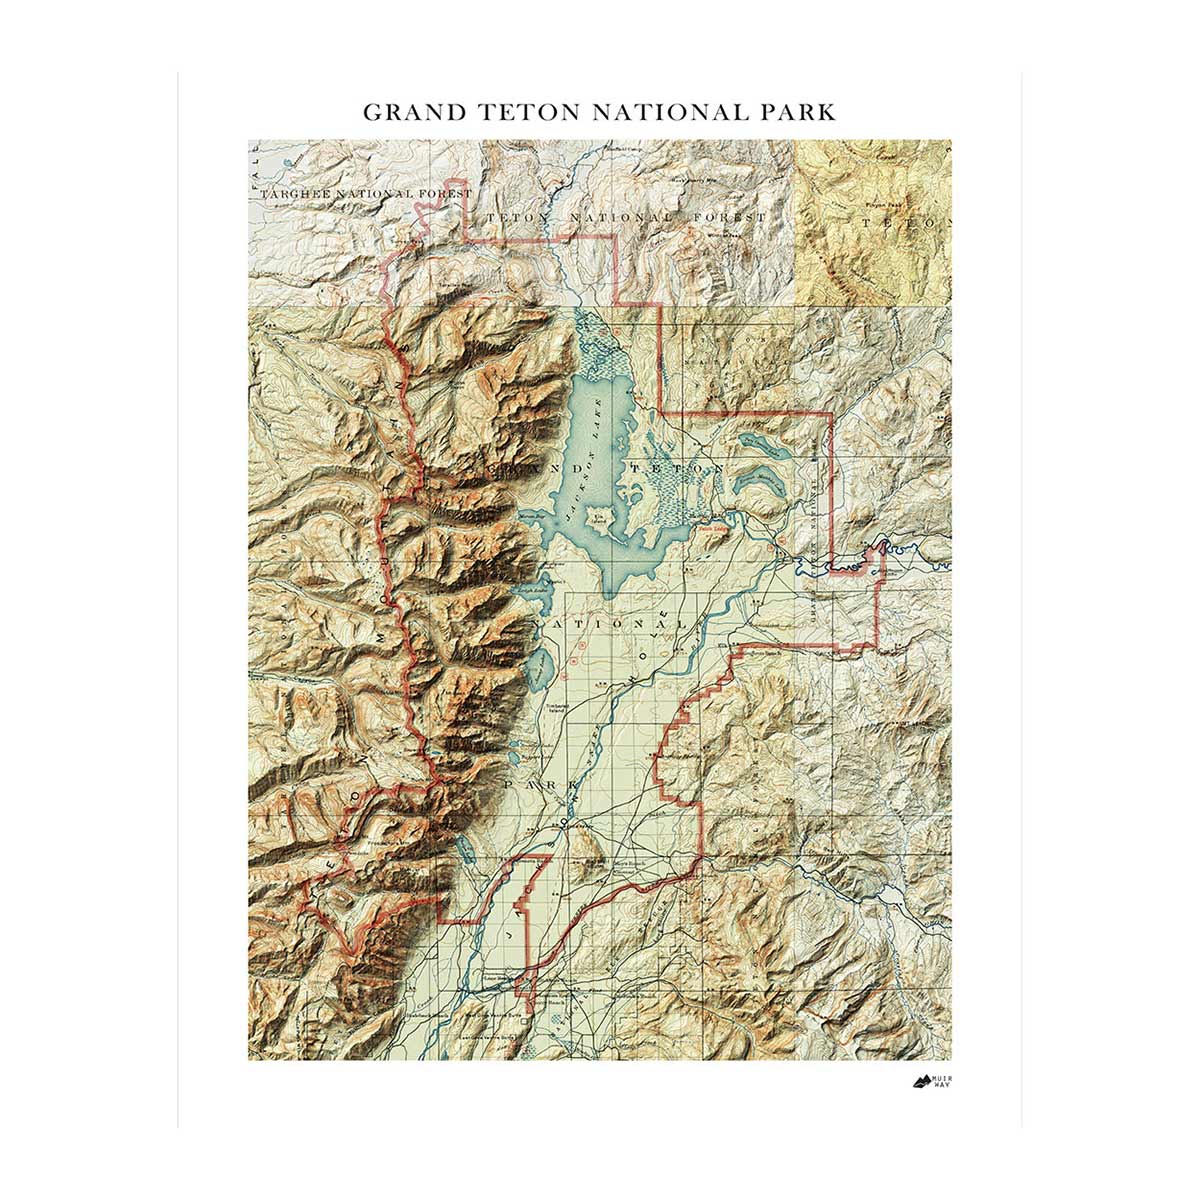
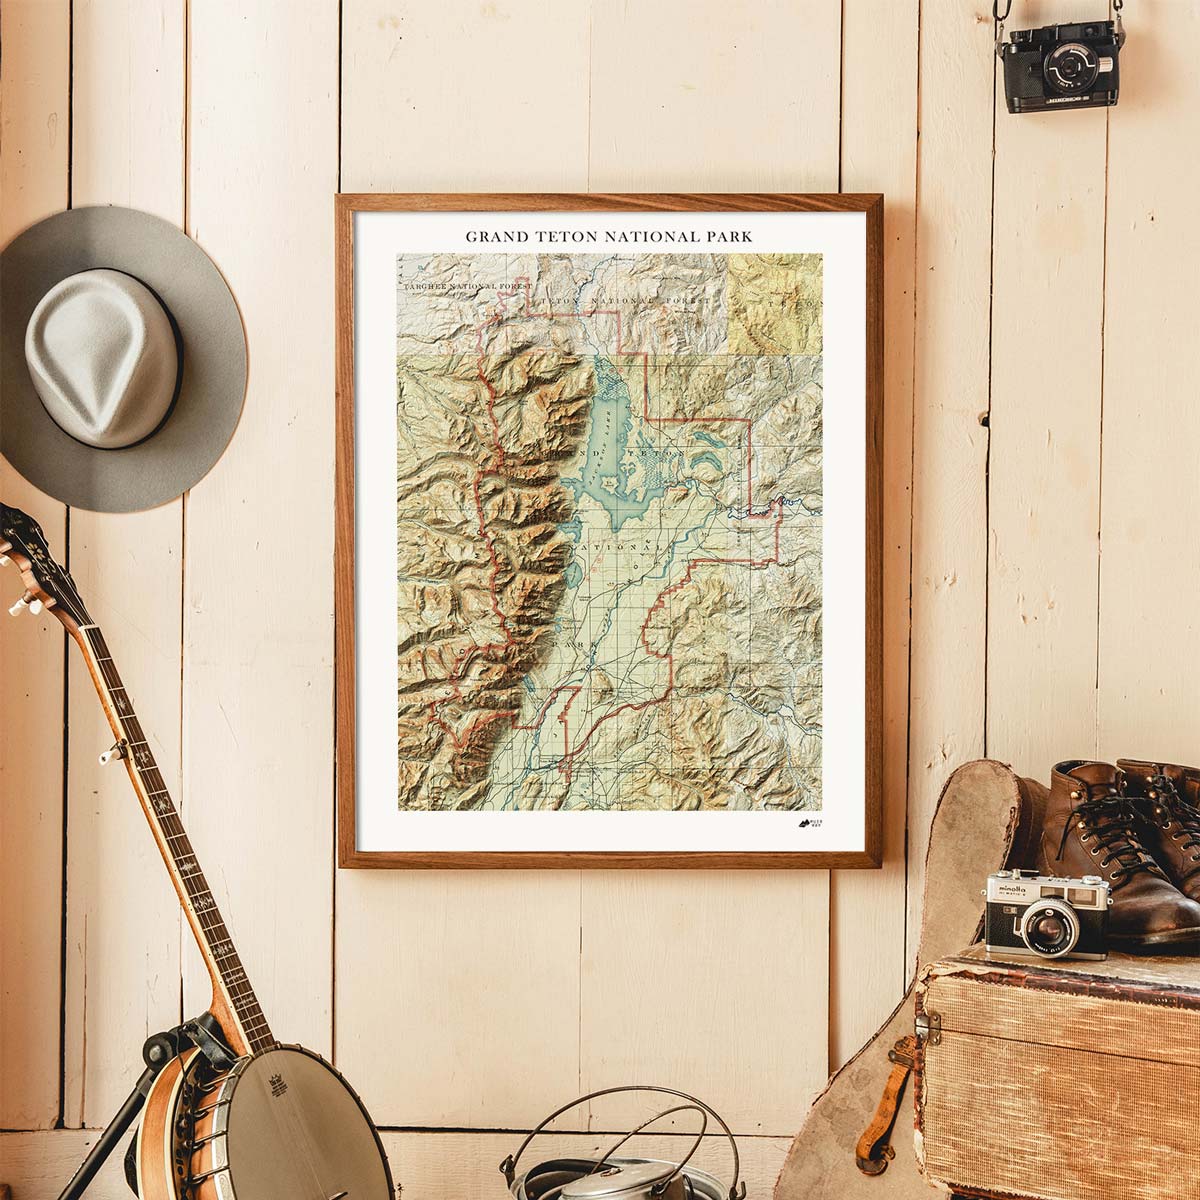
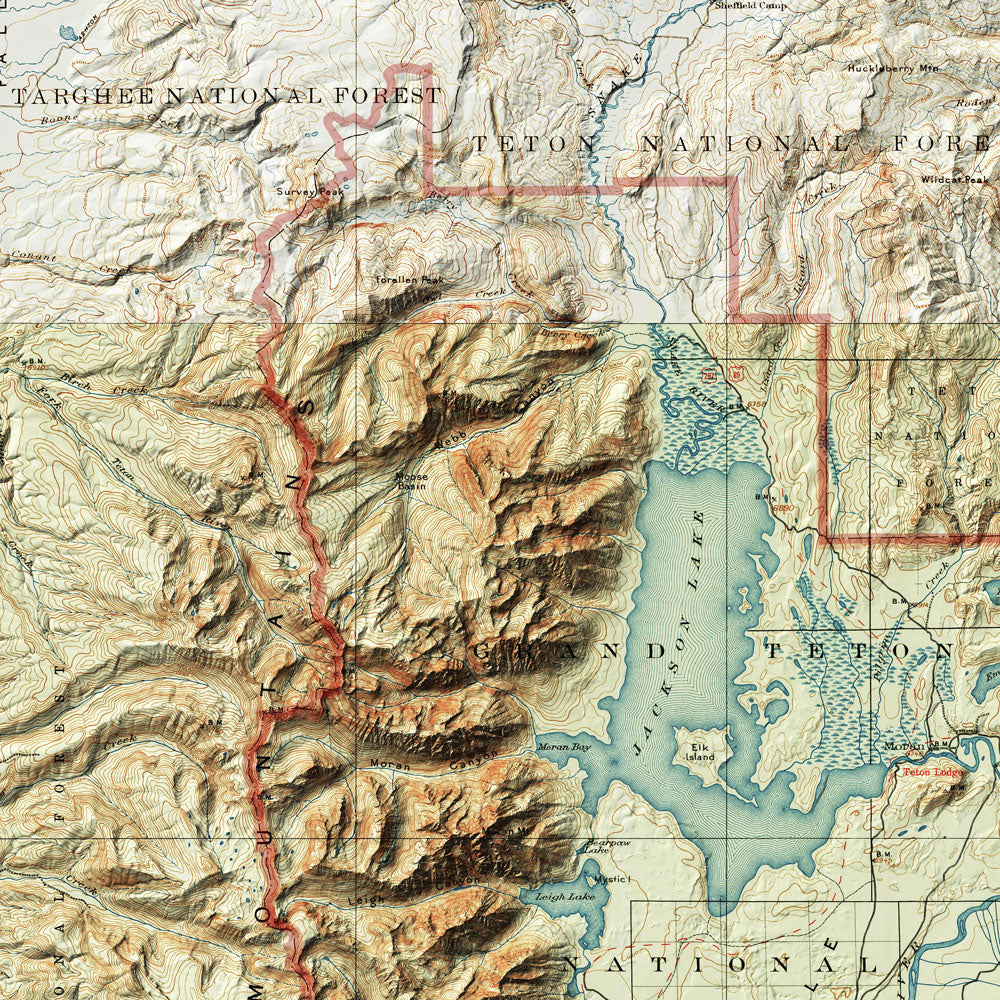
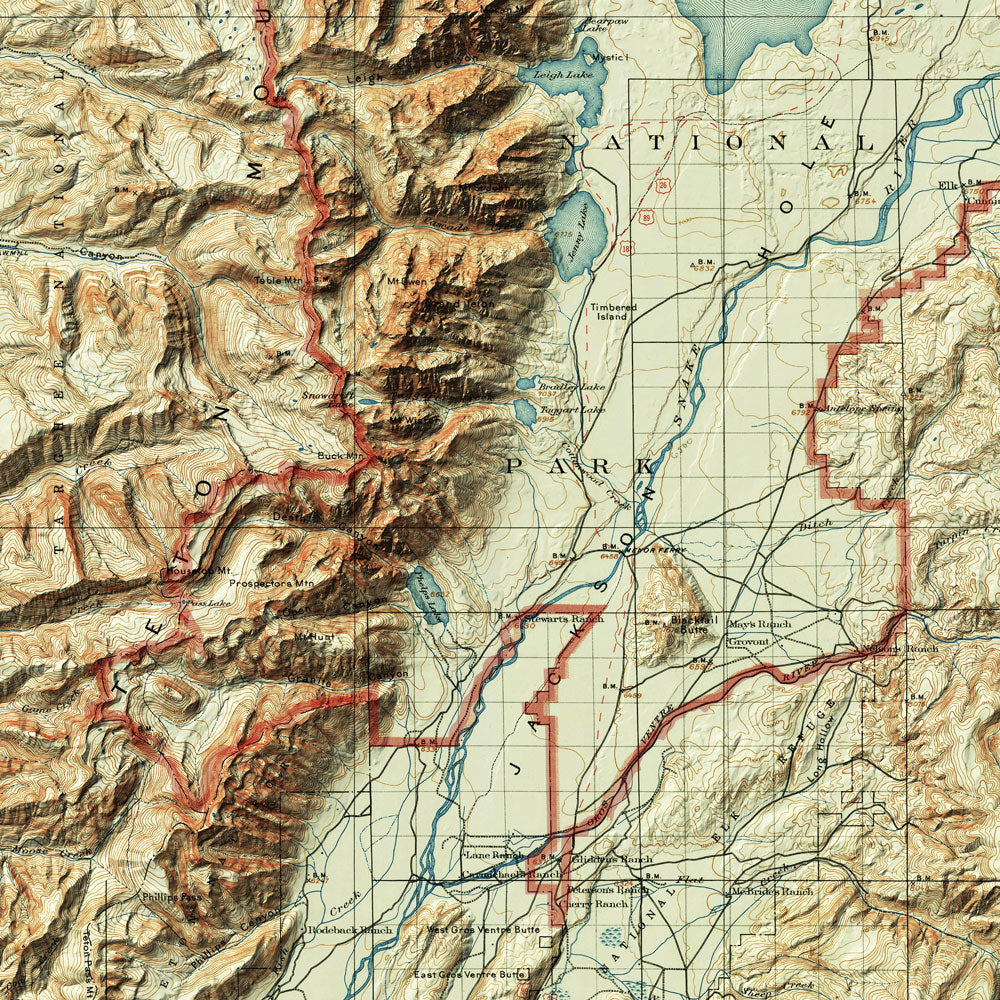
The Grand Teton Relief Map
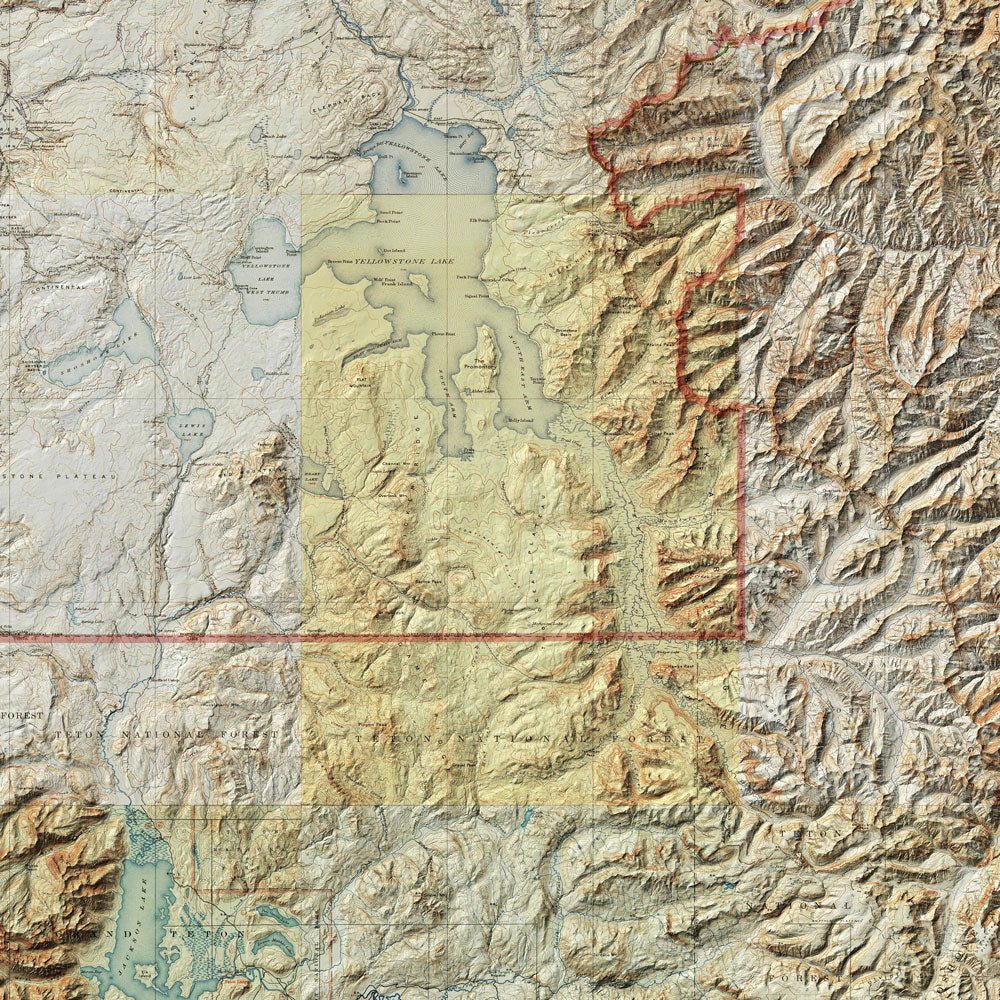
The Grand Teton Relief Map is a mosaic of US Geological Survey (USGS) topographic map sheets that are digitally stitched together and overlaid with accurate hillshading to artfully represent relief and landforms. This is the jagged, crown jewel of the Rocky Mountains, located between Jackson, Wyoming and Yellowstone National Park. These mountains were formed by a block fault that raised the Tetons around 10 MYA, dropped the Jackson Hole valley floor, and was followed by subsequent glaciation.
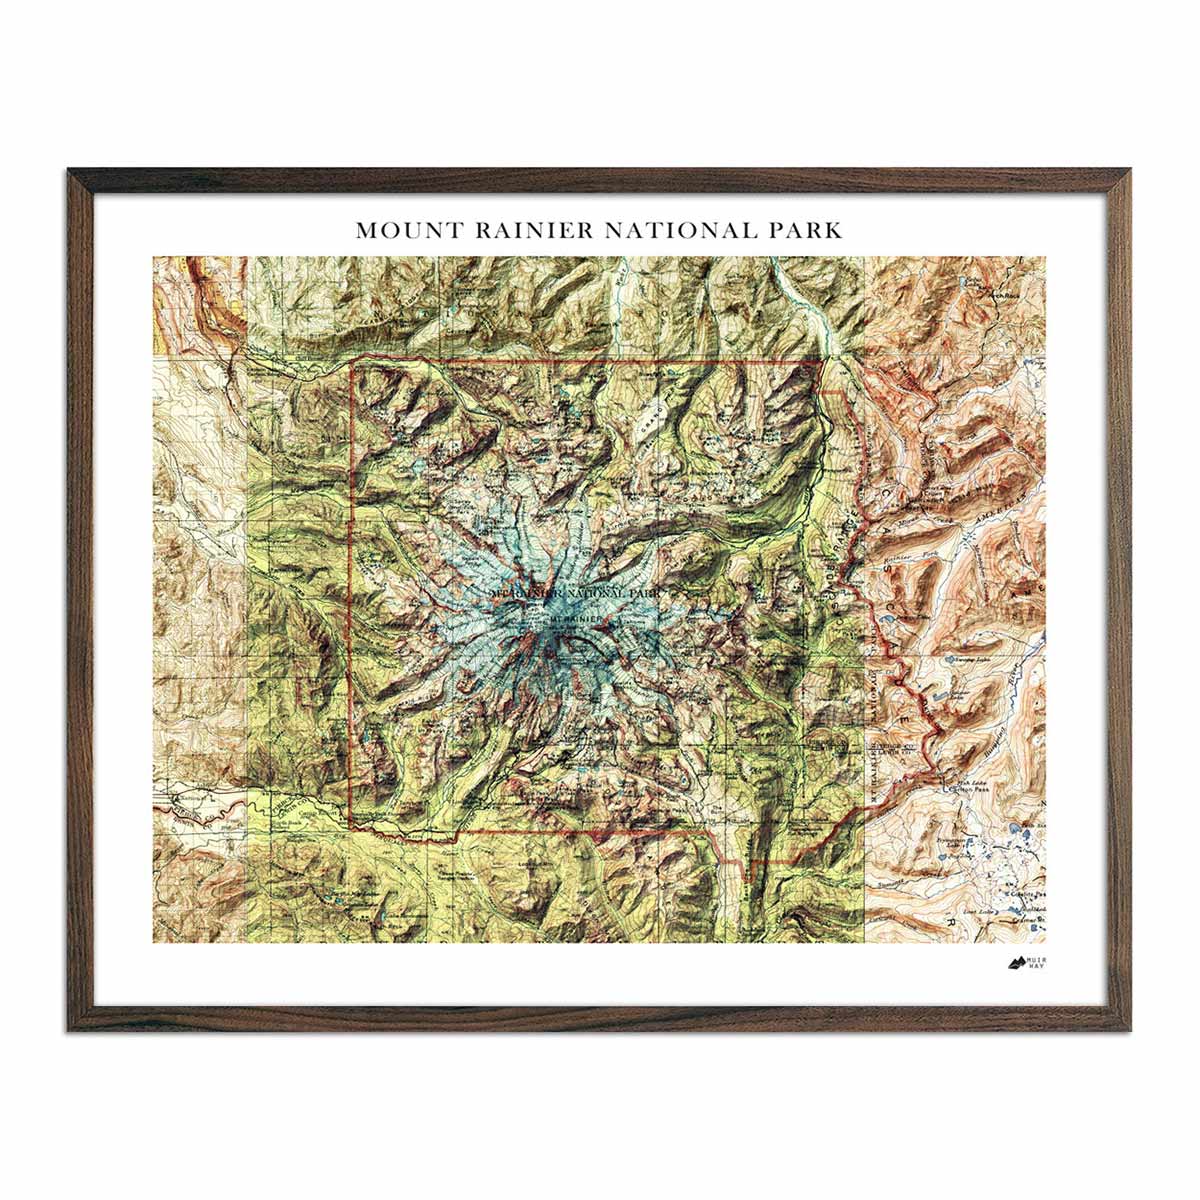
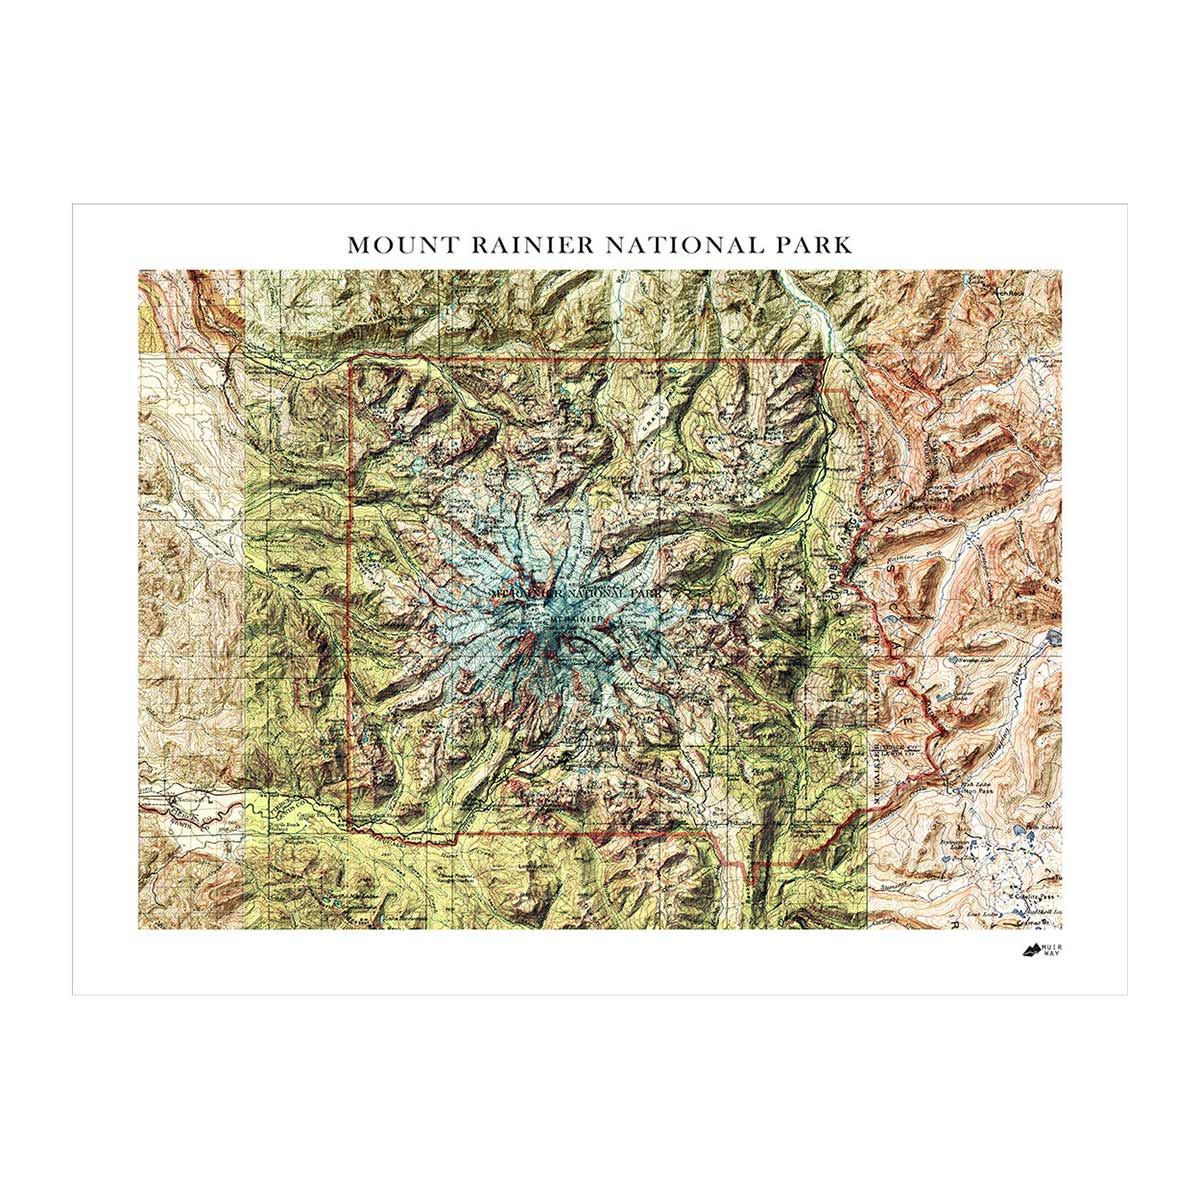
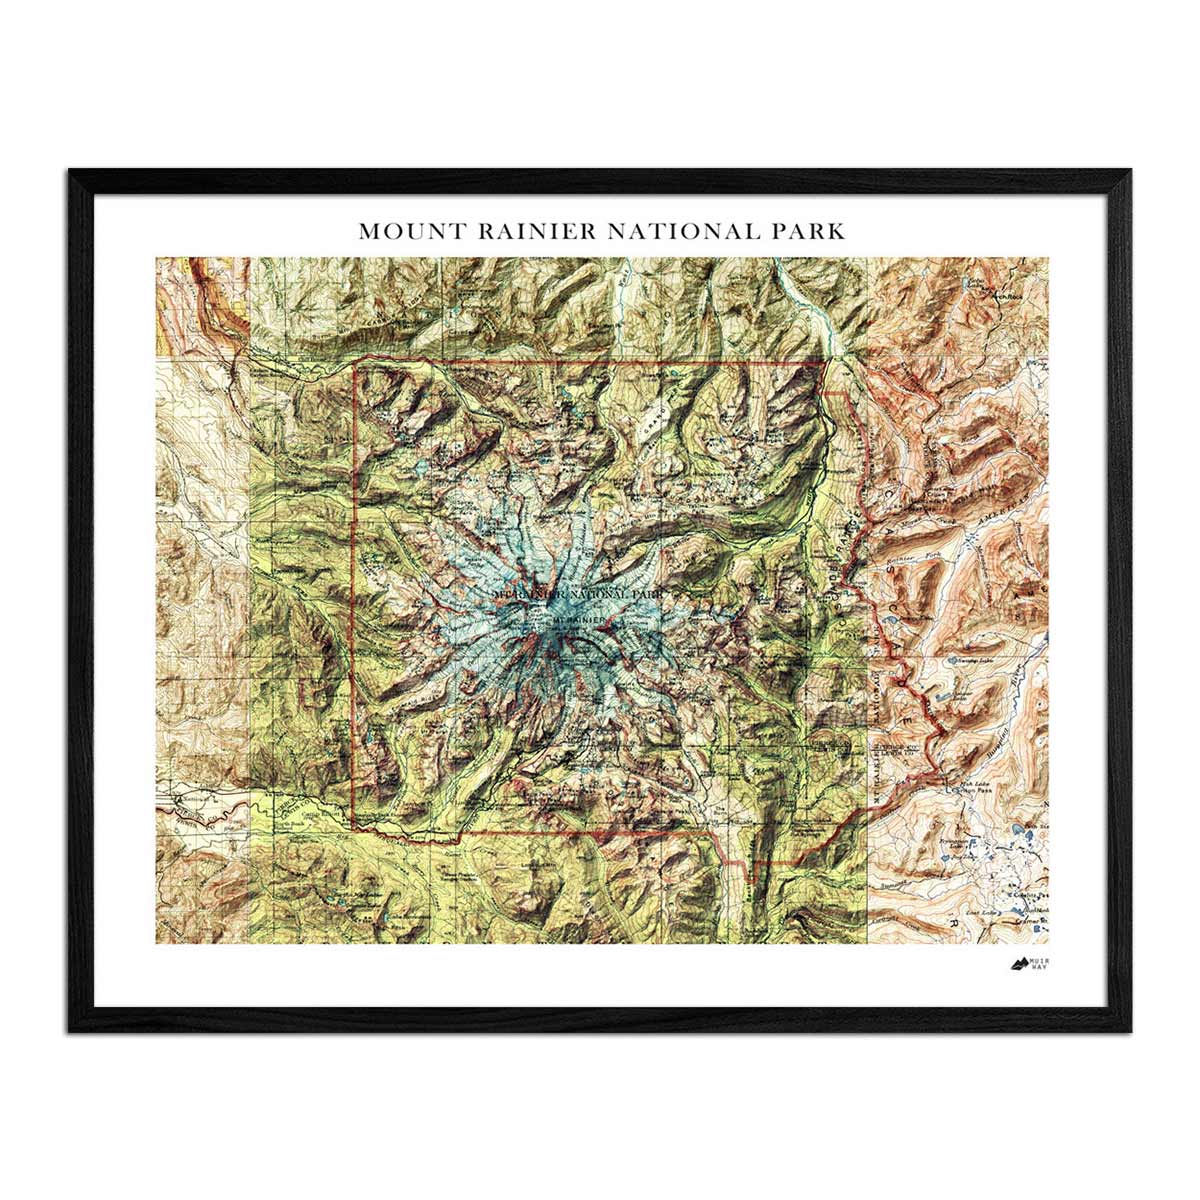
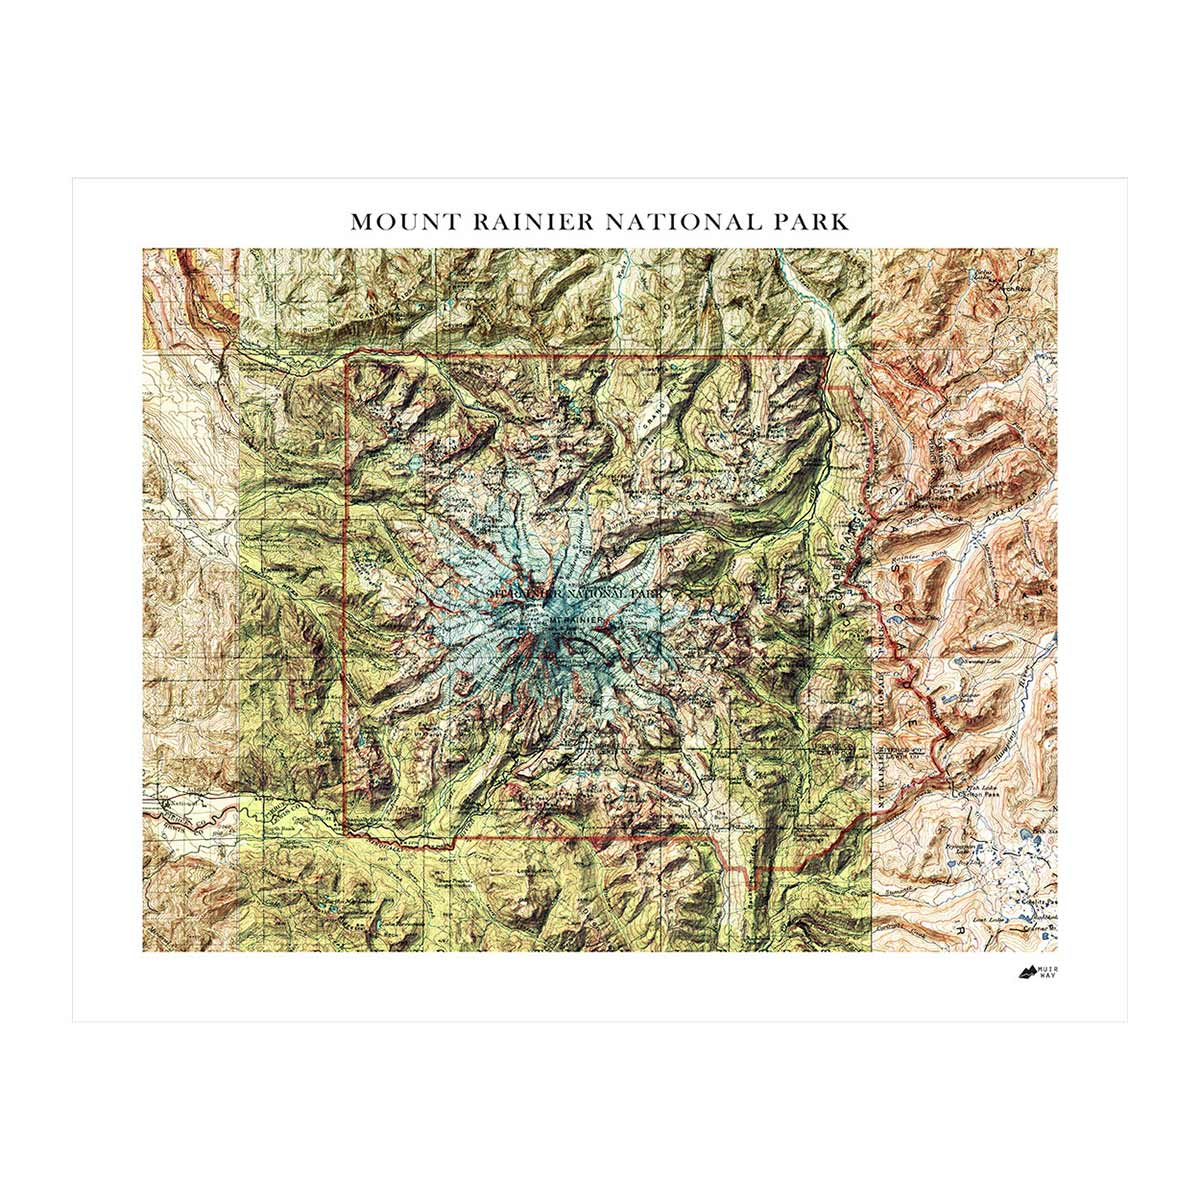
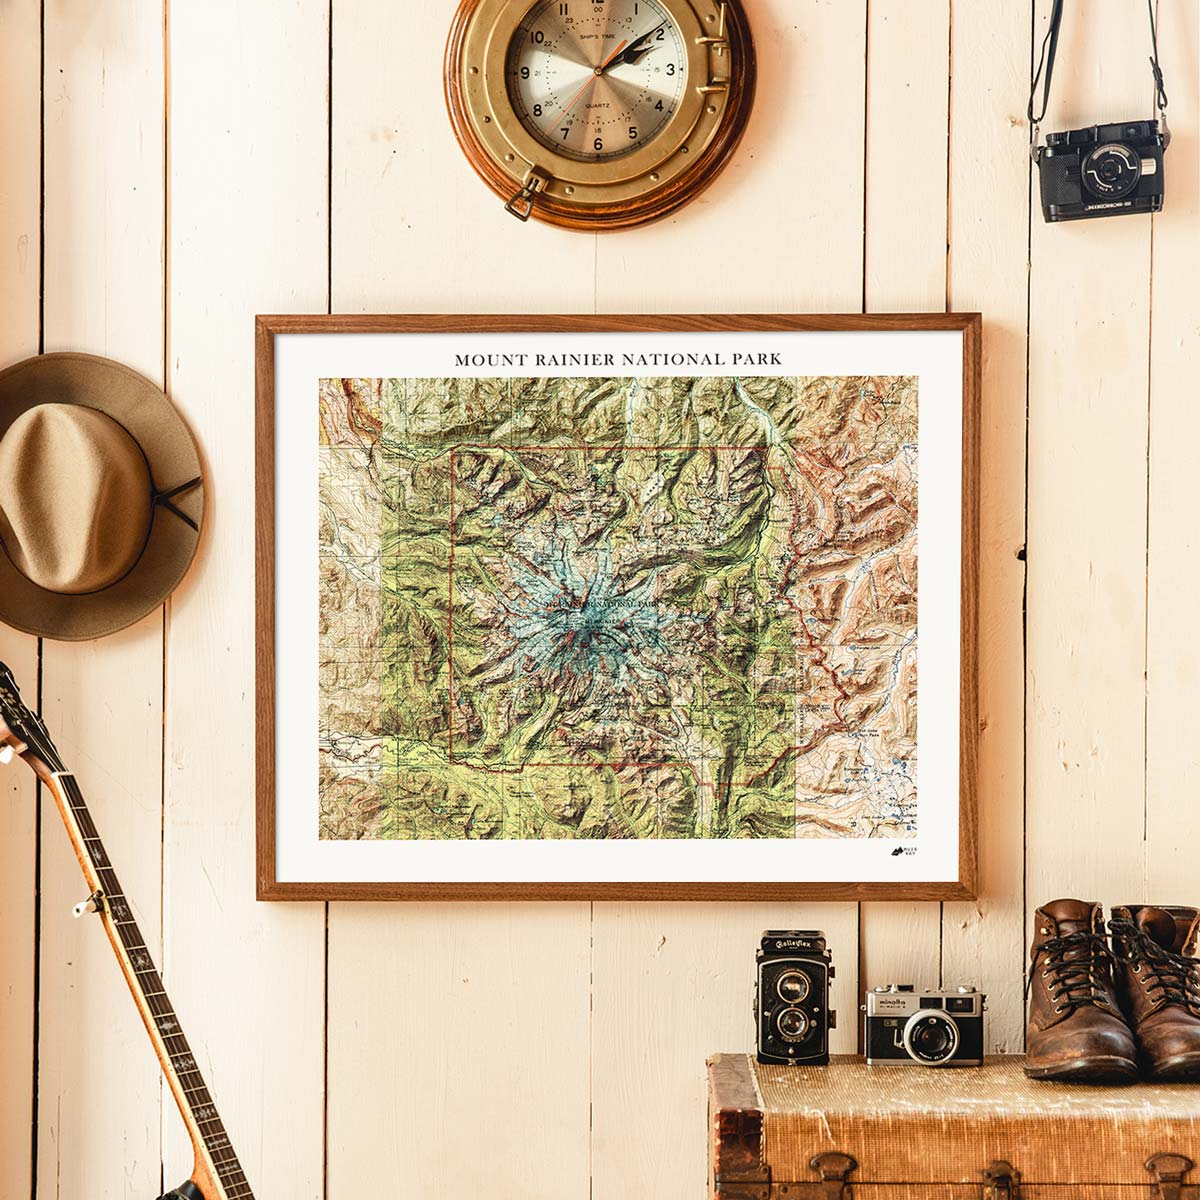
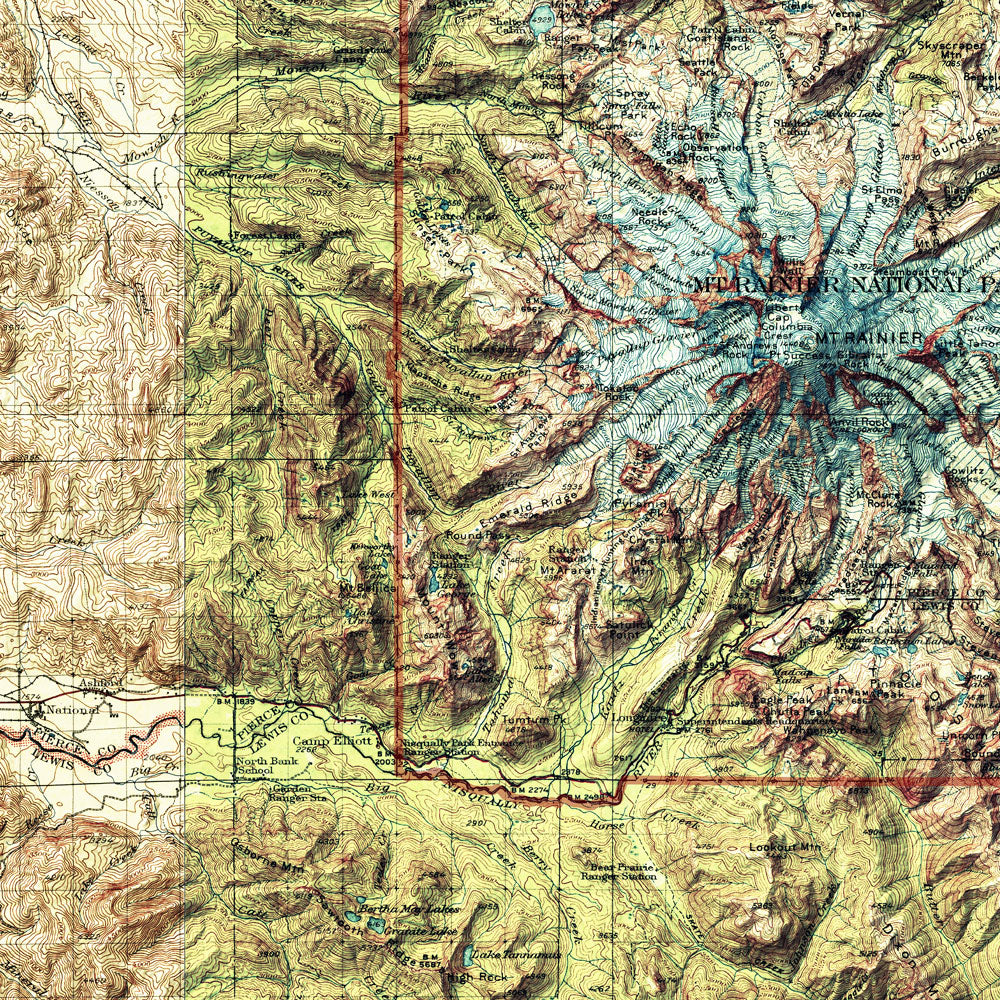
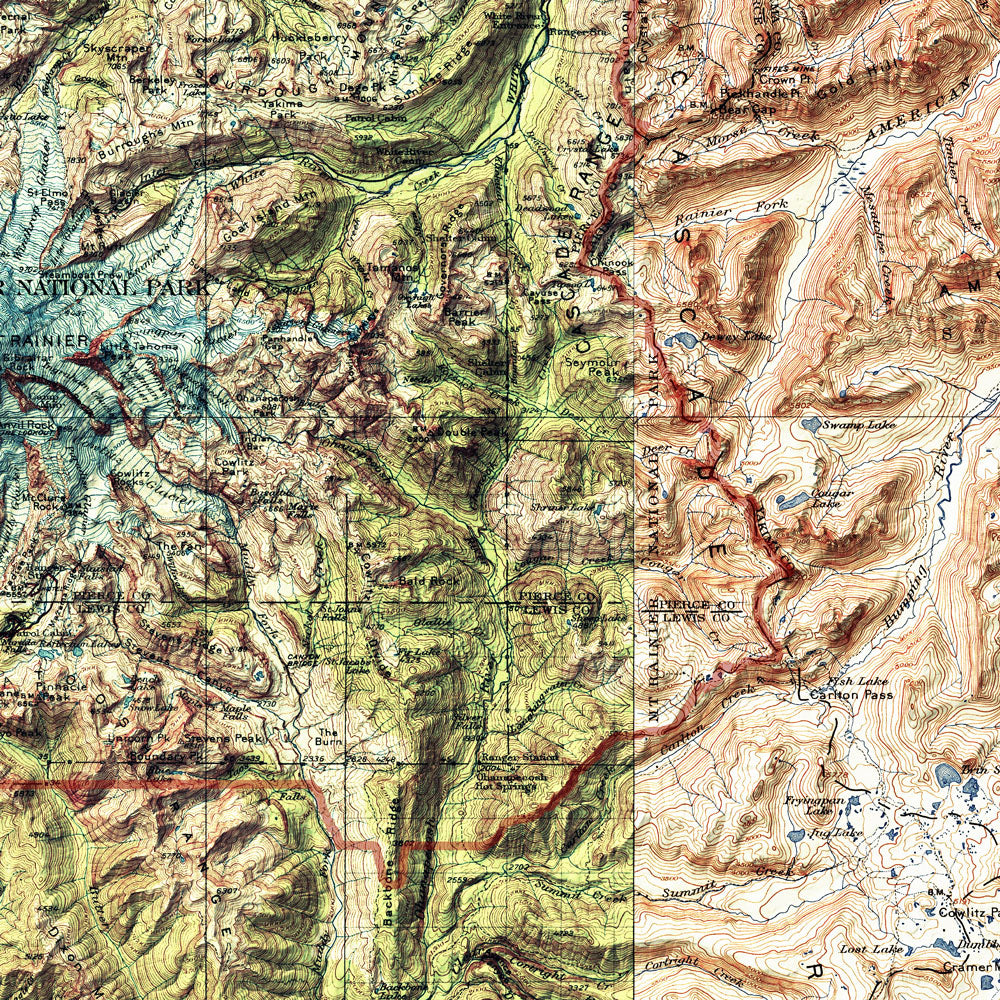
- The Mt. Rainier National Park Relief Map
The Mt. Rainier National Park Relief Map is a mosaic of US Geological Survey (USGS) topographic map sheets that are digitally stitched together and overlaid with accurate hillshading to artfully represent relief and landforms. The tallest volcano and most prominent peak (measure of mountain from base to summit) in the USA lower-48, Mt. Rainier is part of the Pacific Ring of Fire and is the highest peak in the Cascade Range, Washington State, and Pacific Northwest. This young peak, of only 500,000 years of age, is famously visible from Seattle and has the most glacial mass of anywhere in the lower 48. - The Shenandoah Park Relief Map
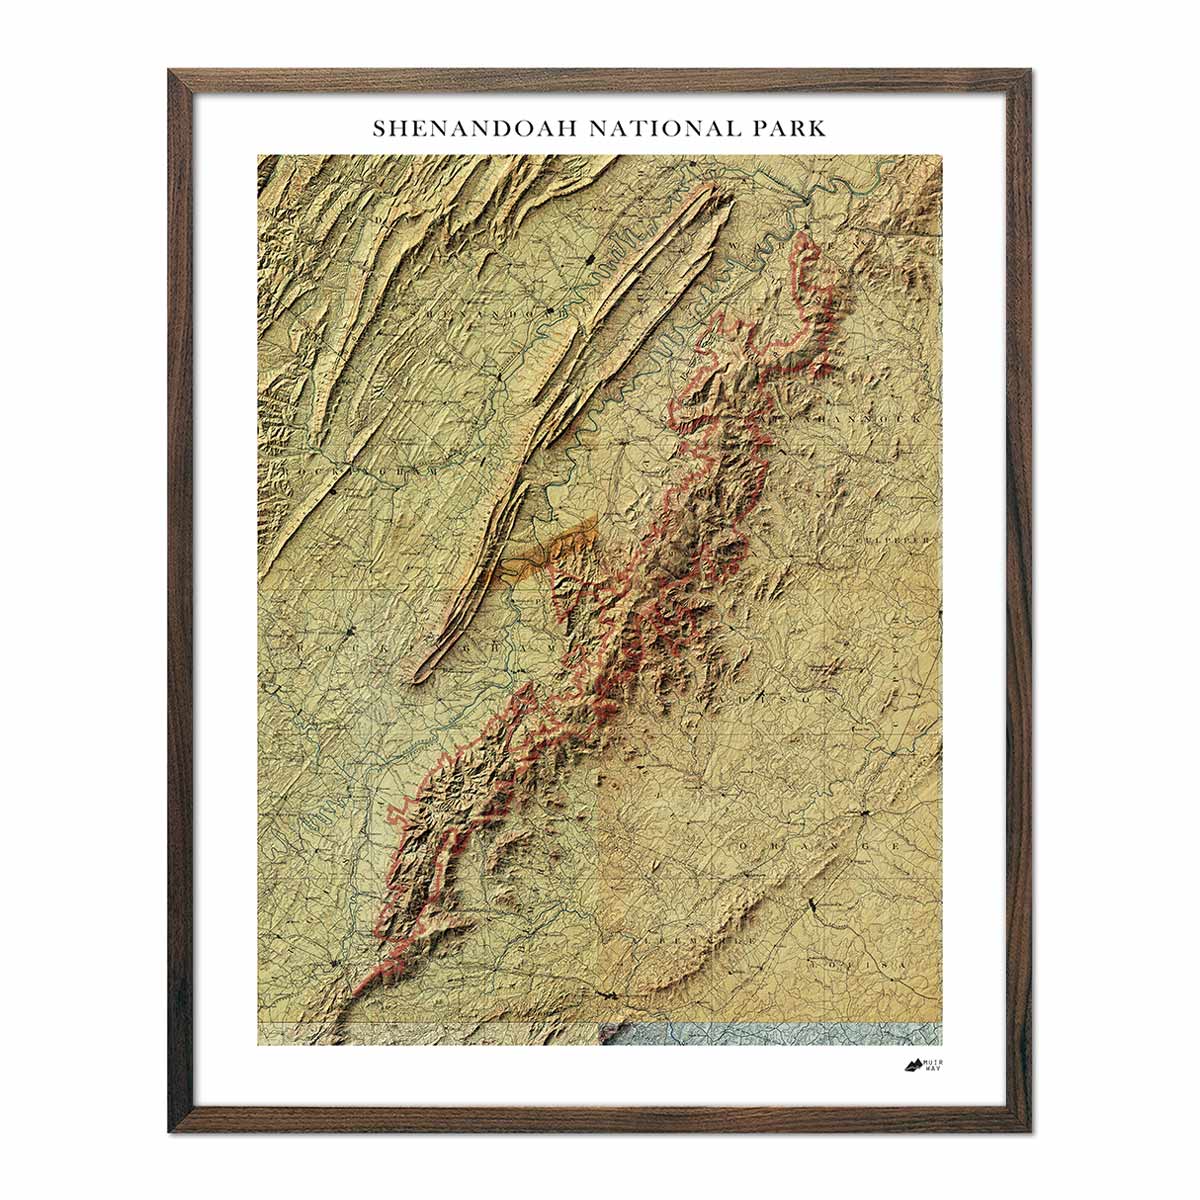
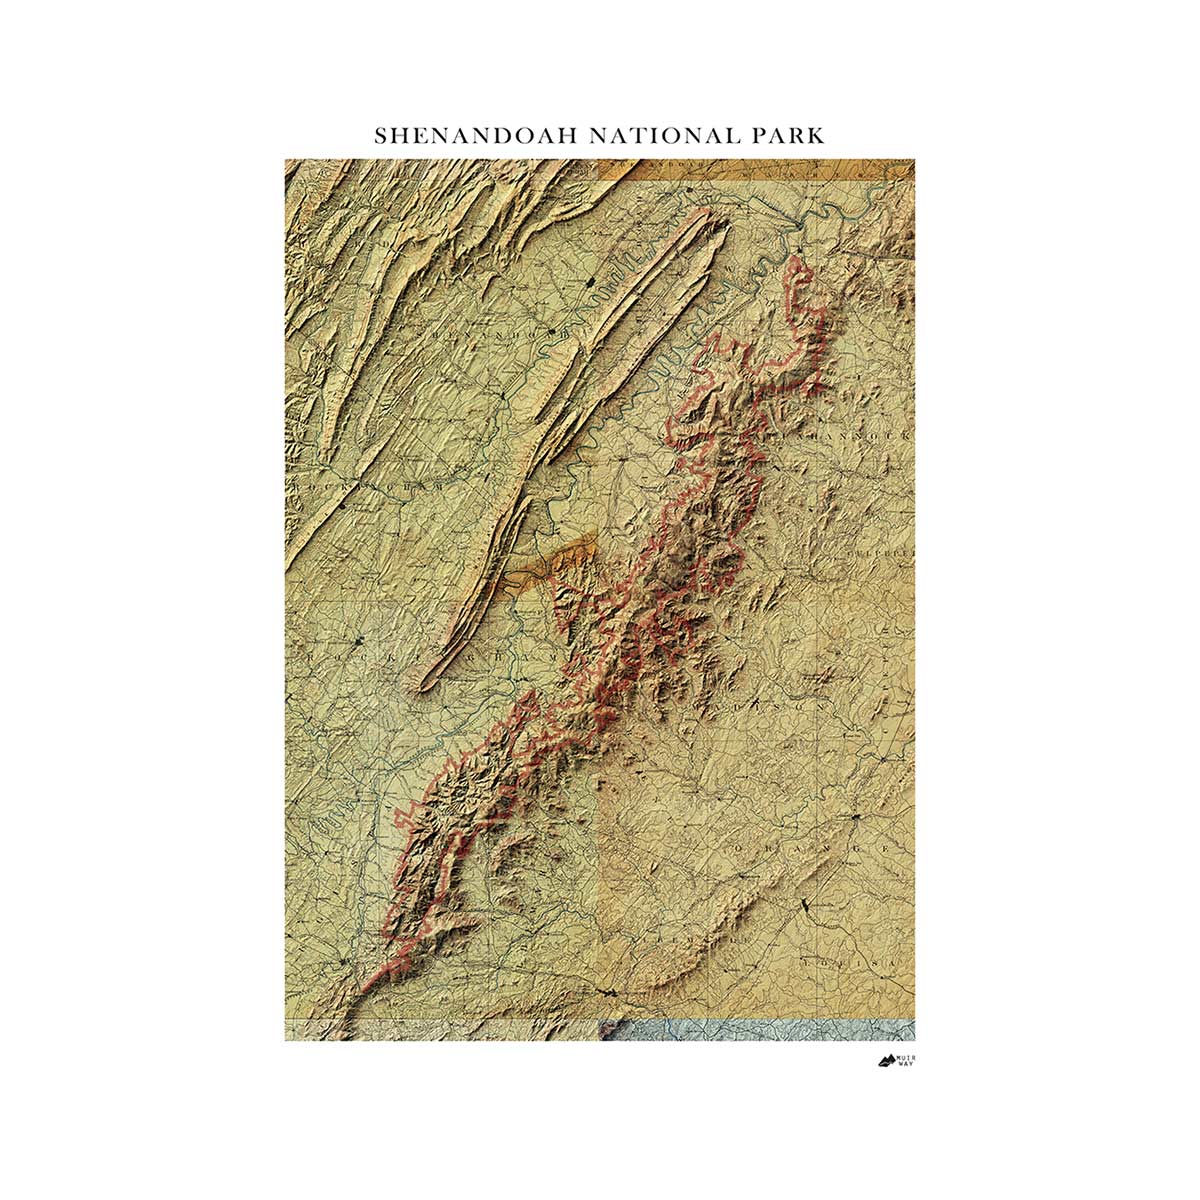
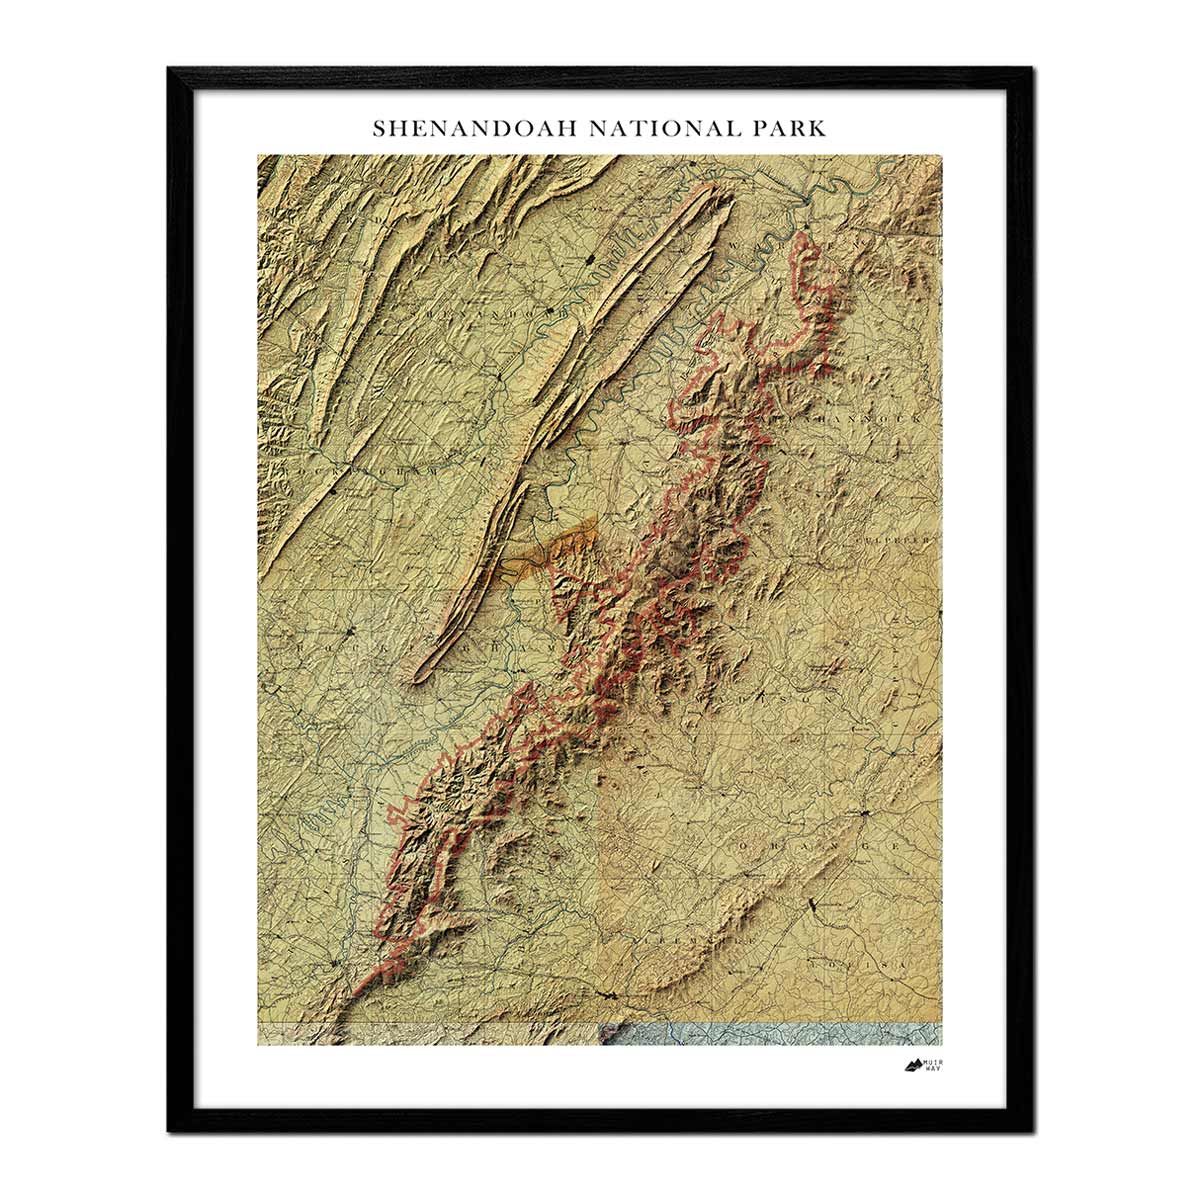
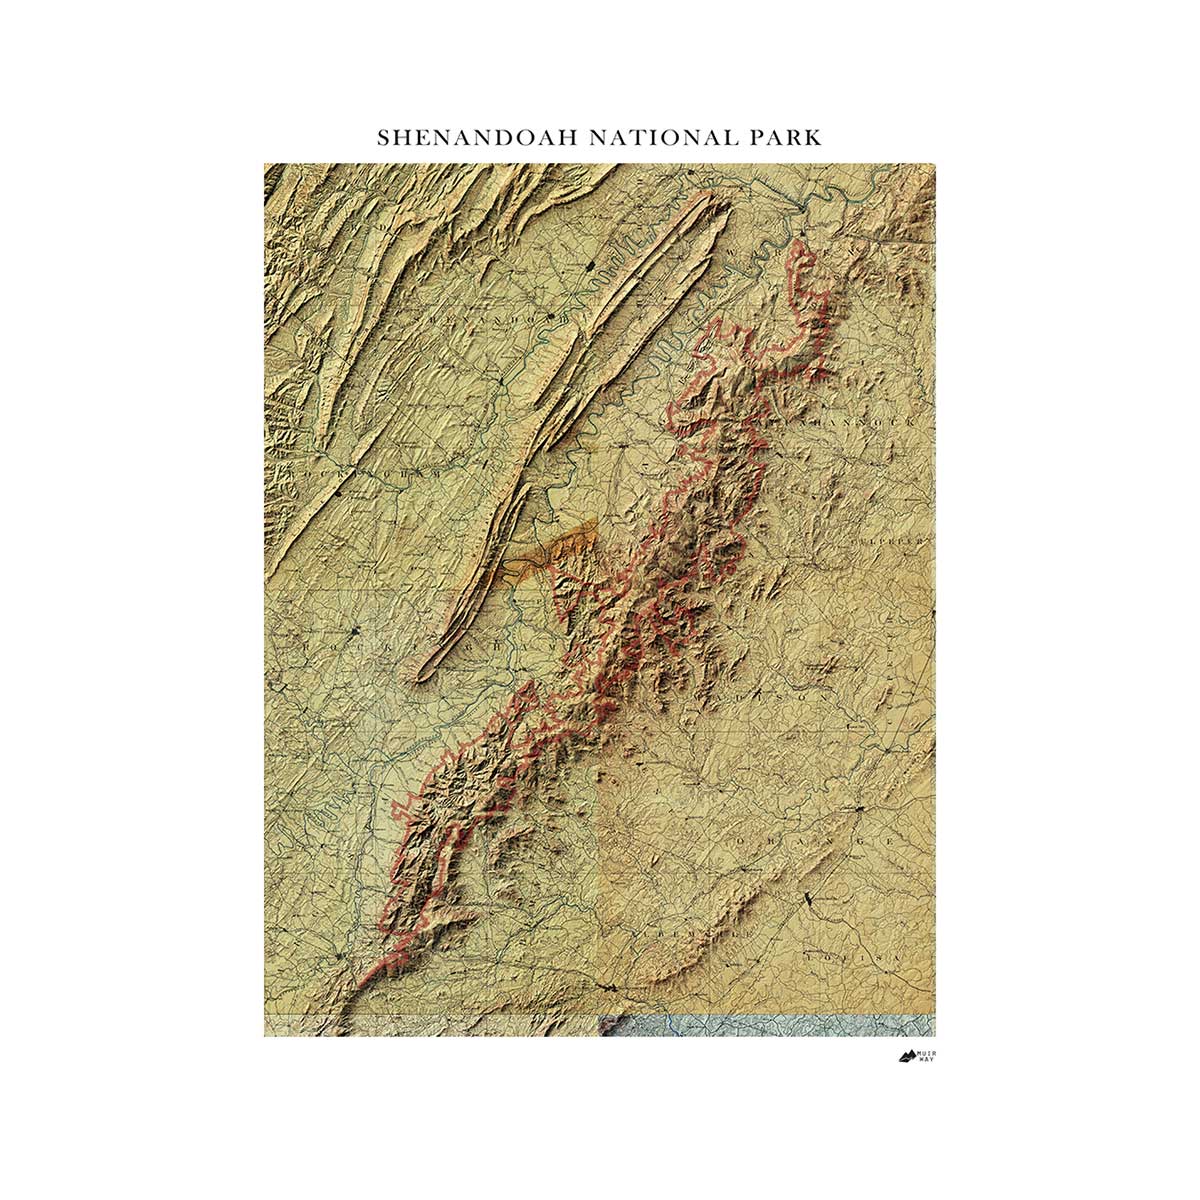
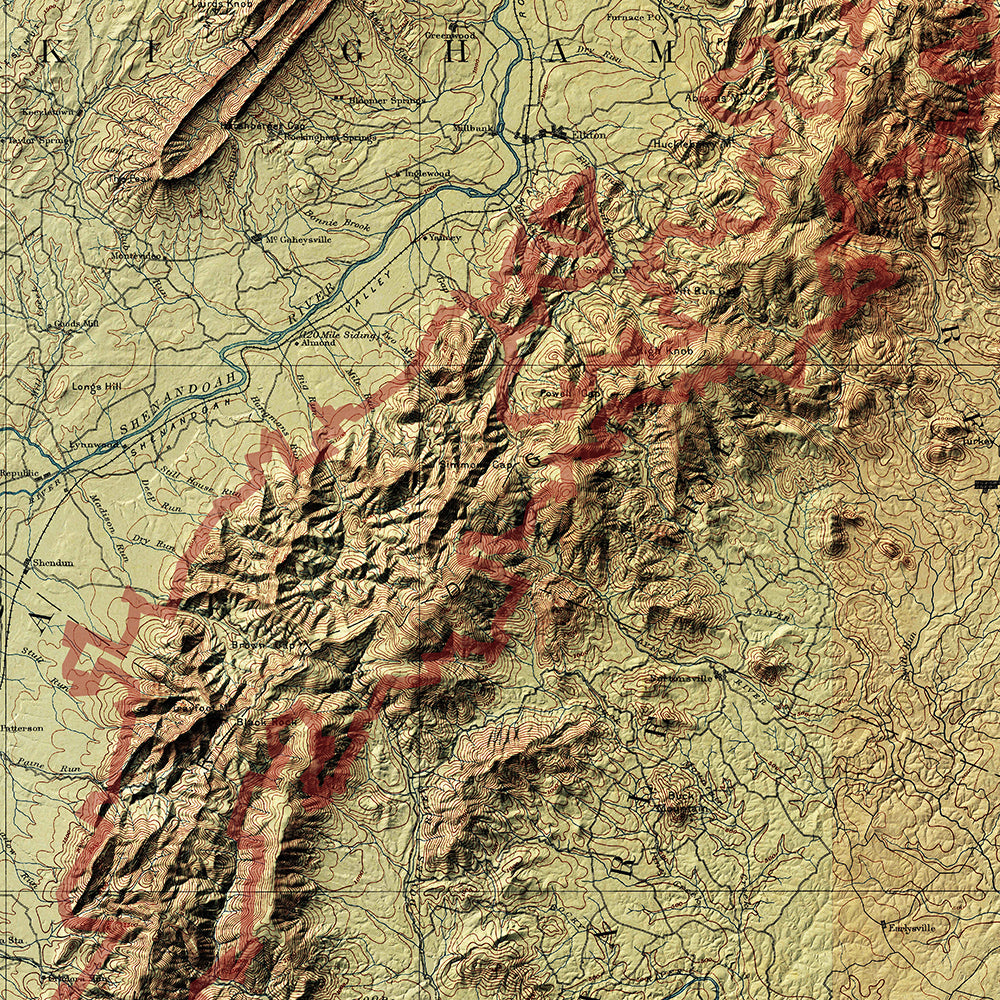
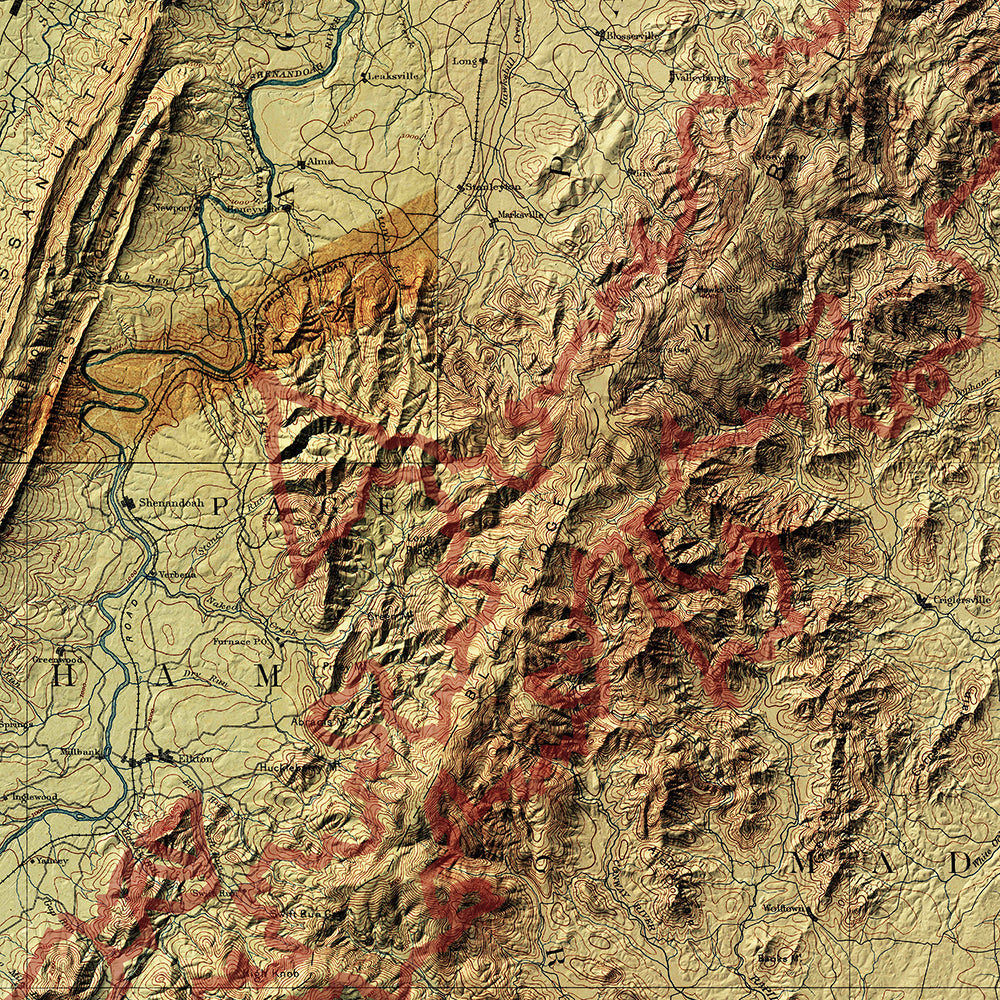
The Shenandoah Park Relief Map is a mosaic of US Geological Survey (USGS) topographic map sheets that are digitally stitched together and overlaid with accurate hillshading to artfully represent relief and landforms. A linear national park along the Blue Ridge Mountains and Skyline Drive in northern Virginia, the park rises to its highest point at Hawksbill Mountain at 4,051 feet (1,235 m). The Blue Ridge is a subrange of the Appalachian Mountains and forms part of the range’s fold and thrust belt. They were formed during the Alleghanian orogeny between 325 to 260 MYA.
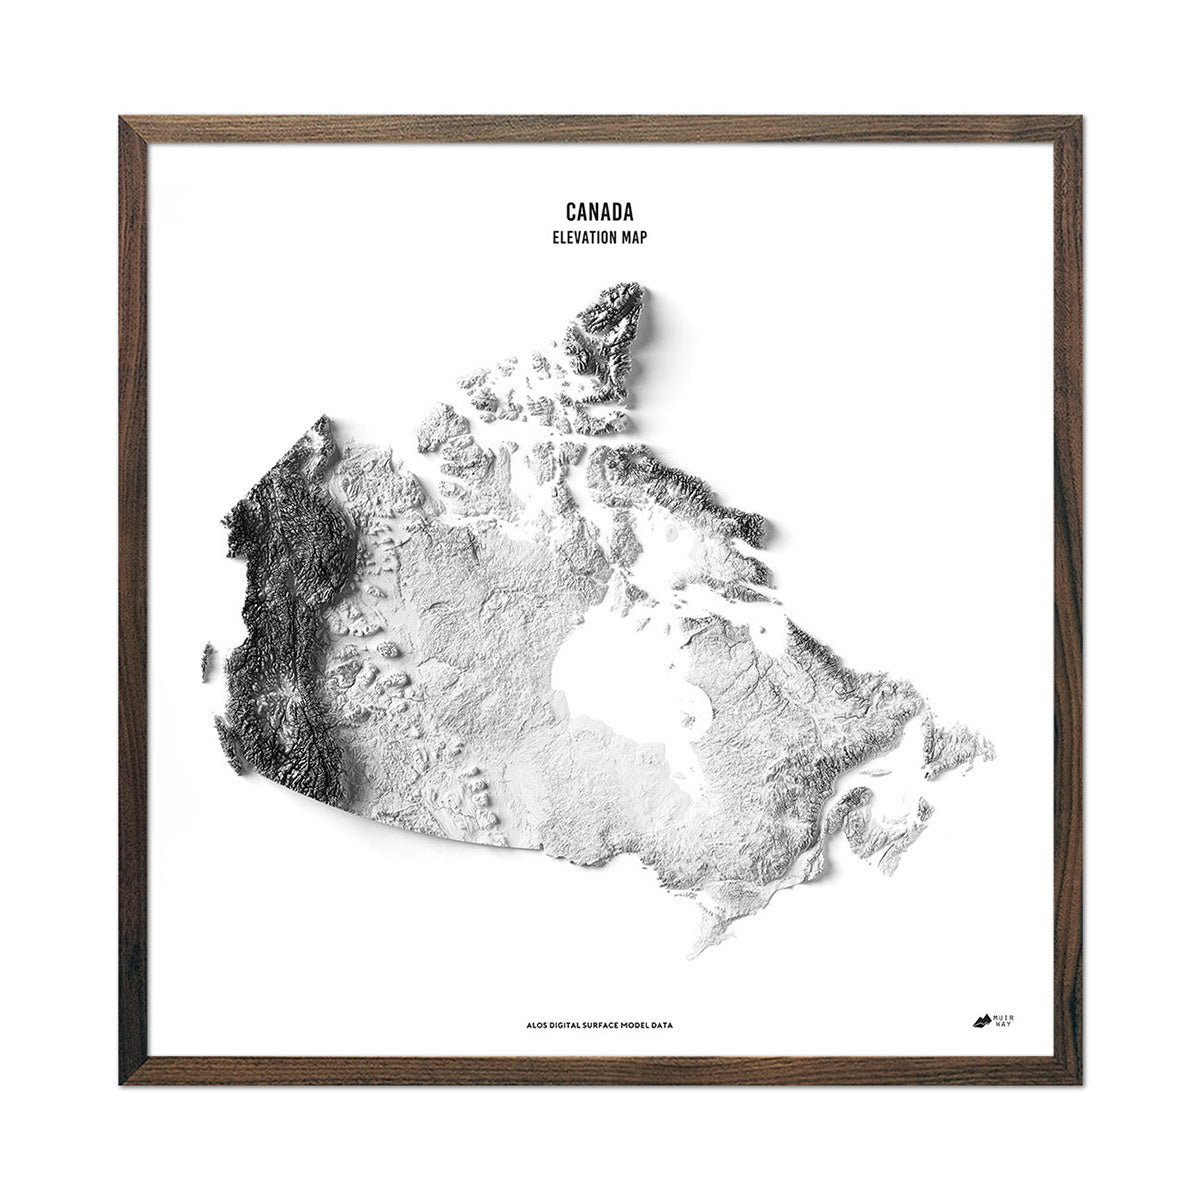
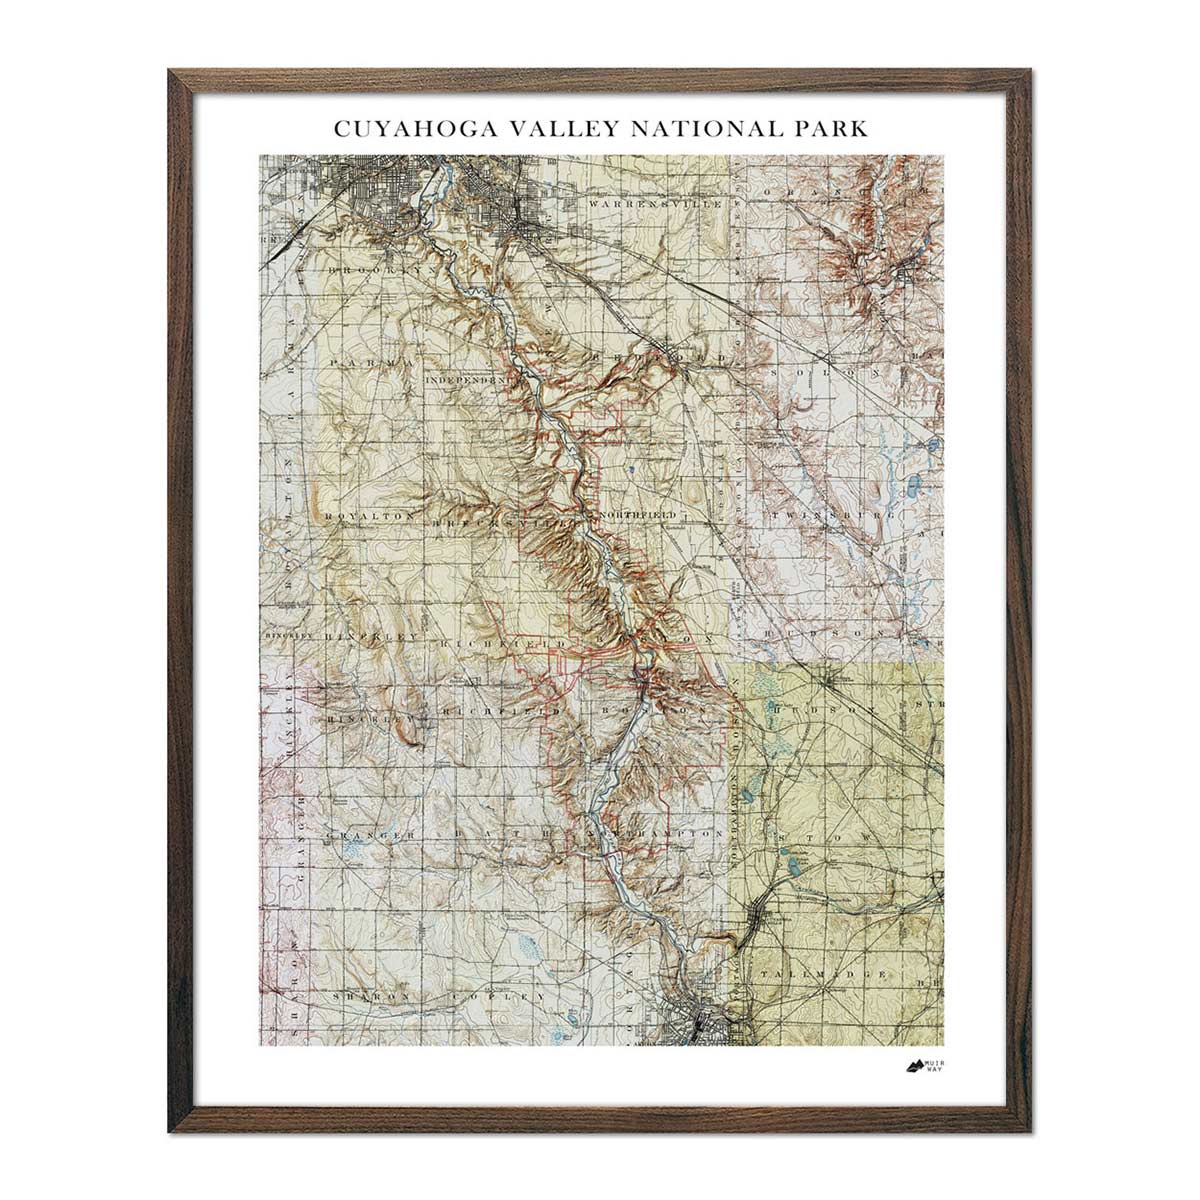
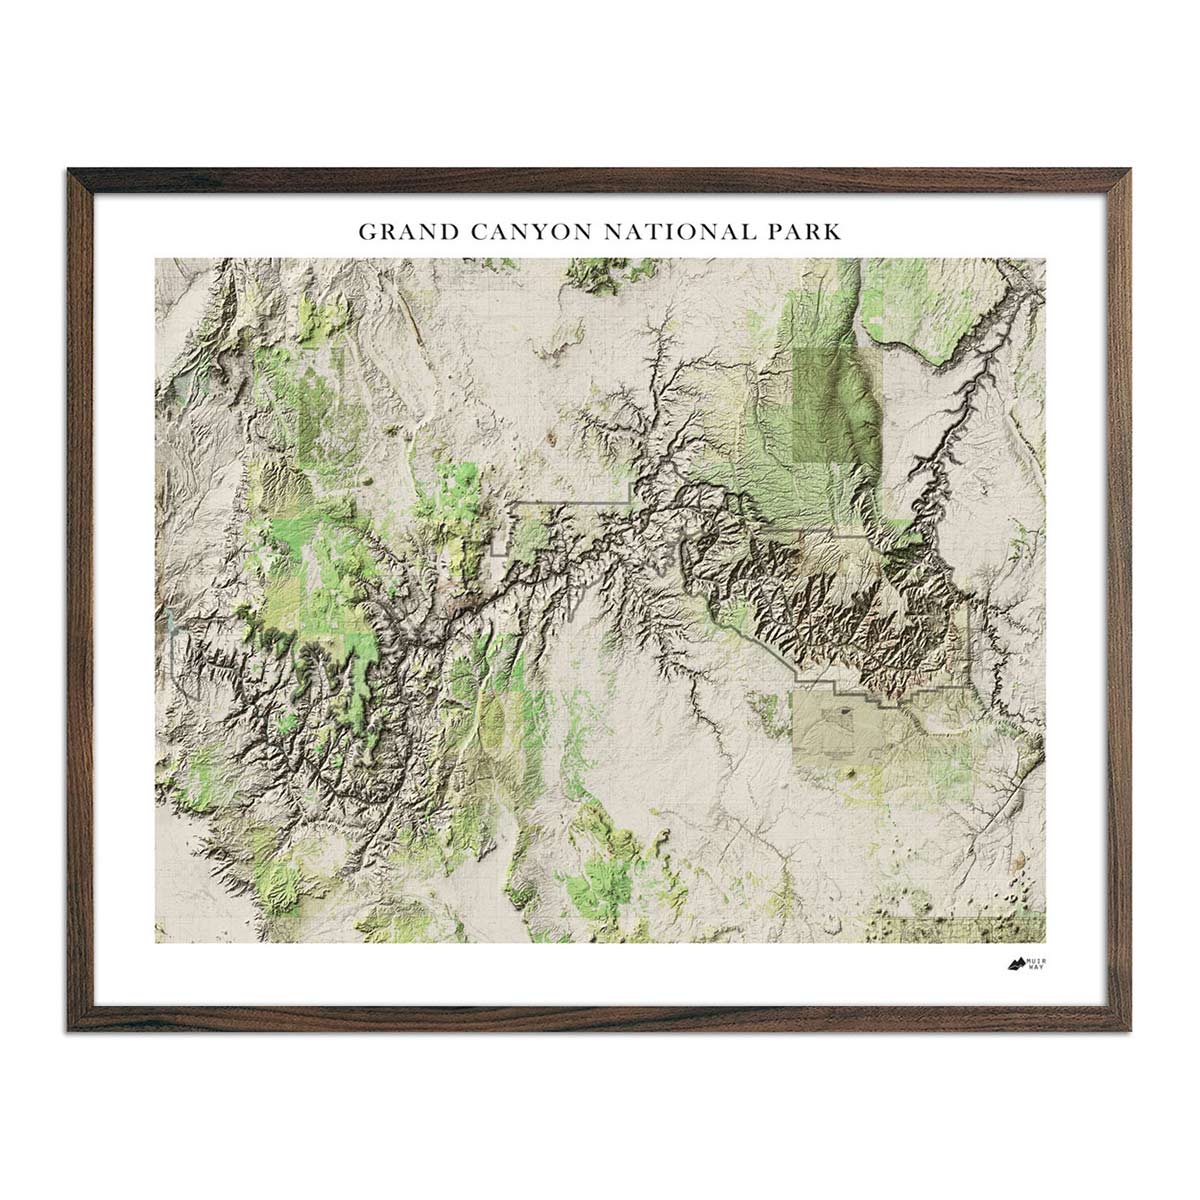
What is the Difference Between Relief Maps and Elevation Maps?
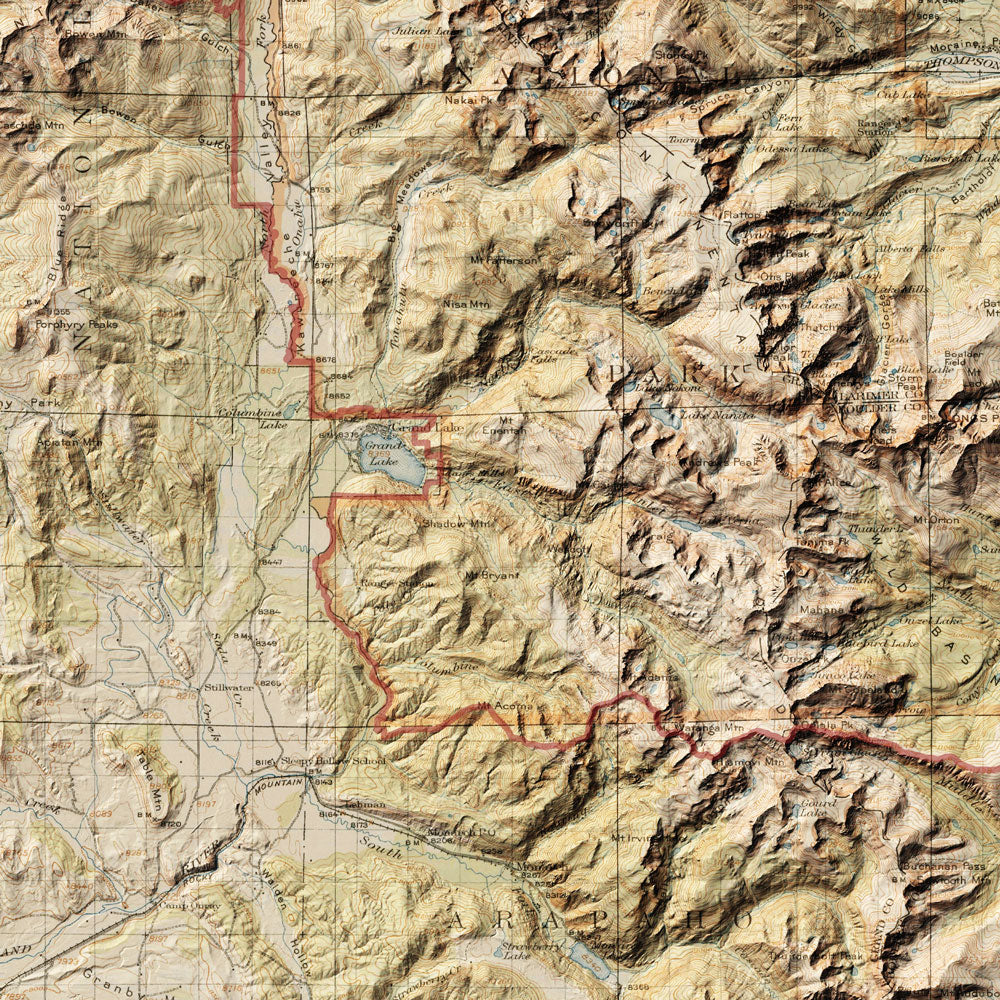
Our relief series includes US Geological Survey (USGS) topographic maps as their base with superimposed hillshade to provide the accentuated relief. Our relief series is in color and provides the detail associated with USGS maps, but has less vertical exaggeration and hillshading. Our elevation series features the physical landforms. This series is created by exaggerating a digital elevation model and casting hillshade. To enable the land features to shine, we craft them in black and white. It all results in the artful illusion of a 3D map on 2D paper.